 Explore
 Validate
 Learn
LearnPA5-30492
antibody from Invitrogen Antibodies
Targeting: KIF4A
FLJ12530, FLJ12655, FLJ14204, FLJ20631, HSA271784, KIF4, KIF4-G1, MRX100
 Western blot
 Immunocytochemistry
Antibody data
- Antibody Data
- Antigen structure
- References [3]
- Comments [0]
- Validations
- Immunocytochemistry [1]
- Immunohistochemistry [1]
- Other assay [5]
Submit
Validation data
Reference
Comment
Report error
- Product number
- PA5-30492 - Provider product page

- Provider
- Invitrogen Antibodies
- Product name
- KIF4A Polyclonal Antibody
- Antibody type
- Polyclonal
- Antigen
- Recombinant full-length protein
- Description
- Recommended positive controls: HeLa, HepG2, HCT116, 293T, A431. Predicted reactivity: Xenopus laevis (80%), Chicken (81%), Bovine (96%). Store product as a concentrated solution. Centrifuge briefly prior to opening the vial.
- Reactivity
- Human
- Host
- Rabbit
- Isotype
- IgG
- Vial size
- 100 μL
- Concentration
- 1 mg/mL
- Storage
- Store at 4°C short term. For long term storage, store at -20°C, avoiding freeze/thaw cycles.
Submitted references The kinesin KIF4 mediates HBV/HDV entry through the regulation of surface NTCP localization and can be targeted by RXR agonists in vitro.
An integrated functional and clinical genomics approach reveals genes driving aggressive metastatic prostate cancer.
Chromosome Segregation Is Biased by Kinetochore Size.
Gad SA, Sugiyama M, Tsuge M, Wakae K, Fukano K, Oshima M, Sureau C, Watanabe N, Kato T, Murayama A, Li Y, Shoji I, Shimotohno K, Chayama K, Muramatsu M, Wakita T, Nozaki T, Aly HH
PLoS pathogens 2022 Mar;18(3):e1009983
PLoS pathogens 2022 Mar;18(3):e1009983
An integrated functional and clinical genomics approach reveals genes driving aggressive metastatic prostate cancer.
Das R, Sjöström M, Shrestha R, Yogodzinski C, Egusa EA, Chesner LN, Chen WS, Chou J, Dang DK, Swinderman JT, Ge A, Hua JT, Kabir S, Quigley DA, Small EJ, Ashworth A, Feng FY, Gilbert LA
Nature communications 2021 Jul 29;12(1):4601
Nature communications 2021 Jul 29;12(1):4601
Chromosome Segregation Is Biased by Kinetochore Size.
Drpic D, Almeida AC, Aguiar P, Renda F, Damas J, Lewin HA, Larkin DM, Khodjakov A, Maiato H
Current biology : CB 2018 May 7;28(9):1344-1356.e5
Current biology : CB 2018 May 7;28(9):1344-1356.e5
No comments: Submit comment
Supportive validation
- Submitted by
- Invitrogen Antibodies (provider)
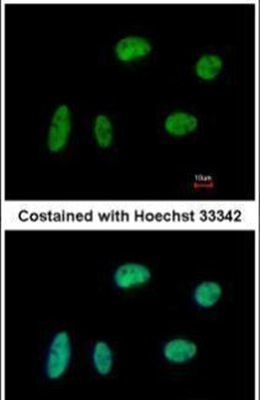
- Main image
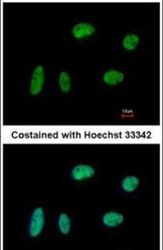
- Experimental details
- Immunofluorescent analysis of KIF4A in paraformaldehyde-fixed HeLa cells using a KIF4A polyclonal antibody (Product # PA5-30492) at a 1:200 dilution.
Supportive validation
- Submitted by
- Invitrogen Antibodies (provider)
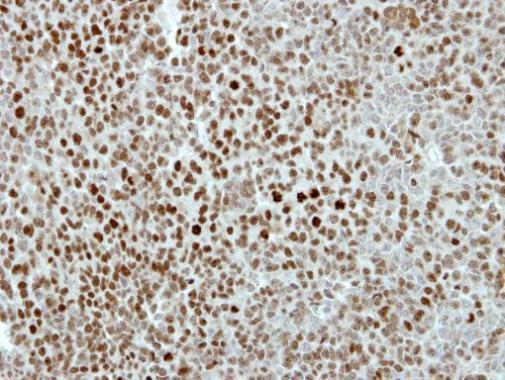
- Main image
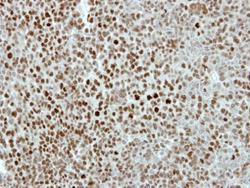
- Experimental details
- Immunohistochemical analysis of paraffin-embedded TOV-112D xenograft, using KIF4A (Product # PA5-30492) antibody at 1:500 dilution. Antigen Retrieval: EDTA based buffer, pH 8.0, 15 min.
Supportive validation
- Submitted by
- Invitrogen Antibodies (provider)
- Main image
- Experimental details
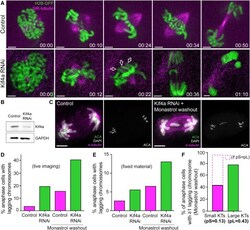
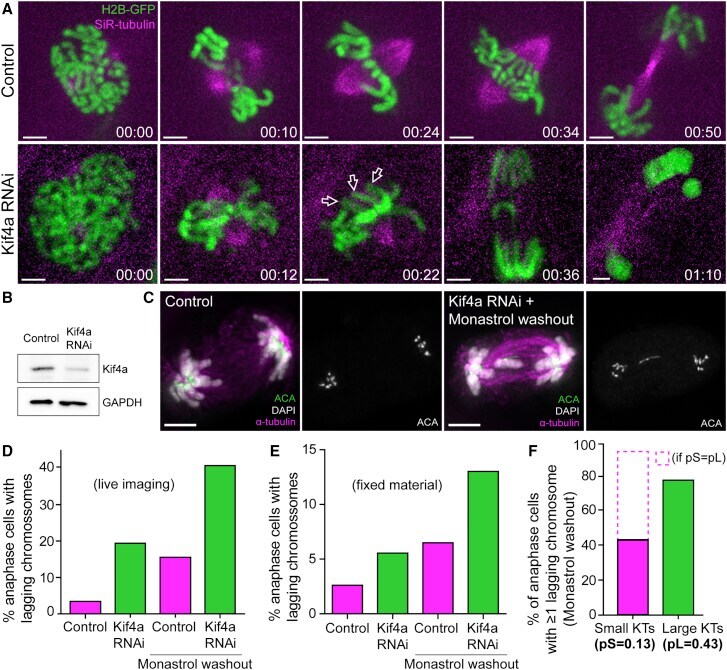
- Figure 7 Polar Ejection Forces on Chromosome Arms Ensure Mitotic Fidelity but Are Not Implicated in the Observed Missegregation Bias for Chromosomes with Large Kinetochores (A) Live-cell imaging of Indian muntjac fibroblasts stably expressing H2B-GFP to visualize the chromosomes (green) in control (top) and Kif4a RNAi (bottom) cells treated with 50 nM SiR-tubulin to label spindle microtubules (magenta). Scale bar, 5 mum. Time, hr:min. White arrows point to the chromosome arms facing the spindle poles. (B) Western blot to monitor Kif4a levels after RNAi. GAPDH was used as loading control. (C) Chromosome missegregation after Kif4a RNAi (fixed cells). Kinetochores (anti-ACA), alpha-tubulin, and DNA (DAPI) are indicated. Scale bars, 5 mum. (D and E) Comparison of the frequency of anaphase cells with lagging chromosomes in live (D) and fixed (E) material after Kif4a depletion and/or monastrol washout. (F) Frequency of anaphase cells with at least 1 lagging chromosome with small or large kinetochores after monastrol washout in Kif4a-depleted fibroblasts. Dashed bar represents theoretical values for frequencies of lagging chromosomes with small kinetochores if the probability to lag was equal for chromosomes with small or large kinetochores. See also Video S7 .
- Submitted by
- Invitrogen Antibodies (provider)
- Main image
- Experimental details
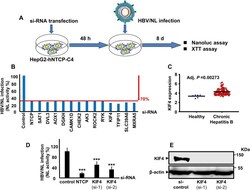
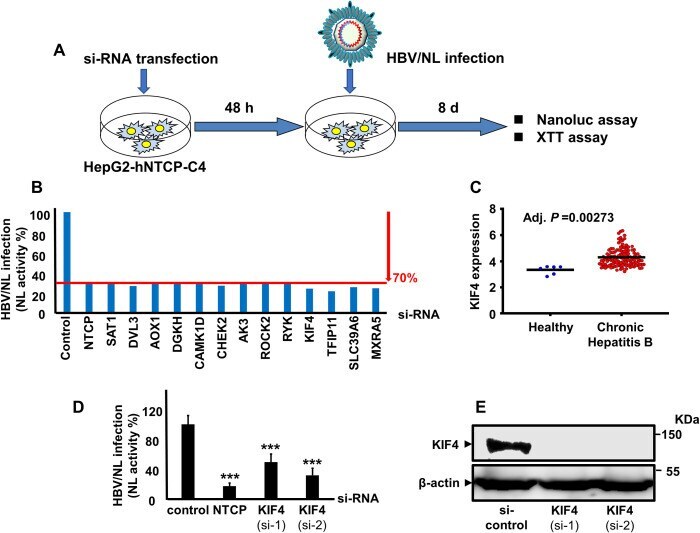
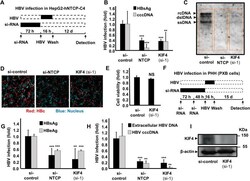
- 10.1371/journal.ppat.1009983.g001 Fig 1 KIF4 is a proviral host factor required for HBV infection and its expression is enhanced in chronic hepatitis B patients. (A) A schematic representation of the experimental HBV/NL infection schedule in HepG2-hNTCP used for siRNA library screening. (B) HepG2-hNTCP cells were transfected with control, NTCP, or host gene targeting siRNAs from the Silencer Select Human Druggable Genome siRNA Library V4 (Thermo Fisher Scientific, 4397922); host genes siRNA plates were screened as described in the Material and Methods section. After 2 days of transfection, the cells were inoculated with the HBV/NL reporter virus. At 8 dpi, the luciferase assays were performed, and the NL activity was measured and presented as a percentage relative to control siRNA-transfected cells. Of the 2,200 host genes, only 14 genes showed an average of >=70% reduction of the NL activity upon silencing with a minimum of two independent siRNAs. (C) The KIF4 mRNA levels in the liver tissues of patients with chronic HBV infection (n = 122) and healthy subjects (n = 6) (GEO accession number GSE83148). (D) HepG2-hNTCP cells were transfected with si-control, si-NTCP, or siRNAs against KIF4 (si-1, and si-2) for 2 days and then inoculated with the HBV/NL reporter virus. At 8 dpi, the cells were lysed, and the luciferase assays were performed, and the NL activity was measured, normalized to cell viability, and plotted as fold changes, relative to control siRNA-transfected cells.
- Submitted by
- Invitrogen Antibodies (provider)
- Main image
- Experimental details
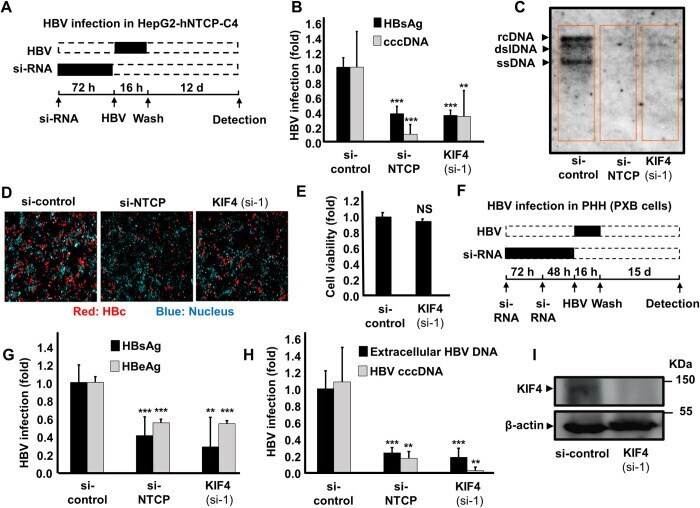
- 10.1371/journal.ppat.1009983.g002 Fig 2 Decreased KIF4 expression suppressed HBV infection in HepG2-hNTCP and primary human hepatocytes (PHH). (A) Schematic diagram depicting the scheme for siRNA transfection and subsequent HBV infection in HepG2-hNTCP; HepG2-hNTCP cells were transfected with si-control, si-NTCP, or si-KIF4 (si-1) for 72 h and then inoculated with HBV at 6,000 GEq/cell in the presence of 4% PEG8000 for 16 h. After free HBV were washed out, the cells were cultured for an additional 12 days, followed by the detection of different HBV markers. Black and dashed boxes indicate the interval for treatment and without treatment, respectively. (B) HBsAg secreted into the culture supernatant was collected at 10 dpi, quantified by ELISA, and presented as fold changes, relative to the values of control siRNA-transfected cells. (B) HBV cccDNA, (C) Intracellular HBV DNA, and (D) HBc protein in the cells were detected at 13 dpi by real-time PCR, Southern blot analysis, and immunofluorescence, respectively. Red and blue signals in panel (D) depict the staining of HBc protein and nucleus, respectively. (E) Cell viability was also examined by the XTT assay. (F) Schematic diagram showing the scheme for siRNA transfection and the subsequent HBV infection in primary human hepatocytes (PXB); primary human hepatocytes were twice transfected with si-control, si-NTCP, or si-KIF4 (si-1) for consecutive 72 h and 48 h, followed by HBV inoculation at 1,000 GEq/cell in the presence of 4%
- Submitted by
- Invitrogen Antibodies (provider)
- Main image

- Experimental details
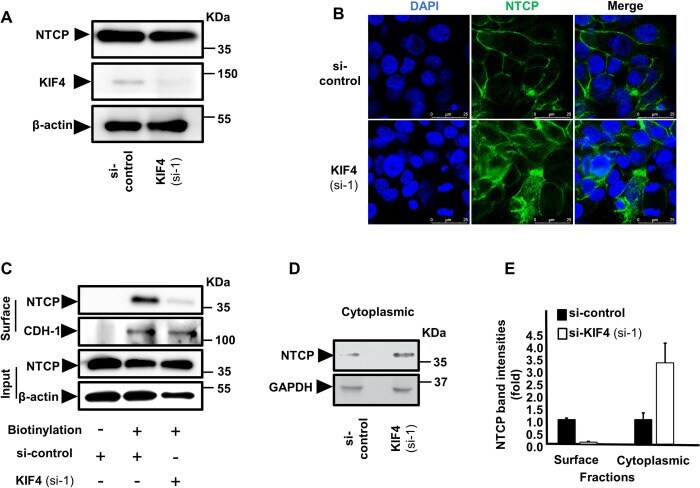
- 10.1371/journal.ppat.1009983.g004 Fig 4 KIF4 regulates the surface NTCP expression. (A) HepG2-hNTCP were transfected with either si-control or si-KIF4 (si-1) and incubated for 72 h; the cells were then lysed and the expressions of total NTCP ( upper panel ), KIF4 ( middle panel ), and beta-actin (loading control) ( lower panel ) were examined in the whole protein lysate by Western blotting. (B) HepG2-hNTCP were transfected with siRNAs (as in Fig 4A ) and incubated for 72 h; the cells were then fixed with 4% paraformaldehyde, permeabilized with 0.3% Triton X-100, and stained with NTCP antibody and visualized with confocal microscopy. Green and blue signals depict the staining of NTCP (both surface and cytoplasmic), and nuclei, respectively. (C) HepG2-hNTCP were transfected with siRNAs (as in Fig 4A ); at 3 days post-transfection, the cells were surface biotinylated or PBS treated at 4degC for 30 min before cell lysis. After centrifugation and the removal of cell debris, the cell lysates were collected and an aliquot (1/10 volume) was used for the detection of NTCP protein ( Input; upper panel ) and beta-actin (loading control) ( Input; lower panels ) by immunoblotting. The remaining cell lysates (9/10 of the original volume) were subjected to pull-down via incubation with pre-washed SA beads for 2 h at 4degC; after washing, the biotinylated surface proteins were eluted and subjected to western blotting in order to detect the surface NTCP and CDH-1 (loading control for surface
- Submitted by
- Invitrogen Antibodies (provider)
- Main image
- Experimental details
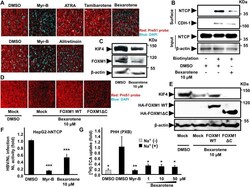
- 10.1371/journal.ppat.1009983.g007 Fig 7 RXR agonists suppressed KIF4-mediated surface NTCP transport. (A) HepG2-hNTCP pretreated with DMSO, 10 muM of the indicated compounds (Bexarotene, ATRA, Tamibarotene) ( upper panel ), or Alitretinoin (10 muM) ( lower panel ) for 72 h were incubated with TAMRA-labeled preS1 peptide (preS1 probe) for 30 min at 37degC and then examined by fluorescence microscopy. DMSO-treated cells were incubated with a preS1 probe either in the absence (negative control) or presence (positive control) of 100 nM Myrcludex-B (Myr-B); Red and blue signals indicate preS1 probe and the nucleus, respectively. (B) HepG2-hNTCP were treated with DMSO or 10 muM Bexarotene for 72 h, the cells were then surface biotinylated or PBS treated at 4degC for 30 min prior to cell lysis, the cell lysates were collected and an aliquot (1/10 volume) was used for detection of NTCP protein (input) ( Input; upper panel) and beta-actin (loading control) by immunoblotting ( Input; lower panel ). The remaining cell lysates (9/10 of the original volume) were subjected to pull-down via incubation with pre-washed SA beads for 2 h at 4degC; after washing, the biotinylated surface proteins were eluted and subjected to western blotting to detect the surface NTCP ( Surface ; upper panel) and CDH-1 (loading control for surface fraction) ( Surface ; lower panel ) with the respective antibodies. (C) HepG2-hNTCP cells treated with DMSO or 10 muM Bexarotene for 72 h were lysed and total cell lys
