Explore
 Validate
 Learn
Learn Western blot
 Immunocytochemistry
Antibody data
- Antibody Data
- Antigen structure
- References [15]
- Comments [0]
- Validations
- Immunocytochemistry [3]
- Immunohistochemistry [1]
- Other assay [13]
Submit
Validation data
Reference
Comment
Report error
- Product number
- PA5-22124 - Provider product page

- Provider
- Invitrogen Antibodies
- Product name
- PSAT1 Polyclonal Antibody
- Antibody type
- Polyclonal
- Antigen
- Recombinant full-length protein
- Description
- Recommended positive controls: 293T, A549, H1299, HCT116, Mouse brain. Predicted reactivity: Mouse (95%), Rat (95%), Xenopus laevis (82%), Rabbit (94%), Bovine (95%). Store product as a concentrated solution. Centrifuge briefly prior to opening the vial.
- Reactivity
- Human, Mouse
- Host
- Rabbit
- Isotype
- IgG
- Vial size
- 100 μL
- Concentration
- 0.23 mg/mL
- Storage
- Store at 4°C short term. For long term storage, store at -20°C, avoiding freeze/thaw cycles.
Submitted references PHGDH is required for germinal center formation and is a therapeutic target in MYC-driven lymphoma.
Lineage-specific silencing of PSAT1 induces serine auxotrophy and sensitivity to dietary serine starvation in luminal breast tumors.
Cul4A-DDB1-mediated monoubiquitination of phosphoglycerate dehydrogenase promotes colorectal cancer metastasis via increased S-adenosylmethionine.
Targeting phosphoglycerate dehydrogenase in multiple myeloma.
Serine synthesis pathway inhibition cooperates with dietary serine and glycine limitation for cancer therapy.
Serine Biosynthesis Pathway Supports MYC-miR-494-EZH2 Feed-Forward Circuit Necessary to Maintain Metabolic and Epigenetic Reprogramming of Burkitt Lymphoma Cells.
mTORC1 amplifies the ATF4-dependent de novo serine-glycine pathway to supply glycine during TGF-β(1)-induced collagen biosynthesis.
Nf1 loss promotes Kras-driven lung adenocarcinoma and results in Psat1-mediated glutamate dependence.
HIF1α Suppresses Tumor Cell Proliferation through Inhibition of Aspartate Biosynthesis.
Translational reprogramming marks adaptation to asparagine restriction in cancer.
Computational analysis of data from a genome-wide screening identifies new PARP1 functional interactors as potential therapeutic targets.
Menin regulates the serine biosynthetic pathway in Ewing sarcoma.
Thymic Epithelial Tumors phenotype relies on miR-145-5p epigenetic regulation.
NRF2 regulates serine biosynthesis in non-small cell lung cancer.
Phosphoglycerate dehydrogenase is dispensable for breast tumor maintenance and growth.
D'Avola A, Legrave N, Tajan M, Chakravarty P, Shearer RL, King HW, Kluckova K, Cheung EC, Clear AJ, Gunawan AS, Zhang L, James LK, MacRae JI, Gribben JG, Calado DP, Vousden KH, Riches JC
The Journal of clinical investigation 2022 May 2;132(9)
The Journal of clinical investigation 2022 May 2;132(9)
Lineage-specific silencing of PSAT1 induces serine auxotrophy and sensitivity to dietary serine starvation in luminal breast tumors.
Choi BH, Rawat V, Högström J, Burns PA, Conger KO, Ozgurses ME, Patel JM, Mehta TS, Warren A, Selfors LM, Muranen T, Coloff JL
Cell reports 2022 Jan 18;38(3):110278
Cell reports 2022 Jan 18;38(3):110278
Cul4A-DDB1-mediated monoubiquitination of phosphoglycerate dehydrogenase promotes colorectal cancer metastasis via increased S-adenosylmethionine.
Zhang Y, Yu H, Zhang J, Gao H, Wang S, Li S, Wei P, Liang J, Yu G, Wang X, Li X, Li D, Yang W
The Journal of clinical investigation 2021 Nov 1;131(21)
The Journal of clinical investigation 2021 Nov 1;131(21)
Targeting phosphoglycerate dehydrogenase in multiple myeloma.
Elsaadi S, Steiro I, Abdollahi P, Vandsemb EN, Yang R, Slørdahl TS, Rø TB, Menu E, Sponaas AM, Børset M
Experimental hematology & oncology 2021 Jan 4;10(1):3
Experimental hematology & oncology 2021 Jan 4;10(1):3
Serine synthesis pathway inhibition cooperates with dietary serine and glycine limitation for cancer therapy.
Tajan M, Hennequart M, Cheung EC, Zani F, Hock AK, Legrave N, Maddocks ODK, Ridgway RA, Athineos D, Suárez-Bonnet A, Ludwig RL, Novellasdemunt L, Angelis N, Li VSW, Vlachogiannis G, Valeri N, Mainolfi N, Suri V, Friedman A, Manfredi M, Blyth K, Sansom OJ, Vousden KH
Nature communications 2021 Jan 14;12(1):366
Nature communications 2021 Jan 14;12(1):366
Serine Biosynthesis Pathway Supports MYC-miR-494-EZH2 Feed-Forward Circuit Necessary to Maintain Metabolic and Epigenetic Reprogramming of Burkitt Lymphoma Cells.
Białopiotrowicz E, Noyszewska-Kania M, Kachamakova-Trojanowska N, Łoboda A, Cybulska M, Grochowska A, Kopczyński M, Mikula M, Prochorec-Sobieszek M, Firczuk M, Graczyk-Jarzynka A, Zagożdżon R, Ząbek A, Młynarz P, Dulak J, Górniak P, Szydłowski M, Pyziak K, Martyka J, Sroka-Porada A, Jabłońska E, Polak A, Kowalczyk P, Szumera-Ciećkiewicz A, Chapuy B, Rzymski T, Brzózka K, Juszczyński P
Cancers 2020 Mar 3;12(3)
Cancers 2020 Mar 3;12(3)
mTORC1 amplifies the ATF4-dependent de novo serine-glycine pathway to supply glycine during TGF-β(1)-induced collagen biosynthesis.
Selvarajah B, Azuelos I, Platé M, Guillotin D, Forty EJ, Contento G, Woodcock HV, Redding M, Taylor A, Brunori G, Durrenberger PF, Ronzoni R, Blanchard AD, Mercer PF, Anastasiou D, Chambers RC
Science signaling 2019 May 21;12(582)
Science signaling 2019 May 21;12(582)
Nf1 loss promotes Kras-driven lung adenocarcinoma and results in Psat1-mediated glutamate dependence.
Wang X, Min S, Liu H, Wu N, Liu X, Wang T, Li W, Shen Y, Wang H, Qian Z, Xu H, Zhao C, Chen Y
EMBO molecular medicine 2019 Jun;11(6)
EMBO molecular medicine 2019 Jun;11(6)
HIF1α Suppresses Tumor Cell Proliferation through Inhibition of Aspartate Biosynthesis.
Meléndez-Rodríguez F, Urrutia AA, Lorendeau D, Rinaldi G, Roche O, Böğürcü-Seidel N, Ortega Muelas M, Mesa-Ciller C, Turiel G, Bouthelier A, Hernansanz-Agustín P, Elorza A, Escasany E, Li QOY, Torres-Capelli M, Tello D, Fuertes E, Fraga E, Martínez-Ruiz A, Pérez B, Giménez-Bachs JM, Salinas-Sánchez AS, Acker T, Sánchez Prieto R, Fendt SM, De Bock K, Aragonés J
Cell reports 2019 Feb 26;26(9):2257-2265.e4
Cell reports 2019 Feb 26;26(9):2257-2265.e4
Translational reprogramming marks adaptation to asparagine restriction in cancer.
Pathria G, Lee JS, Hasnis E, Tandoc K, Scott DA, Verma S, Feng Y, Larue L, Sahu AD, Topisirovic I, Ruppin E, Ronai ZA
Nature cell biology 2019 Dec;21(12):1590-1603
Nature cell biology 2019 Dec;21(12):1590-1603
Computational analysis of data from a genome-wide screening identifies new PARP1 functional interactors as potential therapeutic targets.
Lodovichi S, Mercatanti A, Cervelli T, Galli A
Oncotarget 2019 Apr 12;10(28):2722-2737
Oncotarget 2019 Apr 12;10(28):2722-2737
Menin regulates the serine biosynthetic pathway in Ewing sarcoma.
Svoboda LK, Teh SSK, Sud S, Kerk S, Zebolsky A, Treichel S, Thomas D, Halbrook CJ, Lee HJ, Kremer D, Zhang L, Klossowski S, Bankhead AR, Magnuson B, Ljungman M, Cierpicki T, Grembecka J, Lyssiotis CA, Lawlor ER
The Journal of pathology 2018 Jul;245(3):324-336
The Journal of pathology 2018 Jul;245(3):324-336
Thymic Epithelial Tumors phenotype relies on miR-145-5p epigenetic regulation.
Bellissimo T, Ganci F, Gallo E, Sacconi A, Tito C, De Angelis L, Pulito C, Masciarelli S, Diso D, Anile M, Petrozza V, Giangaspero F, Pescarmona E, Facciolo F, Venuta F, Marino M, Blandino G, Fazi F
Molecular cancer 2017 May 10;16(1):88
Molecular cancer 2017 May 10;16(1):88
NRF2 regulates serine biosynthesis in non-small cell lung cancer.
DeNicola GM, Chen PH, Mullarky E, Sudderth JA, Hu Z, Wu D, Tang H, Xie Y, Asara JM, Huffman KE, Wistuba II, Minna JD, DeBerardinis RJ, Cantley LC
Nature genetics 2015 Dec;47(12):1475-81
Nature genetics 2015 Dec;47(12):1475-81
Phosphoglycerate dehydrogenase is dispensable for breast tumor maintenance and growth.
Chen J, Chung F, Yang G, Pu M, Gao H, Jiang W, Yin H, Capka V, Kasibhatla S, Laffitte B, Jaeger S, Pagliarini R, Chen Y, Zhou W
Oncotarget 2013 Dec;4(12):2502-11
Oncotarget 2013 Dec;4(12):2502-11
No comments: Submit comment
Supportive validation
- Submitted by
- Invitrogen Antibodies (provider)
- Main image
- Experimental details
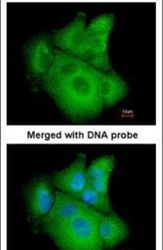
- Immunofluorescent analysis of PSAT1 in paraformaldehyde-fixed A549 cells using a PSAT1 polyclonal antibody (Product # PA5-22124) at a 1:200 dilution.
- Submitted by
- Invitrogen Antibodies (provider)
- Main image
- Experimental details
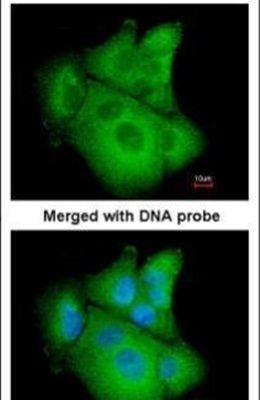
- Immunofluorescence analysis of paraformaldehyde-fixed A549, using PSAT1 (Product # PA5-22124) antibody at 1:200 dilution.

- Submitted by
- Invitrogen Antibodies (provider)
- Main image

- Experimental details
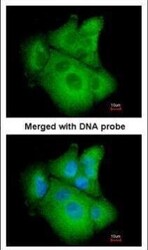
- Immunofluorescence analysis of paraformaldehyde-fixed A549, using PSAT1 (Product # PA5-22124) antibody at 1:200 dilution.

Supportive validation
- Submitted by
- Invitrogen Antibodies (provider)
- Main image

- Experimental details
- Immunohistochemical analysis of paraffin-embedded NCI-N87 xenograft, using PSAT1 (Product # PA5-22124) antibody at 1:500 dilution. Antigen Retrieval: EDTA based buffer, pH 8.0, 15 min.
Supportive validation
- Submitted by
- Invitrogen Antibodies (provider)
- Main image
- Experimental details
- NULL
- Submitted by
- Invitrogen Antibodies (provider)
- Main image
- Experimental details
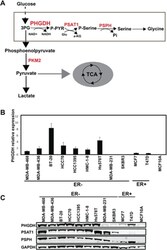
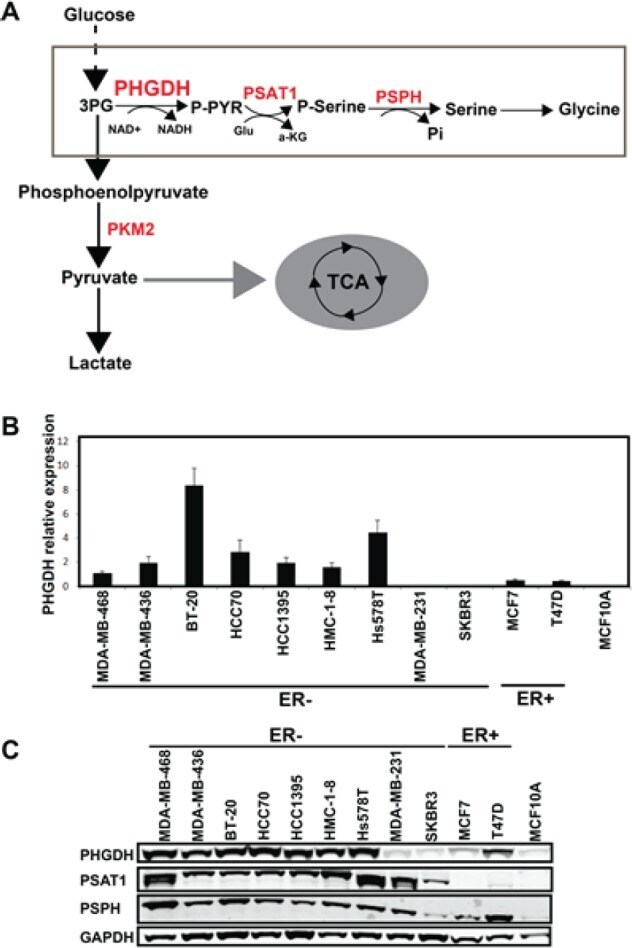
- Fig 1 PHGDH shows a differential expression pattern among human breast cancer cell lines A. The schematic of diversion of glucose metabolism into serine and glycine metabolism through PHGDH . B. The mRNA levels of PHGDH were measured among different human breast cancer cell lines. Total RNA was isolated and real-time PCR analysis was performed. Taqman probe of target gene and B2M transcripts were coamplified. The mRNA expressions of target genes were normalized to B2M levels. All experiments were performed in triplicate. C. Western blotting analysis of human breast cancer cells. Cancer cell samples were collected from different human breast cancer cell lines. The protein lysates were prepared and western blotting analysis of PHGDH , PSAT1, PSPH and GAPDH were performed.
- Submitted by
- Invitrogen Antibodies (provider)
- Main image
- Experimental details
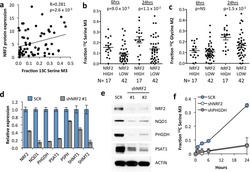
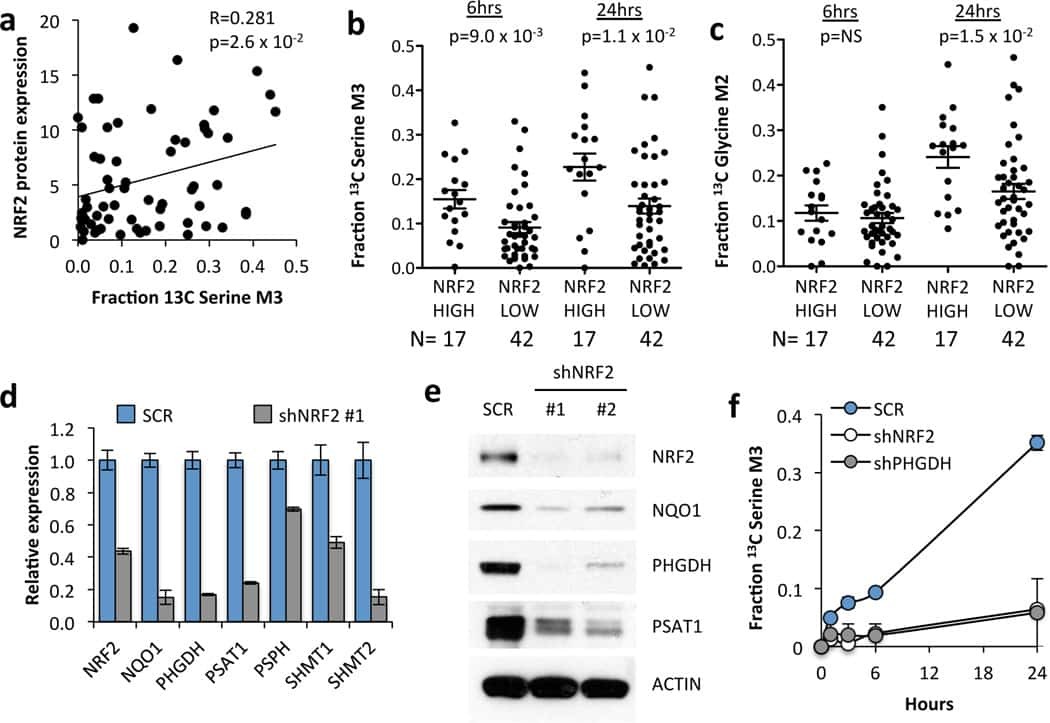
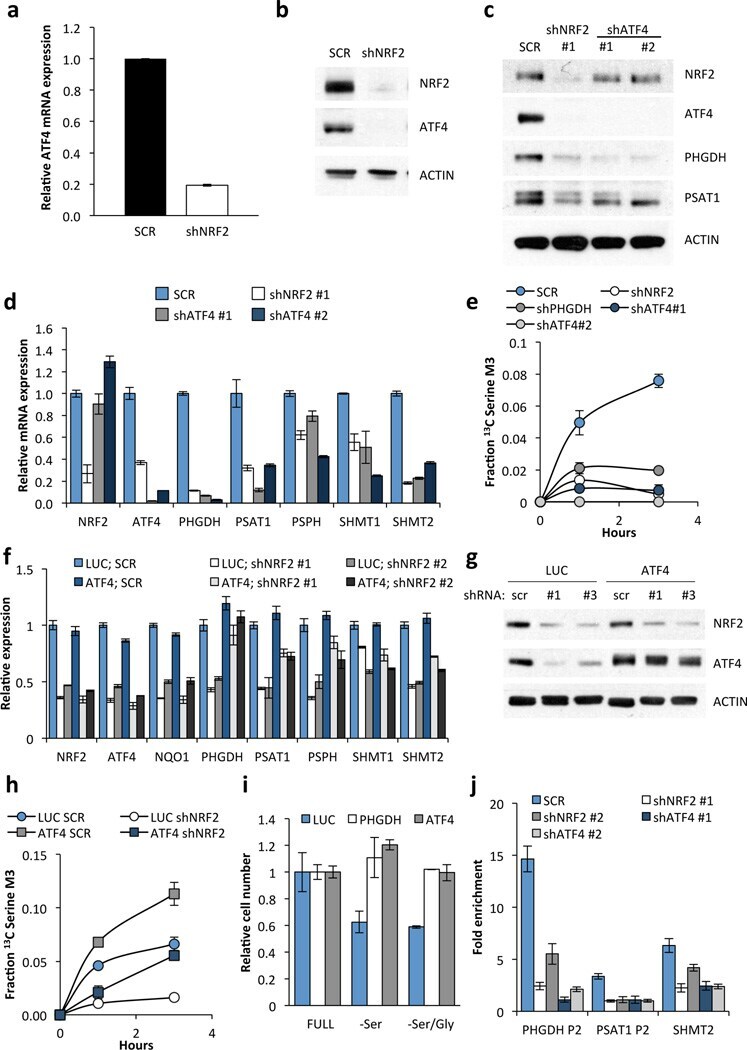
- Figure 3 NRF2 regulates the expression of serine/glycine biosynthesis genes through ATF4. (a) ATF4 mRNA expression in A549 cells expressing scramble shRNA (SCR), or NRF2 shRNA #1. (b) Western blot of NRF2, ATF4 and ACTIN expression in cells from (a). (c) Western blot of NRF2, ATF4 and serine pathway enzyme expression in lysates from A549s expressing scramble (SCR), NRF2 shRNA #1, or ATF4 shRNAs #1 or #2. (d) mRNA expression in cells from (c). (e) ATF4 knockdown impairs serine biosynthesis. Cell lines from were grown in the presence of U- 13 C-glucose for the indicated time points, the metabolites extracted and the fractional 13 C-labeling on serine analysed by LC/MS. (f) ATF4 rescues serine biosynthesis enzyme expression following NRF2 knockdown. A549 cells were infected with lentivirus encoding mATF4 prior to infection with scramble or NRF2-targeting lentivirus. (g) Western analysis of NRF2, ATF4, and ACTIN expression in the cells from (f). (h) ATF4 rescues the serine biosynthesis defect in shNRF2 A549 cells. Cells were assayed as in (e). (i) ATF4 rescues the growth of H1975 cells in serine deficient media. Cells expressing luciferase (LUC) or ATF4 were grown in the indicated media for 3 days and cell number normalized to cells grown in full media. (j) Chromatin immunoprecipitation of ATF4 to the PHGDH, PSAT1 and SHMT2 promoters. Samples were normalized to IgG control immunoprecipitations. Results are the average of 3 technical (a, d, f, j) or biological (e, h, i) replicates
- Submitted by
- Invitrogen Antibodies (provider)
- Main image
- Experimental details
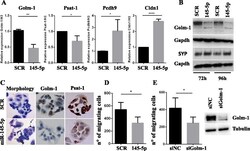
- Fig. 3 Overexpression of miR-145-5p in a Thymic Carcinoma (TC1889) cell line. a RT-qPCR to evaluate the expression levels of miR-145-5p inversely correlated (Golm-1 and Psat-1) and positively correlated (Pcdh9 and Cldn1) genes after miR-145-5p overexpression in TC1889 cells. b Western-blot analysis of Golm-1 and Synaptophysin (SYP) proteins after 72 h and 96 h of miR-145-5p overexpression in TC1889 cells. c Morphological and IHC analyses for Golm-1 and Psat-1 of miR-145-5p overexpression in TC1889 cells after 144 h or 96 h respectively. d - e Evaluation of the impact of miR-145-5p overexpression or siRNA for Golm-1 (siGolm-1) in TC1889 by migration assay after 120 h and 72 h respectively. P-value was calculated by unpaired t -test and a value of P

- Submitted by
- Invitrogen Antibodies (provider)
- Main image
- Experimental details
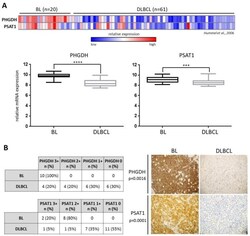
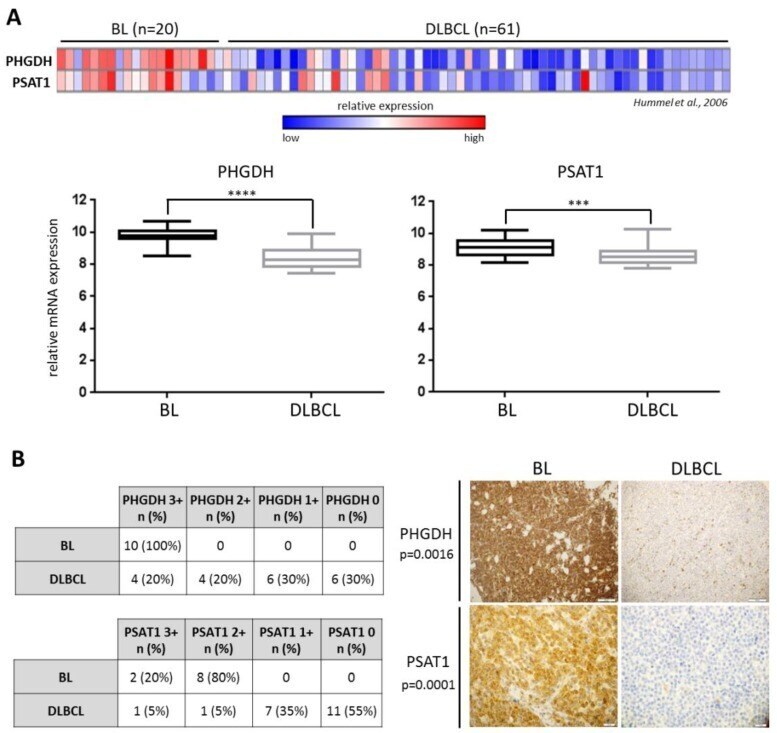
- Figure 1 PHGDH and PSAT1 mRNA expression is significantly higher in Burkitt lymphoma (BL) than diffuse large B-cell lymphoma (DLBCL) primary cells. ( A ) Upper: Relative PHGDH and PSAT1 transcript abundance in primary tumor samples derived from 20 BL and 61 DLBCL patients. Each column represents a sample and each row refers to a gene probe; columns are ordered by tumor type (BL and DLBCL) as indicated. Color scale at the bottom indicates relative expression and standard deviations from the mean; n --number of patients. Lower: box plots illustrating differences in PHGDH and PSAT1 expression between BL and DLBCL primary samples; the median expression is indicated by the horizontal line, bars denote +- 25-75 percentile and whiskers indicate the range. Statistical analysis was performed using the Mann-Whitney test, **** for p < 0.0001 and *** for p < 0.001. ( B ) The expression of PHGDH and PSAT1 proteins is significantly higher in BL than DLBCL primary tumors. The immunohistochemical analysis included a group of 10 BL patients and 20 DLBCLs. The scale from 3+ to 0 refers to the staining intensity, where 3+ refers to strong staining and 0 means no staining. Cases 3+ or 2+ in IHC were considered high-expressers, whereas cases 1+ or 0 were considered low expressers. Numbers/frequencies of high- versus low-expressers in BL vs. DLBCL were compared using the two-sided Fisher exact test. Representative cases of PHGDH +/- and PSAT1 +/- BLs and DLBCLs diagnostic formalin-fixed paraffin-e
- Submitted by
- Invitrogen Antibodies (provider)
- Main image
- Experimental details
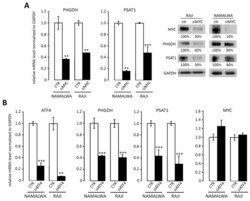
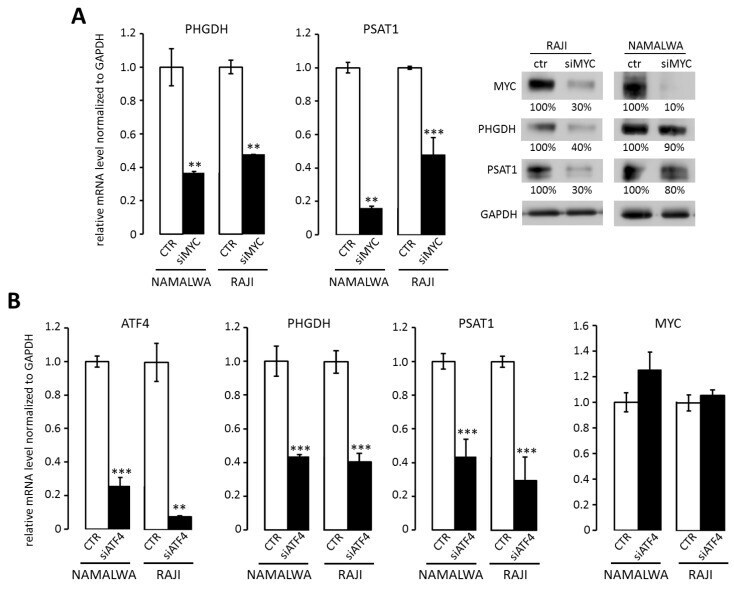
- Figure 2 MYC regulates PHGDH and PSAT1 expression through ATF4 transcription factor. ( A ) MYC silencing decreases PHGDH and PSAT1 transcript and protein levels in RAJI and NAMALWA BL cell lines. Representative Western blots showing PHGDH and PSAT1 protein abundance after MYC silencing are shown. Protein abundance was quantified by densitometry using ImageJ software and presented as % of control. ( B ) The knockdown of ATF4 transcription factor decreases PHGDH and PSAT1 gene expression in BL cells. BL cells were transduced with siRNA targeting ATF4, incubated for 48 h, then the expression of ATF4, PHGDH, PSAT1, and MYC genes was analyzed with RQ-PCR. In ( A ) and ( B ), bar graphs represent averages of three independent experiments performed in technical triplicates, error bars represent standard deviation (SD). Statistical differences were assessed using t -test; * for p < 0.05; ** for p < 0.01 and *** for p < 0.001.
- Submitted by
- Invitrogen Antibodies (provider)
- Main image
- Experimental details
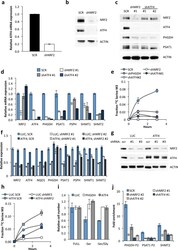
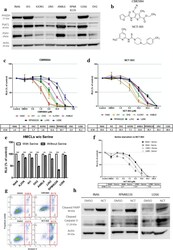
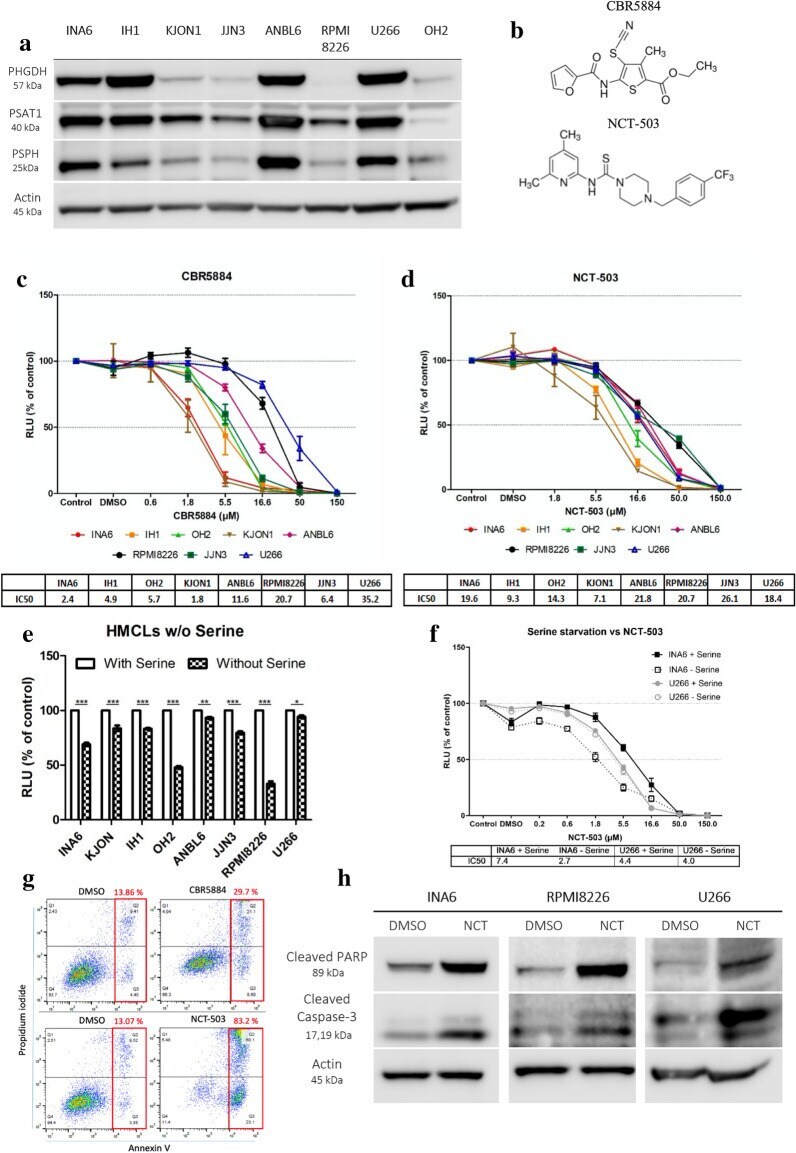
- Fig. 1 HMCLs express PHGDH and are sensitive to its inhibition. a The expression of PHGDH, PSAT1, and PSPH was assessed by WB in eight HMCLs. b The chemical structure of both PHGDH inhibitors, CBR5884 and NCT-503. c , d CellTiter-Glo was used to assess HMCLs' sensitivity to both PHGDH inhibitors, CBR5884 and NCT-503, respectively. The cells were treated with indicated doses overnight. e Proliferation of HMCLs after an overnight incubation were incubated overnight with or without serine. f Proliferation of INA6 and U266 cells were treated overnight with different doses of NCT-503 in the presence or absence of serine. g INA6 cells were treated overnight with their corresponding IC50 x 3 doses of CBR5884 or NCT-503, and then apoptosis was assessed by flowcytometry using Annexin-V/PI assay. h INA6, RPMI8226 and U266 cells were treated for 4 h with double their corresponding IC50 of NCT-503, and then apoptotic proteins were investigated by WB. All the presented graphs and calculated IC50s represent three independent experiments with minimum two replicates. Error bars are +- SEM and * P
- Submitted by
- Invitrogen Antibodies (provider)
- Main image

- Experimental details
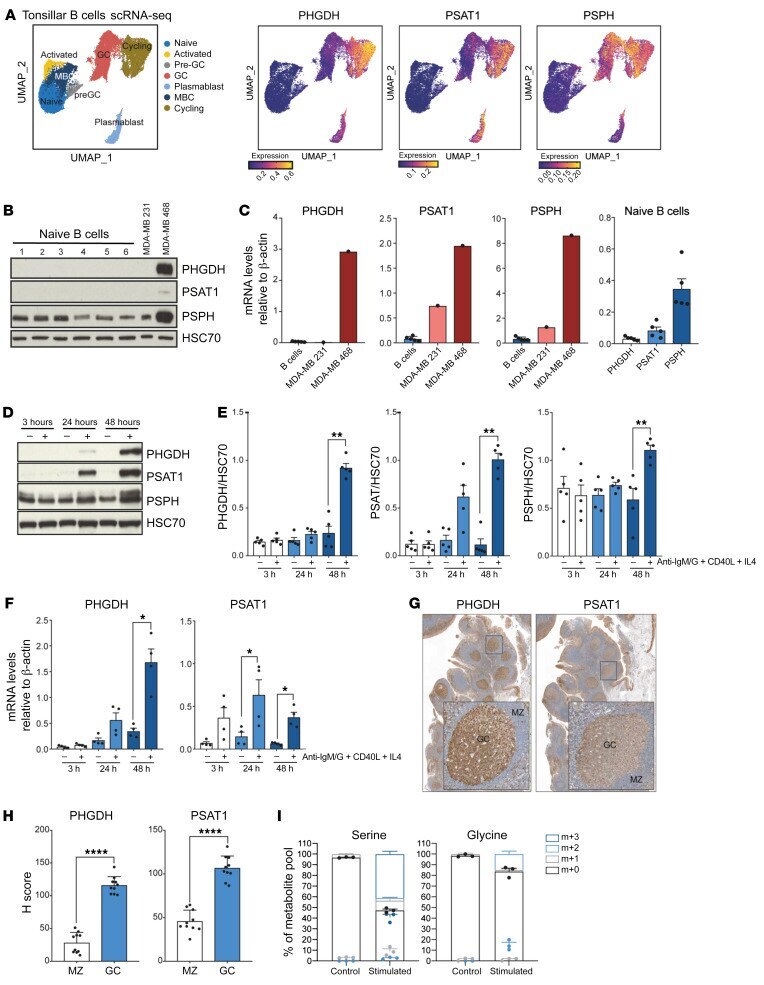
- Upregulation of the SSP is a metabolic hallmark of GC B cells. ( A ) Uniform Manifold Approximation and Projection (UMAP) of tonsillar B cell single-cell RNA clusters (including naive, activated, pre-GC, total GC, plasmablasts, memory [MBC], and cycling B cells) (left). Expression of SSP-network genes in B cell subsets (right). ( B ) Analysis of PHGDH, PSAT1 and PSPH protein levels in human naive B cells isolated from blood bank volunteers by immunoblotting ( n = 6). MDA-MB-231 and MDA-MB-468 cell lines were used as control for low and high SSP-enzyme expression, respectively. ( C ) Quantification of specific transcript levels relative to beta-actin mRNA levels. ( D ) Representative immunoblot of PHGDH, PSAT1, and PSPH in resting and activated human naive B cells. Human B cells were left unstimulated (-) or stimulated (+) with anti-IgM/G antibody, CD40 ligand (CD40L), and IL-4 for 3, 24, and 48 hours. ( E ) Quantification of protein levels shown in D normalized to HSC70. ( F ) Relative mRNA expression of SSP enzyme genes in resting and activated human B cells determined by qPCR. Isolated human B cells were left unstimulated (-) or stimulated with (+) with anti-IgM/G antibody, CD40L, and IL-4 for 3, 24, and 48 hours before mRNA extraction. Transcript levels were determined relative to beta-actin mRNA levels ( n = 4). ( G and H ) Representative IHC staining for PHGDH and PSAT1 in germinal center (GC) and mantle zone (MZ) areas in sequential sections of human reactive tonsils (x
- Submitted by
- Invitrogen Antibodies (provider)
- Main image
- Experimental details
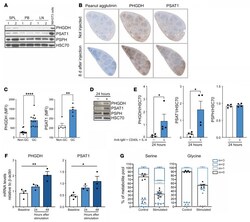
- Characterization of the SSP in WT mice after activation in vivo. ( A ) Analysis of PHGDH, PSAT1, and PSPH protein levels in resting B cells isolated from mouse spleen (SPL), peripheral blood (PB), and lymph nodes (LN). NIH3T3 murine cells were used as control for high expression of SSP-related enzymes. ( B ) Representative IHC staining for PNA as GC marker, PHGDH, and PSAT1 on consecutive spleen sections derived from mouse spleens 8 days after sheep RBC immunization (x5 magnification). ( C ) Expression of PHGDH and PSAT1 in GC B cells and non-GC B cells harvested from mouse spleen 8 days after immunization with sheep RBC. ( D ) Representative immunoblots of PHGDH, PSAT1, and PSPH proteins levels in murine resting and activated B cells. ( E ) Mouse B cells were isolated from spleen and left unstimulated (-) or stimulated (+) with anti-IgM/G antibody, CD40L, and IL-4 for 24 hours before protein extraction and quantification of protein levels normalized to HSC70. Individual samples (dots) and means (bars) values are plotted ( n = 4). ( F ) Relative mRNA expression of SSP enzyme genes in resting and activated mouse B cells as determined by qPCR. Isolated mouse B cells were left unstimulated or stimulated with anti-IgM/G antibody, CD40L, and IL-4 for 24 and 48 hours before mRNA extraction. Specific transcript levels were determined relative to beta-actin mRNA levels ( n = 4). ( G ) Mass isotopologue distribution of U-[ 13 C 6 ]-glucose-derived serine and glycine from murine restin

- Submitted by
- Invitrogen Antibodies (provider)
- Main image
- Experimental details
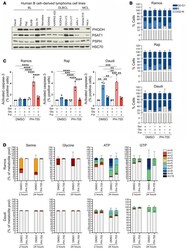
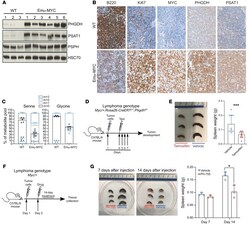
- Figure 6 PHGDH inhibition impairs proliferation and promotes apoptosis in Burkitt lymphoma cells. ( A ) Western blot analysis of PHGDH, PSAT1, and PSPH protein expression in B cell-derived lymphoma cell lines (mantle cell lymphoma [MCL]). Representative of 3 independent experiments. HSC70 was used as loading control. ( B ) Cell cycle profile of Ramos (top), Raji (center), and Daudi (bottom) cells. Cells were plated either in complete medium or equivalent medium lacking serine and glycine supplemented or not with 0.5 mM sodium formate and 0.4 mM glycine and treated with DMSO (as a solvent control) or 10 muM PH-755, followed by incubation with 10 muM BrdU and by staining with anti-BrdU and 7-ADD. Data are presented as mean +- SEM and are representative of 3 independent experiments, with value for DMSO-treated cells and cultured in complete medium set to 1.0. ( C ) Ramos (left), Raji (center), and Daudi (right) cells were cultured in the same conditions specified in B for 48 hours. Cells were then permeabilized, fixed, and stained for active Caspase-3. Positive cells for active Caspase-3 were analyzed by flow cytometry. Graph shows the mean derived from 3 independent experiments, with value for DMSO-treated cells and cultured in complete medium set to 1.0. Data are shown as the mean +- SEM. ** P < 0.01, *** P < 0.001, and **** P < 0.0001, by 1-way ANOVA with Tukey's post hoc test. ( D ) Mass isotopologue distribution of U-[ 13 C 6 ]-glucose-derived serine and glycine for Ramos (
- Submitted by
- Invitrogen Antibodies (provider)
- Main image
- Experimental details
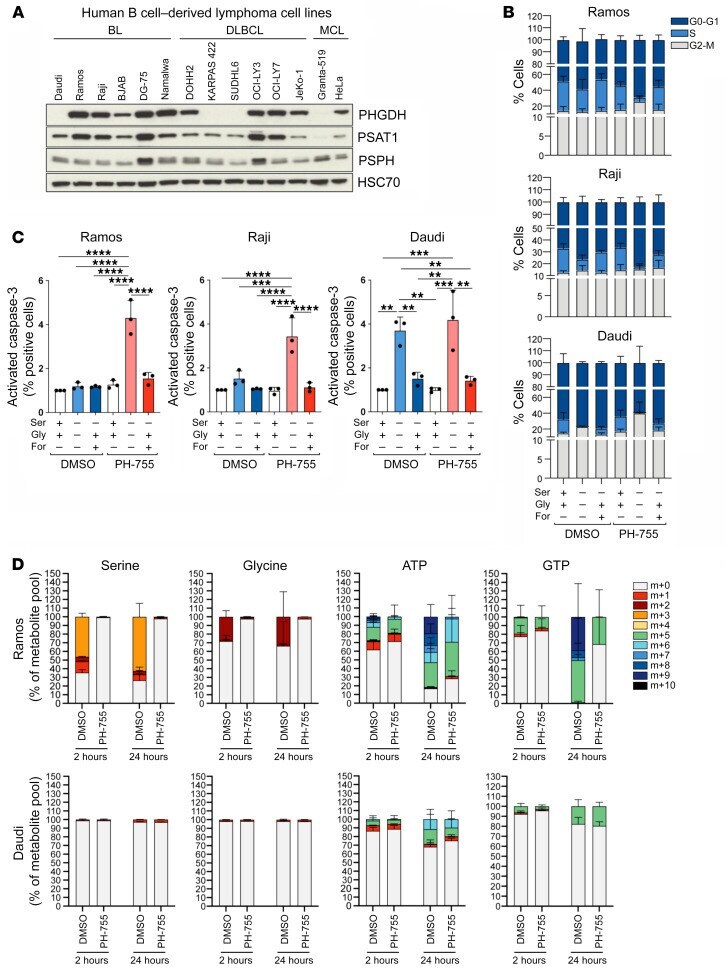
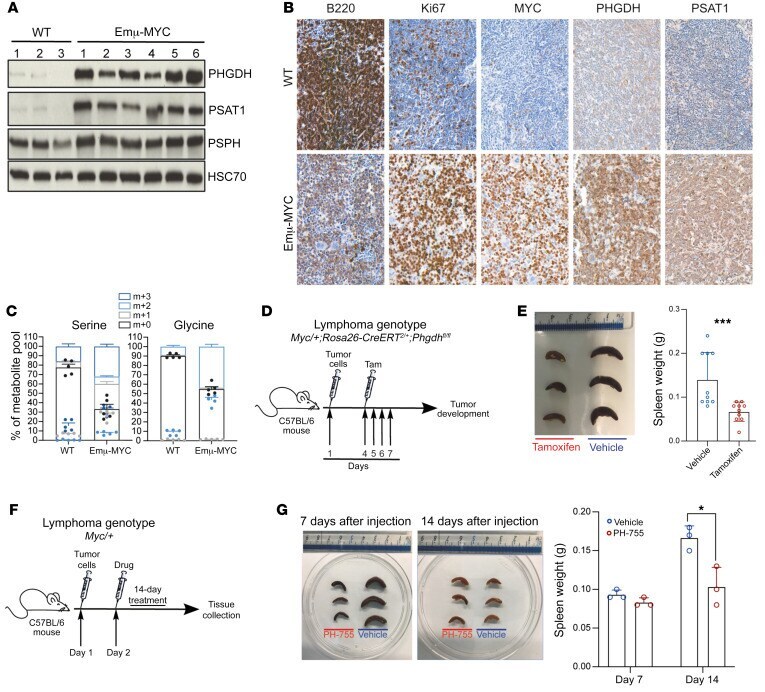
- Genetic loss and pharmacological inhibition of PHGDH reduces lymphoma progression in vivo. ( A ) Immunoblot of PHGDH, PSAT1, and PSPH expression in splenic B cells from WT ( n = 3) and Emu-Myc mice ( n = 6). HSC70 was used as loading control. ( B ) Representative IHC staining (x20 magnification) for B220, Ki67, MYC, PHGDH, and PSAT1 abundance in sections of spleens from either WT ( n = 3) or Emu-Myc ( n = 3) mice. ( C ) Isotope tracing analysis in splenic B cells isolated from either C57BL/6J WT mice or Emu-MYC mice and cultured for 2 hours with 13 C 6 -labeled glucose. Serine and glycine levels were measured by LC-MS. The percent distribution of each isotopologue of their respective metabolite pool is represented as mean +- SEM of triplicate cultures and is representative of 3 independent experiments. ( D ) Schematic showing lymphoma transplantation model, in which Myc/+;Rosa26-CreER T2/+ ;Phgdh fl/fl lymphoma cells are injected via the tail vein into 9-week-old male C57BL/6J mice. Three days after lymphoma engraftment, mice were randomized to receive either vehicle or tamoxifen treatment by oral gavage for 4 days. Samples were collected 20 days after injection. ( E ) Representative pictures of spleens from mice ( n = 3 per group) sacrificed 20 days after transplantation (left), and quantification of the spleen weight (right). ( F ) Schematic showing lymphoma transplantation model, in which Myc/+ lymphoma cells are injected via the tail vein into 9-week-old male C57BL/6J mic
- Submitted by
- Invitrogen Antibodies (provider)
- Main image

- Experimental details
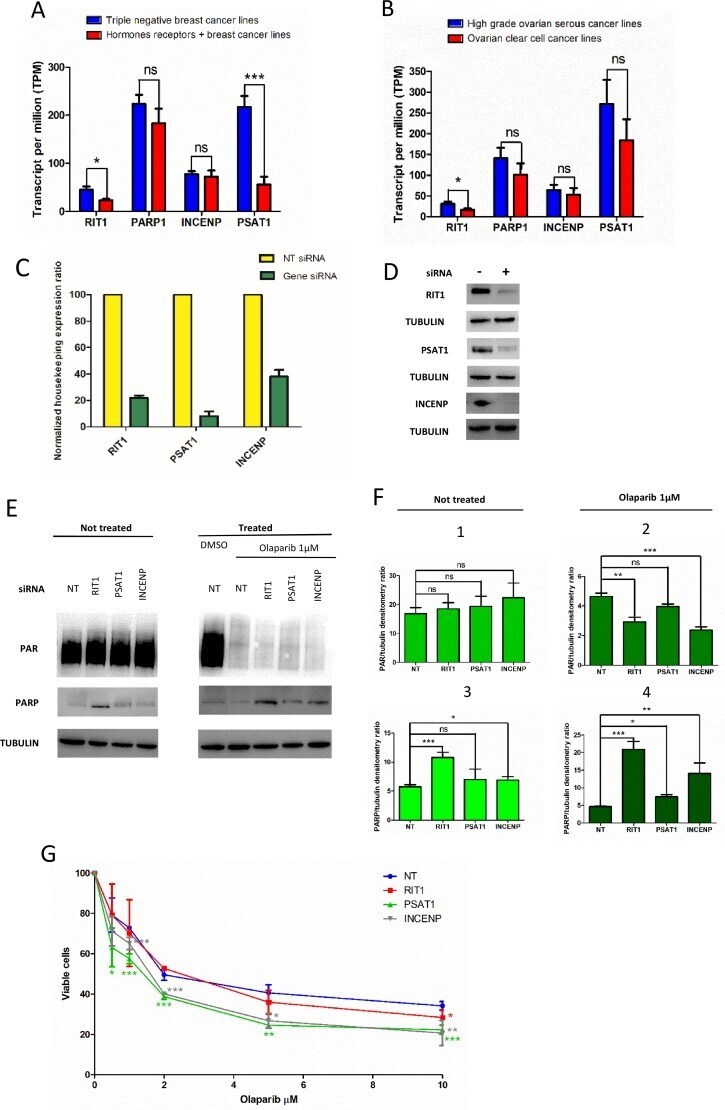
- Figure 3 Effect of RIT1, INCENP and PSAT1 on PARylation and PARP1 protein level, and olaparip sensitivity (A) Expression of INCENP, RIT1 and PSAT1 in triple negative and hormone receptor positive (+) breast cancer cell lines: (B) Expression of INCENP, RIT1 and PSAT1 in high grade serous and ovarian clear cell cancer lines. Data were compared and statically analyzed by Student's t -test as indicated: ns, not significant, * p
- Submitted by
- Invitrogen Antibodies (provider)
- Main image

- Experimental details
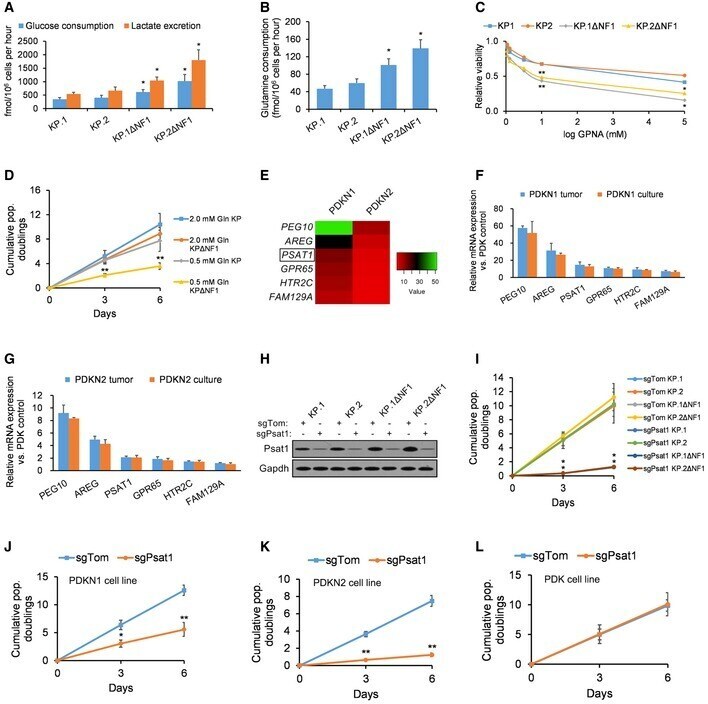
- Figure 3 Nf1-silenced cells are sensitive to reduced glutamine levels A Glucose consumption and lactate excretion in KP and KPDeltaNF1 clones normalized by cell count ( n = 4 biological replicates). B Glutamine consumption in KP and KPDeltaNF1 clones normalized by cell count ( n = 4 biological replicates). C Relative viability of KP and KPDeltaNF1 cells after 72 h of GPNA treatment assayed by cell-titer glo (relative luminescent units; n = 4 biological replicates). D Cumulative population doublings of KP and KPDeltaNF1 cells cultured with 2.0 or 0.5 mM glutamine ( n = 4 biological replicates). E Two patient-derived KRAS;NF1 -mutant LUAD cell lines (PDKN1, PDKN2), as well as the control patient-derived KRAS -mutant/ NF1 -WT LUAD cell line (PDK), were passaged for 14 population doublings prior to collection. The heatmap displays the most significantly upregulated genes in the PDKN1 and PDKN2 cell lines (relative to the PDK control), with the degree of absolute fold-change upregulation depicted by color as indicated in the legend. F, G Quantification of the expression of the six key altered genes in cultured PDKN1 and PDKN2 cells (passaged for 14 population doublings) vs. their respective original patient tumor samples using qPCR ( n = 4 biological replicates). H Western blotting analysis of Psat1 expression in KP and KPDeltaNF1 cells infected with sgTom or sgPsat1 following selection. GAPDH was used as a loading control. I Cumulative population doublings of KP and KPDeltaNF1 ce