 Explore
 Validate
 Learn
Learn Western blot
 Other assay
Antibody data
- Antibody Data
- Antigen structure
- References [87]
- Comments [0]
- Validations
- Other assay [66]
Submit
Validation data
Reference
Comment
Report error
- Product number
- 10628D - Provider product page

- Provider
- Invitrogen Antibodies
- Product name
- CD63 Monoclonal Antibody (Ts63)
- Antibody type
- Monoclonal
- Antigen
- Purifed from natural sources
- Description
- Tested in western blotting under non-reducing conditions.
- Reactivity
- Human
- Host
- Mouse
- Isotype
- IgG
- Antibody clone number
- Ts63
- Vial size
- 200 µL
- Concentration
- 0.5 mg/mL
- Storage
- Maintain refrigerated at 2-8°C for up to 1 month. For long term storage store at -20°C
Submitted references Exosome mediated Tom40 delivery protects against hydrogen peroxide-induced oxidative stress by regulating mitochondrial function.
Comparison of serum and plasma as a source of blood extracellular vesicles: Increased levels of platelet-derived particles in serum extracellular vesicle fractions alter content profiles from plasma extracellular vesicle fractions.
Oligodendroglia-derived extracellular vesicles activate autophagy via LC3B/BAG3 to protect against oxidative stress with an enhanced effect for HSPB8 enriched vesicles.
Reovirus infection is regulated by NPC1 and endosomal cholesterol homeostasis.
The Neurotoxicity of Vesicles Secreted by ALS Patient Myotubes Is Specific to Exosome-Like and Not Larger Subtypes.
Functional Characterization of Human Induced Pluripotent Stem Cell-Derived Endothelial Cells.
Extracellular vesicles deliver sodium iodide symporter protein and promote cancer cell radioiodine therapy.
Tracking Radiolabeled Endothelial Microvesicles Predicts Their Therapeutic Efficacy: A Proof-of-Concept Study in Peripheral Ischemia Mouse Model Using SPECT/CT Imaging.
Design and Evaluation of Engineered Extracellular Vesicle (EV)-Based Targeting for EGFR-Overexpressing Tumor Cells Using Monobody Display.
The activity of alkaline phosphatase in breast cancer exosomes simplifies the biosensing design.
Small Extracellular Vesicles from Peripheral Blood of Aged Mice Pass the Blood-Brain Barrier and Induce Glial Cell Activation.
Anti-Human CD9 Fab Fragment Antibody Blocks the Extracellular Vesicle-Mediated Increase in Malignancy of Colon Cancer Cells.
Muscle cells of sporadic amyotrophic lateral sclerosis patients secrete neurotoxic vesicles.
Serum Extracellular Vesicle-Derived miR-124-3p as a Diagnostic and Predictive Marker for Early-Stage Acute Ischemic Stroke.
Engineering Extracellular Vesicles to Target Pancreatic Tissue In Vivo.
Exosomes Recovered From the Plasma of COVID-19 Patients Expose SARS-CoV-2 Spike-Derived Fragments and Contribute to the Adaptive Immune Response.
Serum CD203c+ Extracellular Vesicle Serves as a Novel Diagnostic and Prognostic Biomarker for Succinylated Gelatin Induced Perioperative Hypersensitive Reaction.
Assessment of Placental Extracellular Vesicles-Associated Fas Ligand and TNF-Related Apoptosis-Inducing Ligand in Pregnancies Complicated by Early and Late Onset Preeclampsia.
Endocytic pathway inhibition attenuates extracellular vesicle-induced reduction of chemosensitivity to bortezomib in multiple myeloma cells.
The membrane associated accessory protein is an adeno-associated viral egress factor.
Ferroptosis-dependent extracellular vesicles from macrophage contribute to asbestos-induced mesothelial carcinogenesis through loading ferritin.
Exosomes in serum‑free cultures of THP‑1 macrophages infected with Mycobacterium tuberculosis.
Plasma extracellular vesicles in people living with HIV and type 2 diabetes are related to microbial translocation and cardiovascular risk.
Single Particle Automated Raman Trapping Analysis of Breast Cancer Cell-Derived Extracellular Vesicles as Cancer Biomarkers.
Multiplex protein profiling method for extracellular vesicle protein detection.
Defining candidate mRNA and protein EV biomarkers to discriminate ccRCC and pRCC from non-malignant renal cells in vitro.
Near infrared light fluorescence imaging-guided biomimetic nanoparticles of extracellular vesicles deliver indocyanine green and paclitaxel for hyperthermia combined with chemotherapy against glioma.
A novel approach to correlate the salivary exosomes and their protein cargo in the progression of cognitive impairment into Alzheimer's disease.
Plasma cells shape the mesenchymal identity of ovarian cancers through transfer of exosome-derived microRNAs.
Human keratinocyte-derived extracellular vesicles activate the MAPKinase pathway and promote cell migration and proliferation in vitro.
Manganese systemic distribution is modulated in vivo during tumor progression and affects tumor cell migration and invasion in vitro.
Small Extracellular Vesicles from Head and Neck Squamous Cell Carcinoma Cells Carry a Proteomic Signature for Tumor Hypoxia.
High Therapeutic and Esthetic Properties of Extracellular Vesicles Produced from the Stem Cells and Their Spheroids Cultured from Ocular Surgery-Derived Waste Orbicularis Oculi Muscle Tissues.
RAB5A is associated with genes involved in exosome secretion: Integration of bioinformatics analysis and experimental validation.
Curcumin-primed human BMSC-derived extracellular vesicles reverse IL-1β-induced catabolic responses of OA chondrocytes by upregulating miR-126-3p.
hBMSC-Derived Extracellular Vesicles Attenuate IL-1β-Induced Catabolic Effects on OA-Chondrocytes by Regulating Pro-inflammatory Signaling Pathways.
Altered Insulin Receptor Substrate 1 Phosphorylation in Blood Neuron-Derived Extracellular Vesicles From Patients With Parkinson's Disease.
Characterization and internalization of small extracellular vesicles released by human primary macrophages derived from circulating monocytes.
Human induced pluripotent stem cells ameliorate hyperoxia-induced lung injury in a mouse model.
Plasma Small Extracellular Vesicles Derived miR-21-5p and miR-92a-3p as Potential Biomarkers for Hepatocellular Carcinoma Screening.
The Regulation of Exosome-Derived miRNA on Heterogeneity of Macrophages in Atherosclerotic Plaques.
Breast tumor cells promotes the horizontal propagation of EMT, stemness, and metastasis by transferring the MAP17 protein between subsets of neoplastic cells.
Isolation, characterisation and detection of breath-derived extracellular vesicles.
hnRNPA2B1 inhibits the exosomal export of miR-503 in endothelial cells.
Extracellular Vesicle Delivery of TRAIL Eradicates Resistant Tumor Growth in Combination with CDK Inhibition by Dinaciclib.
Molecular imaging of extracellular vesicles in vitro via Raman metabolic labelling.
The Potential of CD16 on Plasma-Derived Exosomes as a Liquid Biomarker in Head and Neck Cancer.
MiR-519d-3p in Trophoblastic Cells: Effects, Targets and Transfer to Allogeneic Immune Cells via Extracellular Vesicles.
Extracellular vesicle isolation from human renal cancer tissue.
Optimized method for extraction of exosomes from human primary muscle cells.
Circulating Exosomes Inhibit B Cell Proliferation and Activity.
Detection of Viral RNA Fragments in Human iPSC-Cardiomyocytes following Treatment with Extracellular Vesicles from SARS-CoV-2 Coding-Sequence-Overexpressing Lung Epithelial Cells.
Identification of miRNAs Enriched in Extracellular Vesicles Derived from Serum Samples of Breast Cancer Patients.
Extracellular vesicles in follicular fluid of sexually mature gilts' ovarian antral follicles - identification and proteomic analysis.
Oral cancer cell‑derived exosomes modulate natural killer cell activity by regulating the receptors on these cells.
The protective effects of MSC-EXO against pulmonary hypertension through regulating Wnt5a/BMP signalling pathway.
Comprehensive evaluation of methods for small extracellular vesicles separation from human plasma, urine and cell culture medium.
Association of plasma exosomes with severity of organ failure and mortality in patients with sepsis.
Dendritic cell derived exosomes loaded with immunoregulatory cargo reprogram local immune responses and inhibit degenerative bone disease in vivo.
Cancer-derived exosomal TRIM59 regulates macrophage NLRP3 inflammasome activation to promote lung cancer progression.
Experimental artefacts can lead to misattribution of bioactivity from soluble mesenchymal stem cell paracrine factors to extracellular vesicles.
Gold Nanocluster Extracellular Vesicle Supraparticles: Self-Assembled Nanostructures for Three-Dimensional Uptake Visualization.
Murine trophoblast-derived and pregnancy-associated exosome-enriched extracellular vesicle microRNAs: Implications for placenta driven effects on maternal physiology.
Mesenchymal Stem Cells Reduce Corneal Fibrosis and Inflammation via Extracellular Vesicle-Mediated Delivery of miRNA.
Development of a novel cell-based assay to diagnose recurrent focal segmental glomerulosclerosis patients.
Micro-RNAs secreted through astrocyte-derived extracellular vesicles cause neuronal network degeneration in C9orf72 ALS.
Microvesicle-Mediated Delivery of Minicircle DNA Results in Effective Gene-Directed Enzyme Prodrug Cancer Therapy.
Extracellular vesicles from symbiotic vaginal lactobacilli inhibit HIV-1 infection of human tissues.
Proteome Profiling of Exosomes Purified from a Small Amount of Human Serum: The Problem of Co-Purified Serum Components.
Hodgkin Lymphoma-Derived Extracellular Vesicles Change the Secretome of Fibroblasts Toward a CAF Phenotype.
Tumor-Secreted Exosomal miR-222 Promotes Tumor Progression via Regulating P27 Expression and Re-Localization in Pancreatic Cancer.
Non-Proximal Renal Tubule-Derived Urinary Exosomal miR-200b as a Biomarker of Renal Fibrosis.
Harmonization of exosome isolation from culture supernatants for optimized proteomics analysis.
Identification of LEA, a podocalyxin-like glycoprotein, as a predictor for the progression of colorectal cancer.
Bone marrow niche trafficking of miR-126 controls the self-renewal of leukemia stem cells in chronic myelogenous leukemia.
Suppression of tau propagation using an inhibitor that targets the DK-switch of nSMase2.
The sphingosine 1-phosphate receptor 2 is shed in exosomes from breast cancer cells and is N-terminally processed to a short constitutively active form that promotes extracellular signal regulated kinase activation and DNA synthesis in fibroblasts.
Enhanced Production of Exosome-Associated AAV by Overexpression of the Tetraspanin CD9.
Suppressive effect of an analog of the antimicrobial peptide of LL‑37 on colon cancer cells via exosome‑encapsulated miRNAs.
Clinical implications of carcinoembryonic antigen distribution in serum exosomal fraction-Measurement by ELISA.
A genome-wide CRISPR screen reconciles the role of N-linked glycosylation in galectin-3 transport to the cell surface.
Exosomal MicroRNA-15a Transfer from the Pancreas Augments Diabetic Complications by Inducing Oxidative Stress.
Drosophila TG-A transglutaminase is secreted via an unconventional Golgi-independent mechanism involving exosomes and two types of fatty acylations.
Diverse impact of xeno-free conditions on biological and regenerative properties of hUC-MSCs and their extracellular vesicles.
Exosomes confer chemoresistance to pancreatic cancer cells by promoting ROS detoxification and miR-155-mediated suppression of key gemcitabine-metabolising enzyme, DCK.
Microvesicle Cargo and Function Changes upon Induction of Cellular Transformation.
The Enrichment of Survivin in Exosomes from Breast Cancer Cells Treated with Paclitaxel Promotes Cell Survival and Chemoresistance.
Sayeed N, Sugaya K
PloS one 2022;17(8):e0272511
PloS one 2022;17(8):e0272511
Comparison of serum and plasma as a source of blood extracellular vesicles: Increased levels of platelet-derived particles in serum extracellular vesicle fractions alter content profiles from plasma extracellular vesicle fractions.
Zhang X, Takeuchi T, Takeda A, Mochizuki H, Nagai Y
PloS one 2022;17(6):e0270634
PloS one 2022;17(6):e0270634
Oligodendroglia-derived extracellular vesicles activate autophagy via LC3B/BAG3 to protect against oxidative stress with an enhanced effect for HSPB8 enriched vesicles.
Van den Broek B, Wuyts C, Sisto A, Pintelon I, Timmermans JP, Somers V, Timmerman V, Hellings N, Irobi J
Cell communication and signaling : CCS 2022 May 5;20(1):58
Cell communication and signaling : CCS 2022 May 5;20(1):58
Reovirus infection is regulated by NPC1 and endosomal cholesterol homeostasis.
Ortega-Gonzalez P, Taylor G, Jangra RK, Tenorio R, Fernandez de Castro I, Mainou BA, Orchard RC, Wilen CB, Brigleb PH, Sojati J, Chandran K, Sachse M, Risco C, Dermody TS
PLoS pathogens 2022 Mar;18(3):e1010322
PLoS pathogens 2022 Mar;18(3):e1010322
The Neurotoxicity of Vesicles Secreted by ALS Patient Myotubes Is Specific to Exosome-Like and Not Larger Subtypes.
Anakor E, Milla V, Connolly O, Martinat C, Pradat PF, Dumonceaux J, Duddy W, Duguez S
Cells 2022 Mar 1;11(5)
Cells 2022 Mar 1;11(5)
Functional Characterization of Human Induced Pluripotent Stem Cell-Derived Endothelial Cells.
Fan X, Cyganek L, Nitschke K, Uhlig S, Nuhn P, Bieback K, Duerschmied D, El-Battrawy I, Zhou X, Akin I
International journal of molecular sciences 2022 Jul 31;23(15)
International journal of molecular sciences 2022 Jul 31;23(15)
Extracellular vesicles deliver sodium iodide symporter protein and promote cancer cell radioiodine therapy.
Lee JH, Jung KH, Mina K, Lee KH
Scientific reports 2022 Jul 1;12(1):11190
Scientific reports 2022 Jul 1;12(1):11190
Tracking Radiolabeled Endothelial Microvesicles Predicts Their Therapeutic Efficacy: A Proof-of-Concept Study in Peripheral Ischemia Mouse Model Using SPECT/CT Imaging.
Giraud R, Moyon A, Simoncini S, Duchez AC, Nail V, Chareyre C, Bouhlel A, Balasse L, Fernandez S, Vallier L, Hache G, Sabatier F, Dignat-George F, Lacroix R, Guillet B, Garrigue P
Pharmaceutics 2022 Jan 4;14(1)
Pharmaceutics 2022 Jan 4;14(1)
Design and Evaluation of Engineered Extracellular Vesicle (EV)-Based Targeting for EGFR-Overexpressing Tumor Cells Using Monobody Display.
Komuro H, Aminova S, Lauro K, Woldring D, Harada M
Bioengineering (Basel, Switzerland) 2022 Jan 29;9(2)
Bioengineering (Basel, Switzerland) 2022 Jan 29;9(2)
The activity of alkaline phosphatase in breast cancer exosomes simplifies the biosensing design.
Moura SL, Pallarès-Rusiñol A, Sappia L, Martí M, Pividori MI
Biosensors & bioelectronics 2022 Feb 15;198:113826
Biosensors & bioelectronics 2022 Feb 15;198:113826
Small Extracellular Vesicles from Peripheral Blood of Aged Mice Pass the Blood-Brain Barrier and Induce Glial Cell Activation.
Morales-Prieto DM, Murrieta-Coxca JM, Stojiljkovic M, Diezel C, Streicher PE, Henao-Restrepo JA, Röstel F, Lindner J, Witte OW, Weis S, Schmeer C, Marz M
Cells 2022 Feb 11;11(4)
Cells 2022 Feb 11;11(4)
Anti-Human CD9 Fab Fragment Antibody Blocks the Extracellular Vesicle-Mediated Increase in Malignancy of Colon Cancer Cells.
Santos MF, Rappa G, Fontana S, Karbanová J, Aalam F, Tai D, Li Z, Pucci M, Alessandro R, Morimoto C, Corbeil D, Lorico A
Cells 2022 Aug 10;11(16)
Cells 2022 Aug 10;11(16)
Muscle cells of sporadic amyotrophic lateral sclerosis patients secrete neurotoxic vesicles.
Le Gall L, Duddy WJ, Martinat C, Mariot V, Connolly O, Milla V, Anakor E, Ouandaogo ZG, Millecamps S, Lainé J, Vijayakumar UG, Knoblach S, Raoul C, Lucas O, Loeffler JP, Bede P, Behin A, Blasco H, Bruneteau G, Del Mar Amador M, Devos D, Henriques A, Hesters A, Lacomblez L, Laforet P, Langlet T, Leblanc P, Le Forestier N, Maisonobe T, Meininger V, Robelin L, Salachas F, Stojkovic T, Querin G, Dumonceaux J, Butler Browne G, González De Aguilar JL, Duguez S, Pradat PF
Journal of cachexia, sarcopenia and muscle 2022 Apr;13(2):1385-1402
Journal of cachexia, sarcopenia and muscle 2022 Apr;13(2):1385-1402
Serum Extracellular Vesicle-Derived miR-124-3p as a Diagnostic and Predictive Marker for Early-Stage Acute Ischemic Stroke.
Qi Z, Zhao Y, Su Y, Cao B, Yang JJ, Xing Q
Frontiers in molecular biosciences 2021;8:685088
Frontiers in molecular biosciences 2021;8:685088
Engineering Extracellular Vesicles to Target Pancreatic Tissue In Vivo.
Komuro H, Kawai-Harada Y, Aminova S, Pascual N, Malik A, Contag CH, Harada M
Nanotheranostics 2021;5(4):378-390
Nanotheranostics 2021;5(4):378-390
Exosomes Recovered From the Plasma of COVID-19 Patients Expose SARS-CoV-2 Spike-Derived Fragments and Contribute to the Adaptive Immune Response.
Pesce E, Manfrini N, Cordiglieri C, Santi S, Bandera A, Gobbini A, Gruarin P, Favalli A, Bombaci M, Cuomo A, Collino F, Cricrì G, Ungaro R, Lombardi A, Mangioni D, Muscatello A, Aliberti S, Blasi F, Gori A, Abrignani S, De Francesco R, Biffo S, Grifantini R
Frontiers in immunology 2021;12:785941
Frontiers in immunology 2021;12:785941
Serum CD203c+ Extracellular Vesicle Serves as a Novel Diagnostic and Prognostic Biomarker for Succinylated Gelatin Induced Perioperative Hypersensitive Reaction.
Qi Z, Xue Q, Wang H, Cao B, Su Y, Xing Q, Yang JJ
Frontiers in immunology 2021;12:732209
Frontiers in immunology 2021;12:732209
Assessment of Placental Extracellular Vesicles-Associated Fas Ligand and TNF-Related Apoptosis-Inducing Ligand in Pregnancies Complicated by Early and Late Onset Preeclampsia.
Ayala-Ramírez P, Machuca-Acevedo C, Gámez T, Quijano S, Barreto A, Silva JL, Olaya-C M, García-Robles R
Frontiers in physiology 2021;12:708824
Frontiers in physiology 2021;12:708824
Endocytic pathway inhibition attenuates extracellular vesicle-induced reduction of chemosensitivity to bortezomib in multiple myeloma cells.
Tu C, Du Z, Zhang H, Feng Y, Qi Y, Zheng Y, Liu J, Wang J
Theranostics 2021;11(5):2364-2380
Theranostics 2021;11(5):2364-2380
The membrane associated accessory protein is an adeno-associated viral egress factor.
Elmore ZC, Patrick Havlik L, Oh DK, Anderson L, Daaboul G, Devlin GW, Vincent HA, Asokan A
Nature communications 2021 Oct 29;12(1):6239
Nature communications 2021 Oct 29;12(1):6239
Ferroptosis-dependent extracellular vesicles from macrophage contribute to asbestos-induced mesothelial carcinogenesis through loading ferritin.
Ito F, Kato K, Yanatori I, Murohara T, Toyokuni S
Redox biology 2021 Nov;47:102174
Redox biology 2021 Nov;47:102174
Exosomes in serum‑free cultures of THP‑1 macrophages infected with Mycobacterium tuberculosis.
Biadglegne F, Rademacher P, De Sulbaran YGJ, König B, Rodloff AC, Zedler U, Dorhoi A, Sack U
Molecular medicine reports 2021 Nov;24(5)
Molecular medicine reports 2021 Nov;24(5)
Plasma extracellular vesicles in people living with HIV and type 2 diabetes are related to microbial translocation and cardiovascular risk.
Vestad B, Nyman TA, Hove-Skovsgaard M, Stensland M, Hoel H, Trøseid AS, Aspelin T, Aass HCD, Puhka M, Hov JR, Nielsen SD, Øvstebø R, Trøseid M
Scientific reports 2021 Nov 9;11(1):21936
Scientific reports 2021 Nov 9;11(1):21936
Single Particle Automated Raman Trapping Analysis of Breast Cancer Cell-Derived Extracellular Vesicles as Cancer Biomarkers.
Penders J, Nagelkerke A, Cunnane EM, Pedersen SV, Pence IJ, Coombes RC, Stevens MM
ACS nano 2021 Nov 23;15(11):18192-18205
ACS nano 2021 Nov 23;15(11):18192-18205
Multiplex protein profiling method for extracellular vesicle protein detection.
Sun L, Meckes DG Jr
Scientific reports 2021 Jun 14;11(1):12477
Scientific reports 2021 Jun 14;11(1):12477
Defining candidate mRNA and protein EV biomarkers to discriminate ccRCC and pRCC from non-malignant renal cells in vitro.
Zieren RC, Dong L, Clark DJ, Kuczler MD, Horie K, Moreno LF, Lih TM, Schnaubelt M, Vermeulen L, Zhang H, de Reijke TM, Pienta KJ, Amend SR
Medical oncology (Northwood, London, England) 2021 Jul 31;38(9):105
Medical oncology (Northwood, London, England) 2021 Jul 31;38(9):105
Near infrared light fluorescence imaging-guided biomimetic nanoparticles of extracellular vesicles deliver indocyanine green and paclitaxel for hyperthermia combined with chemotherapy against glioma.
Wang M, Lv CY, Li SA, Wang JK, Luo WZ, Zhao PC, Liu XY, Wang ZM, Jiao Y, Sun HW, Zhao Y, Zhang P
Journal of nanobiotechnology 2021 Jul 14;19(1):210
Journal of nanobiotechnology 2021 Jul 14;19(1):210
A novel approach to correlate the salivary exosomes and their protein cargo in the progression of cognitive impairment into Alzheimer's disease.
Rani K, Rastogi S, Vishwakarma P, Bharti PS, Sharma V, Renu K, Modi GP, Vishnu VY, Chatterjee P, Dey AB, Nikolajeff F, Kumar S
Journal of neuroscience methods 2021 Jan 1;347:108980
Journal of neuroscience methods 2021 Jan 1;347:108980
Plasma cells shape the mesenchymal identity of ovarian cancers through transfer of exosome-derived microRNAs.
Yang Z, Wang W, Zhao L, Wang X, Gimple RC, Xu L, Wang Y, Rich JN, Zhou S
Science advances 2021 Feb;7(9)
Science advances 2021 Feb;7(9)
Human keratinocyte-derived extracellular vesicles activate the MAPKinase pathway and promote cell migration and proliferation in vitro.
Glady A, Vandebroek A, Yasui M
Inflammation and regeneration 2021 Feb 2;41(1):4
Inflammation and regeneration 2021 Feb 2;41(1):4
Manganese systemic distribution is modulated in vivo during tumor progression and affects tumor cell migration and invasion in vitro.
Stelling MP, Soares MA, Cardoso SC, Motta JM, de Abreu JC, Antunes MJM, de Freitas VG, Moraes JA, Castelo-Branco MTL, Pérez CA, Pavão MSG
Scientific reports 2021 Aug 4;11(1):15833
Scientific reports 2021 Aug 4;11(1):15833
Small Extracellular Vesicles from Head and Neck Squamous Cell Carcinoma Cells Carry a Proteomic Signature for Tumor Hypoxia.
Głuszko A, Szczepański MJ, Whiteside TL, Reichert TE, Siewiera J, Ludwig N
Cancers 2021 Aug 19;13(16)
Cancers 2021 Aug 19;13(16)
High Therapeutic and Esthetic Properties of Extracellular Vesicles Produced from the Stem Cells and Their Spheroids Cultured from Ocular Surgery-Derived Waste Orbicularis Oculi Muscle Tissues.
Lim KM, Dayem AA, Choi Y, Lee Y, An J, Gil M, Lee S, Kwak HJ, Vellingirl B, Shin HJ, Cho SG
Antioxidants (Basel, Switzerland) 2021 Aug 16;10(8)
Antioxidants (Basel, Switzerland) 2021 Aug 16;10(8)
RAB5A is associated with genes involved in exosome secretion: Integration of bioinformatics analysis and experimental validation.
Gorji-Bahri G, Moghimi HR, Hashemi A
Journal of cellular biochemistry 2021 Apr;122(3-4):425-441
Journal of cellular biochemistry 2021 Apr;122(3-4):425-441
Curcumin-primed human BMSC-derived extracellular vesicles reverse IL-1β-induced catabolic responses of OA chondrocytes by upregulating miR-126-3p.
Li S, Stöckl S, Lukas C, Herrmann M, Brochhausen C, König MA, Johnstone B, Grässel S
Stem cell research & therapy 2021 Apr 29;12(1):252
Stem cell research & therapy 2021 Apr 29;12(1):252
hBMSC-Derived Extracellular Vesicles Attenuate IL-1β-Induced Catabolic Effects on OA-Chondrocytes by Regulating Pro-inflammatory Signaling Pathways.
Li S, Stöckl S, Lukas C, Götz J, Herrmann M, Federlin M, Grässel S
Frontiers in bioengineering and biotechnology 2020;8:603598
Frontiers in bioengineering and biotechnology 2020;8:603598
Altered Insulin Receptor Substrate 1 Phosphorylation in Blood Neuron-Derived Extracellular Vesicles From Patients With Parkinson's Disease.
Chou SY, Chan L, Chung CC, Chiu JY, Hsieh YC, Hong CT
Frontiers in cell and developmental biology 2020;8:564641
Frontiers in cell and developmental biology 2020;8:564641
Characterization and internalization of small extracellular vesicles released by human primary macrophages derived from circulating monocytes.
Arteaga-Blanco LA, Mojoli A, Monteiro RQ, Sandim V, Menna-Barreto RFS, Pereira-Dutra FS, Bozza PT, Resende RO, Bou-Habib DC
PloS one 2020;15(8):e0237795
PloS one 2020;15(8):e0237795
Human induced pluripotent stem cells ameliorate hyperoxia-induced lung injury in a mouse model.
Mitchell A, Wanczyk H, Jensen T, Finck C
American journal of translational research 2020;12(1):292-307
American journal of translational research 2020;12(1):292-307
Plasma Small Extracellular Vesicles Derived miR-21-5p and miR-92a-3p as Potential Biomarkers for Hepatocellular Carcinoma Screening.
Sorop A, Iacob R, Iacob S, Constantinescu D, Chitoiu L, Fertig TE, Dinischiotu A, Chivu-Economescu M, Bacalbasa N, Savu L, Gheorghe L, Dima S, Popescu I
Frontiers in genetics 2020;11:712
Frontiers in genetics 2020;11:712
The Regulation of Exosome-Derived miRNA on Heterogeneity of Macrophages in Atherosclerotic Plaques.
Li X, He X, Wang J, Wang D, Cong P, Zhu A, Chen W
Frontiers in immunology 2020;11:2175
Frontiers in immunology 2020;11:2175
Breast tumor cells promotes the horizontal propagation of EMT, stemness, and metastasis by transferring the MAP17 protein between subsets of neoplastic cells.
García-Heredia JM, Otero-Albiol D, Pérez M, Pérez-Castejón E, Muñoz-Galván S, Carnero A
Oncogenesis 2020 Oct 26;9(10):96
Oncogenesis 2020 Oct 26;9(10):96
Isolation, characterisation and detection of breath-derived extracellular vesicles.
Dobhal G, Datta A, Ayupova D, Teesdale-Spittle P, Goreham RV
Scientific reports 2020 Oct 15;10(1):17381
Scientific reports 2020 Oct 15;10(1):17381
hnRNPA2B1 inhibits the exosomal export of miR-503 in endothelial cells.
Pérez-Boza J, Boeckx A, Lion M, Dequiedt F, Struman I
Cellular and molecular life sciences : CMLS 2020 Nov;77(21):4413-4428
Cellular and molecular life sciences : CMLS 2020 Nov;77(21):4413-4428
Extracellular Vesicle Delivery of TRAIL Eradicates Resistant Tumor Growth in Combination with CDK Inhibition by Dinaciclib.
Ke C, Hou H, Li J, Su K, Huang C, Lin Y, Lu Z, Du Z, Tan W, Yuan Z
Cancers 2020 May 4;12(5)
Cancers 2020 May 4;12(5)
Molecular imaging of extracellular vesicles in vitro via Raman metabolic labelling.
Horgan CC, Nagelkerke A, Whittaker TE, Nele V, Massi L, Kauscher U, Penders J, Bergholt MS, Hood SR, Stevens MM
Journal of materials chemistry. B 2020 May 27;8(20):4447-4459
Journal of materials chemistry. B 2020 May 27;8(20):4447-4459
The Potential of CD16 on Plasma-Derived Exosomes as a Liquid Biomarker in Head and Neck Cancer.
Hofmann L, Ludwig S, Schuler PJ, Hoffmann TK, Brunner C, Theodoraki MN
International journal of molecular sciences 2020 May 26;21(11)
International journal of molecular sciences 2020 May 26;21(11)
MiR-519d-3p in Trophoblastic Cells: Effects, Targets and Transfer to Allogeneic Immune Cells via Extracellular Vesicles.
Chaiwangyen W, Murrieta-Coxca JM, Favaro RR, Photini SM, Gutiérrez-Samudio RN, Schleussner E, Markert UR, Morales-Prieto DM
International journal of molecular sciences 2020 May 14;21(10)
International journal of molecular sciences 2020 May 14;21(10)
Extracellular vesicle isolation from human renal cancer tissue.
Zieren RC, Dong L, Pierorazio PM, Pienta KJ, de Reijke TM, Amend SR
Medical oncology (Northwood, London, England) 2020 Mar 14;37(4):28
Medical oncology (Northwood, London, England) 2020 Mar 14;37(4):28
Optimized method for extraction of exosomes from human primary muscle cells.
Le Gall L, Ouandaogo ZG, Anakor E, Connolly O, Butler Browne G, Laine J, Duddy W, Duguez S
Skeletal muscle 2020 Jul 8;10(1):20
Skeletal muscle 2020 Jul 8;10(1):20
Circulating Exosomes Inhibit B Cell Proliferation and Activity.
Schroeder JC, Puntigam L, Hofmann L, Jeske SS, Beccard IJ, Doescher J, Laban S, Hoffmann TK, Brunner C, Theodoraki MN, Schuler PJ
Cancers 2020 Jul 29;12(8)
Cancers 2020 Jul 29;12(8)
Detection of Viral RNA Fragments in Human iPSC-Cardiomyocytes following Treatment with Extracellular Vesicles from SARS-CoV-2 Coding-Sequence-Overexpressing Lung Epithelial Cells.
Kwon Y, Nukala SB, Srivastava S, Miyamoto H, Ismail NI, Rehman J, Ong SB, Lee WH, Ong SG
bioRxiv : the preprint server for biology 2020 Jul 1;
bioRxiv : the preprint server for biology 2020 Jul 1;
Identification of miRNAs Enriched in Extracellular Vesicles Derived from Serum Samples of Breast Cancer Patients.
Ozawa PMM, Vieira E, Lemos DS, Souza ILM, Zanata SM, Pankievicz VC, Tuleski TR, Souza EM, Wowk PF, Urban CA, Kuroda F, Lima RS, Almeida RC, Gradia DF, Cavalli IJ, Cavalli LR, Malheiros D, Ribeiro EMSF
Biomolecules 2020 Jan 16;10(1)
Biomolecules 2020 Jan 16;10(1)
Extracellular vesicles in follicular fluid of sexually mature gilts' ovarian antral follicles - identification and proteomic analysis.
Grzesiak M, Popiolek K, Knapczyk-Stwora K
Journal of physiology and pharmacology : an official journal of the Polish Physiological Society 2020 Feb;71(1)
Journal of physiology and pharmacology : an official journal of the Polish Physiological Society 2020 Feb;71(1)
Oral cancer cell‑derived exosomes modulate natural killer cell activity by regulating the receptors on these cells.
Zhu X, Qin X, Wang X, Wang Y, Cao W, Zhang J, Chen W
International journal of molecular medicine 2020 Dec;46(6):2115-2125
International journal of molecular medicine 2020 Dec;46(6):2115-2125
The protective effects of MSC-EXO against pulmonary hypertension through regulating Wnt5a/BMP signalling pathway.
Zhang Z, Ge L, Zhang S, Wang J, Jiang W, Xin Q, Luan Y
Journal of cellular and molecular medicine 2020 Dec;24(23):13938-13948
Journal of cellular and molecular medicine 2020 Dec;24(23):13938-13948
Comprehensive evaluation of methods for small extracellular vesicles separation from human plasma, urine and cell culture medium.
Dong L, Zieren RC, Horie K, Kim CJ, Mallick E, Jing Y, Feng M, Kuczler MD, Green J, Amend SR, Witwer KW, de Reijke TM, Cho YK, Pienta KJ, Xue W
Journal of extracellular vesicles 2020 Dec;10(2):e12044
Journal of extracellular vesicles 2020 Dec;10(2):e12044
Association of plasma exosomes with severity of organ failure and mortality in patients with sepsis.
Im Y, Yoo H, Lee JY, Park J, Suh GY, Jeon K
Journal of cellular and molecular medicine 2020 Aug;24(16):9439-9445
Journal of cellular and molecular medicine 2020 Aug;24(16):9439-9445
Dendritic cell derived exosomes loaded with immunoregulatory cargo reprogram local immune responses and inhibit degenerative bone disease in vivo.
Elashiry M, Elashiry MM, Elsayed R, Rajendran M, Auersvald C, Zeitoun R, Rashid MH, Ara R, Meghil MM, Liu Y, Arbab AS, Arce RM, Hamrick M, Elsalanty M, Brendan M, Pacholczyk R, Cutler CW
Journal of extracellular vesicles 2020 Aug 7;9(1):1795362
Journal of extracellular vesicles 2020 Aug 7;9(1):1795362
Cancer-derived exosomal TRIM59 regulates macrophage NLRP3 inflammasome activation to promote lung cancer progression.
Liang M, Chen X, Wang L, Qin L, Wang H, Sun Z, Zhao W, Geng B
Journal of experimental & clinical cancer research : CR 2020 Aug 31;39(1):176
Journal of experimental & clinical cancer research : CR 2020 Aug 31;39(1):176
Experimental artefacts can lead to misattribution of bioactivity from soluble mesenchymal stem cell paracrine factors to extracellular vesicles.
Whittaker TE, Nagelkerke A, Nele V, Kauscher U, Stevens MM
Journal of extracellular vesicles 2020 Aug 26;9(1):1807674
Journal of extracellular vesicles 2020 Aug 26;9(1):1807674
Gold Nanocluster Extracellular Vesicle Supraparticles: Self-Assembled Nanostructures for Three-Dimensional Uptake Visualization.
Kauscher U, Penders J, Nagelkerke A, Holme MN, Nele V, Massi L, Gopal S, Whittaker TE, Stevens MM
Langmuir : the ACS journal of surfaces and colloids 2020 Apr 14;36(14):3912-3923
Langmuir : the ACS journal of surfaces and colloids 2020 Apr 14;36(14):3912-3923
Murine trophoblast-derived and pregnancy-associated exosome-enriched extracellular vesicle microRNAs: Implications for placenta driven effects on maternal physiology.
Stefanski AL, Martinez N, Peterson LK, Callahan TJ, Treacy E, Luck M, Friend SF, Hermesch A, Maltepe E, Phang T, Dragone LL, Winn VD
PloS one 2019;14(2):e0210675
PloS one 2019;14(2):e0210675
Mesenchymal Stem Cells Reduce Corneal Fibrosis and Inflammation via Extracellular Vesicle-Mediated Delivery of miRNA.
Shojaati G, Khandaker I, Funderburgh ML, Mann MM, Basu R, Stolz DB, Geary ML, Dos Santos A, Deng SX, Funderburgh JL
Stem cells translational medicine 2019 Nov;8(11):1192-1201
Stem cells translational medicine 2019 Nov;8(11):1192-1201
Development of a novel cell-based assay to diagnose recurrent focal segmental glomerulosclerosis patients.
Srivastava P, Solanki AK, Arif E, Wolf BJ, Janech MG, Budisavljevic MN, Kwon SH, Nihalani D
Kidney international 2019 Mar;95(3):708-716
Kidney international 2019 Mar;95(3):708-716
Micro-RNAs secreted through astrocyte-derived extracellular vesicles cause neuronal network degeneration in C9orf72 ALS.
Varcianna A, Myszczynska MA, Castelli LM, O'Neill B, Kim Y, Talbot J, Nyberg S, Nyamali I, Heath PR, Stopford MJ, Hautbergue GM, Ferraiuolo L
EBioMedicine 2019 Feb;40:626-635
EBioMedicine 2019 Feb;40:626-635
Microvesicle-Mediated Delivery of Minicircle DNA Results in Effective Gene-Directed Enzyme Prodrug Cancer Therapy.
Kanada M, Kim BD, Hardy JW, Ronald JA, Bachmann MH, Bernard MP, Perez GI, Zarea AA, Ge TJ, Withrow A, Ibrahim SA, Toomajian V, Gambhir SS, Paulmurugan R, Contag CH
Molecular cancer therapeutics 2019 Dec;18(12):2331-2342
Molecular cancer therapeutics 2019 Dec;18(12):2331-2342
Extracellular vesicles from symbiotic vaginal lactobacilli inhibit HIV-1 infection of human tissues.
Ñahui Palomino RA, Vanpouille C, Laghi L, Parolin C, Melikov K, Backlund P, Vitali B, Margolis L
Nature communications 2019 Dec 11;10(1):5656
Nature communications 2019 Dec 11;10(1):5656
Proteome Profiling of Exosomes Purified from a Small Amount of Human Serum: The Problem of Co-Purified Serum Components.
Smolarz M, Pietrowska M, Matysiak N, Mielańczyk Ł, Widłak P
Proteomes 2019 Apr 28;7(2)
Proteomes 2019 Apr 28;7(2)
Hodgkin Lymphoma-Derived Extracellular Vesicles Change the Secretome of Fibroblasts Toward a CAF Phenotype.
Dörsam B, Bösl T, Reiners KS, Barnert S, Schubert R, Shatnyeva O, Zigrino P, Engert A, Hansen HP, von Strandmann EP
Frontiers in immunology 2018;9:1358
Frontiers in immunology 2018;9:1358
Tumor-Secreted Exosomal miR-222 Promotes Tumor Progression via Regulating P27 Expression and Re-Localization in Pancreatic Cancer.
Li Z, Tao Y, Wang X, Jiang P, Li J, Peng M, Zhang X, Chen K, Liu H, Zhen P, Zhu J, Liu X, Liu X
Cellular physiology and biochemistry : international journal of experimental cellular physiology, biochemistry, and pharmacology 2018;51(2):610-629
Cellular physiology and biochemistry : international journal of experimental cellular physiology, biochemistry, and pharmacology 2018;51(2):610-629
Non-Proximal Renal Tubule-Derived Urinary Exosomal miR-200b as a Biomarker of Renal Fibrosis.
Yu Y, Bai F, Qin N, Liu W, Sun Q, Zhou Y, Yang J
Nephron 2018;139(3):269-282
Nephron 2018;139(3):269-282
Harmonization of exosome isolation from culture supernatants for optimized proteomics analysis.
Abramowicz A, Marczak L, Wojakowska A, Zapotoczny S, Whiteside TL, Widlak P, Pietrowska M
PloS one 2018;13(10):e0205496
PloS one 2018;13(10):e0205496
Identification of LEA, a podocalyxin-like glycoprotein, as a predictor for the progression of colorectal cancer.
Yuan D, Chen H, Wang S, Liu F, Cheng Y, Fang J
Cancer medicine 2018 Oct;7(10):5155-5166
Cancer medicine 2018 Oct;7(10):5155-5166
Bone marrow niche trafficking of miR-126 controls the self-renewal of leukemia stem cells in chronic myelogenous leukemia.
Zhang B, Nguyen LXT, Li L, Zhao D, Kumar B, Wu H, Lin A, Pellicano F, Hopcroft L, Su YL, Copland M, Holyoake TL, Kuo CJ, Bhatia R, Snyder DS, Ali H, Stein AS, Brewer C, Wang H, McDonald T, Swiderski P, Troadec E, Chen CC, Dorrance A, Pullarkat V, Yuan YC, Perrotti D, Carlesso N, Forman SJ, Kortylewski M, Kuo YH, Marcucci G
Nature medicine 2018 May;24(4):450-462
Nature medicine 2018 May;24(4):450-462
Suppression of tau propagation using an inhibitor that targets the DK-switch of nSMase2.
Bilousova T, Elias C, Miyoshi E, Alam MP, Zhu C, Campagna J, Vadivel K, Jagodzinska B, Gylys KH, John V
Biochemical and biophysical research communications 2018 May 23;499(4):751-757
Biochemical and biophysical research communications 2018 May 23;499(4):751-757
The sphingosine 1-phosphate receptor 2 is shed in exosomes from breast cancer cells and is N-terminally processed to a short constitutively active form that promotes extracellular signal regulated kinase activation and DNA synthesis in fibroblasts.
El Buri A, Adams DR, Smith D, Tate RJ, Mullin M, Pyne S, Pyne NJ
Oncotarget 2018 Jun 29;9(50):29453-29467
Oncotarget 2018 Jun 29;9(50):29453-29467
Enhanced Production of Exosome-Associated AAV by Overexpression of the Tetraspanin CD9.
Schiller LT, Lemus-Diaz N, Rinaldi Ferreira R, Böker KO, Gruber J
Molecular therapy. Methods & clinical development 2018 Jun 15;9:278-287
Molecular therapy. Methods & clinical development 2018 Jun 15;9:278-287
Suppressive effect of an analog of the antimicrobial peptide of LL‑37 on colon cancer cells via exosome‑encapsulated miRNAs.
Hayashi M, Kuroda K, Ihara K, Iwaya T, Isogai E
International journal of molecular medicine 2018 Dec;42(6):3009-3016
International journal of molecular medicine 2018 Dec;42(6):3009-3016
Clinical implications of carcinoembryonic antigen distribution in serum exosomal fraction-Measurement by ELISA.
Yokoyama S, Takeuchi A, Yamaguchi S, Mitani Y, Watanabe T, Matsuda K, Hotta T, Shively JE, Yamaue H
PloS one 2017;12(8):e0183337
PloS one 2017;12(8):e0183337
A genome-wide CRISPR screen reconciles the role of N-linked glycosylation in galectin-3 transport to the cell surface.
Stewart SE, Menzies SA, Popa SJ, Savinykh N, Petrunkina Harrison A, Lehner PJ, Moreau K
Journal of cell science 2017 Oct 1;130(19):3234-3247
Journal of cell science 2017 Oct 1;130(19):3234-3247
Exosomal MicroRNA-15a Transfer from the Pancreas Augments Diabetic Complications by Inducing Oxidative Stress.
Kamalden TA, Macgregor-Das AM, Kannan SM, Dunkerly-Eyring B, Khaliddin N, Xu Z, Fusco AP, Yazib SA, Chow RC, Duh EJ, Halushka MK, Steenbergen C, Das S
Antioxidants & redox signaling 2017 Nov 1;27(13):913-930
Antioxidants & redox signaling 2017 Nov 1;27(13):913-930
Drosophila TG-A transglutaminase is secreted via an unconventional Golgi-independent mechanism involving exosomes and two types of fatty acylations.
Shibata T, Hadano J, Kawasaki D, Dong X, Kawabata SI
The Journal of biological chemistry 2017 Jun 23;292(25):10723-10734
The Journal of biological chemistry 2017 Jun 23;292(25):10723-10734
Diverse impact of xeno-free conditions on biological and regenerative properties of hUC-MSCs and their extracellular vesicles.
Bobis-Wozowicz S, Kmiotek K, Kania K, Karnas E, Labedz-Maslowska A, Sekula M, Kedracka-Krok S, Kolcz J, Boruczkowski D, Madeja Z, Zuba-Surma EK
Journal of molecular medicine (Berlin, Germany) 2017 Feb;95(2):205-220
Journal of molecular medicine (Berlin, Germany) 2017 Feb;95(2):205-220
Exosomes confer chemoresistance to pancreatic cancer cells by promoting ROS detoxification and miR-155-mediated suppression of key gemcitabine-metabolising enzyme, DCK.
Patel GK, Khan MA, Bhardwaj A, Srivastava SK, Zubair H, Patton MC, Singh S, Khushman M, Singh AP
British journal of cancer 2017 Feb 28;116(5):609-619
British journal of cancer 2017 Feb 28;116(5):609-619
Microvesicle Cargo and Function Changes upon Induction of Cellular Transformation.
Kreger BT, Dougherty AL, Greene KS, Cerione RA, Antonyak MA
The Journal of biological chemistry 2016 Sep 16;291(38):19774-85
The Journal of biological chemistry 2016 Sep 16;291(38):19774-85
The Enrichment of Survivin in Exosomes from Breast Cancer Cells Treated with Paclitaxel Promotes Cell Survival and Chemoresistance.
Kreger BT, Johansen ER, Cerione RA, Antonyak MA
Cancers 2016 Dec 9;8(12)
Cancers 2016 Dec 9;8(12)
No comments: Submit comment
Supportive validation
- Submitted by
- Invitrogen Antibodies (provider)
- Main image

- Experimental details
- NULL

- Submitted by
- Invitrogen Antibodies (provider)
- Main image

- Experimental details
- NULL

- Submitted by
- Invitrogen Antibodies (provider)
- Main image

- Experimental details
- NULL

- Submitted by
- Invitrogen Antibodies (provider)
- Main image

- Experimental details
- NULL

- Submitted by
- Invitrogen Antibodies (provider)
- Main image

- Experimental details
- NULL

- Submitted by
- Invitrogen Antibodies (provider)
- Main image

- Experimental details
- NULL
- Submitted by
- Invitrogen Antibodies (provider)
- Main image

- Experimental details
- NULL

- Submitted by
- Invitrogen Antibodies (provider)
- Main image
- Experimental details
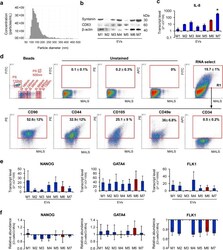
- Fig. 4 Characteristic of EVs derived from UC-MSCs cultured in xeno-free media (UC-MSC-EVs). a Size analysis of EVs using qNano system (Izon Science Ltd). Representative image is shown. b Western blot analysis of selected proteins in UC-MSC-EVs. Three hundred micrograms of protein extracts was used to detect expression of transmembrane (CD63) and cytosolic (syntenin) proteins. Expression of beta-actin was used as control. c Transcript level for extracellular protein (IL-8) measured by RT-qPCR in UC-MSC-EVs. d Surface antigen profile of UC-MSC-EVs by high-sensitivity flow cytometry. The EV samples were stained with the SYTO(r) RNASelect(tm) Green Fluorescent Cell Stain (Molecular Probes) and selected antibodies labeled with a fluorochrome and further analyzed on an A50-Micro Flow Cytometer (Apogee Flow Systems). The percentage of particles positive for indicated surface marker was analyzed from SYTO(r) RNASelect(tm)-positive objects (in gate R1). Representative dot plots for M1-EVs are shown. e Analysis of transcript levels for genes involved in the maintenance of pluripotency ( NANOG ) or differentiation toward cardiac ( GATA4 ) and endothelial lineage ( FLK1 ) performed with the real time PCR method in UC-MSC-EVs. f Relative transcript levels in EVs compared to parental UC-MSCs. Results are shown as mean +- SD. Results were compared with one-way ANOVA and Dunnet's post hoc test, relative to control conditions ( M6 ). * p < 0.05. UC-MSC umbilical cord-derived mesenchymal

- Submitted by
- Invitrogen Antibodies (provider)
- Main image

- Experimental details
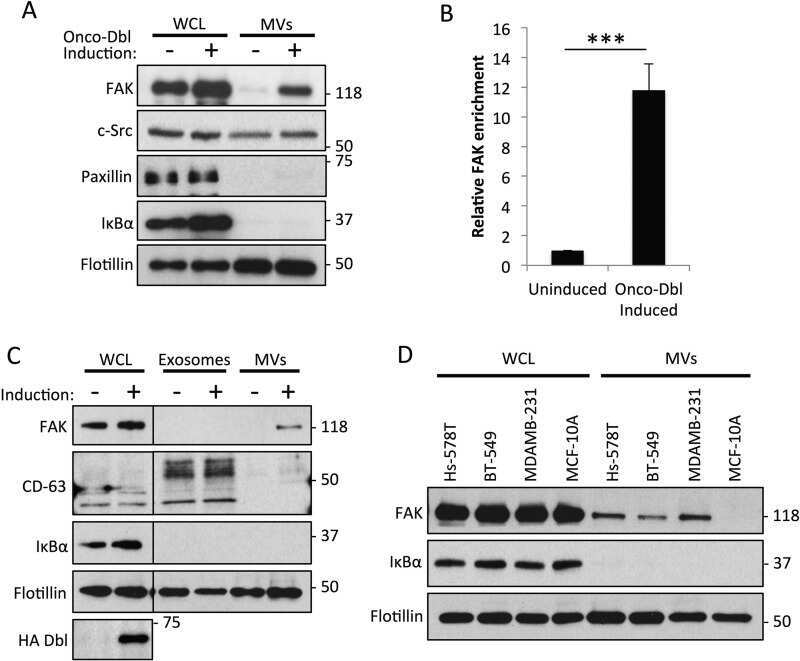
- Figure 1 MDAMB231 breast cancer cells shed exosomes and exosomes and microvesicles (MVs). ( A ) Outline of procedure used to isolate exosomes and MVs from conditioned medium. ( B ) Western blot analysis using CD-63, IkappaBalpha, and flotillin antibodies was performed on lysates of MDAMB231 cells (lane labeled WCL), and the exosomes (lane labeled Exos), and MVs (lane labeled MVs) that these cells generated. A sample containing all extracellular vesicles (EVs) (including both MVs and exosomes) generated by the cells (lane labeled EVs) was also included on the blot. ( C ) Transmission electron microscopy (TEM) image of exosomes isolated from MDAMB231 cells. Scale bar = 50 nm. ( D ) Histogram showing the sizes of exosomes detected in C. ( E , F ) NIH-3T3 fibroblasts were cultured in serum-free media supplemented without (images and bars labeled Serum Starved) or with either 2% serum (images and bars labeled 2% Serum), or 0.5 x 10 6 exosomes/mL collected from MDAMB231 cells (images and bars labeled Exos) for two days, at which point the cells were stained with DAPI to label nuclei. ( E ) Representative fluorescent images of the nuclei from cells cultured under each of the indicated conditions. Asterisks indicate condensed/blebbed nuclei, a hallmark of apoptosis. Scale bar = 10 mum. The boxed portion of the fibroblasts treated with exosomes (Exos) represents an enlarged image and was placed below the other images to further highlight the differences between a normal (non-apoptotic

- Submitted by
- Invitrogen Antibodies (provider)
- Main image

- Experimental details
- Figure 3 Survivin is highly enriched in exosomes from PTX-treated cancer cells. ( A ) Western blot analysis using Survivin, flotillin, IkappaBalpha, and CD-63 antibodies was performed on lysates of MDAMB231 cells treated with either DMSO or PTX (lanes labeled WCL), as well as the exosomes (lanes labeled Exos) and MVs (lanes labeled MVs) generated by the cells. ( B ) The relative amounts of Survivin detected in exosomes generated by DMSO- and PTX-treated MDAMB231 cells. ( C ) Western blot analysis using Survivin and actin antibodies was performed on lysates of MDAMB231 cells treated with PTX for increasing lengths of time. ( D ) Immunofluorescence using a Survivin antibody was performed on MDAMB231 cells treated with either DMSO or PTX (top images). The cells were also stained with DAPI to label nuclei (bottom images). Arrows indicate areas where Survivin is detected as puncta in the cytosol of cells treated with PTX. Scale bar = 5 um. ( E ) Western blot analysis was performed using a Survivin antibody on lysates of MDAMB231 cells, U87 glioblastoma cells, and SKBR3 cells that had been treated with DMSO or PTX (lanes labeled WCL), and on the exosomes these cells generated (lanes labeled Exos). ( F ) Western blot analysis was performed on lysates of exosomes from MDAMB231 cells that had been treated with the indicated chemotherapeutic agents and inhibitors. The experiments in B were performed a minimum of three separate times, with each experiment yielding similar results. Stude

- Submitted by
- Invitrogen Antibodies (provider)
- Main image

- Experimental details
- Figure 6 Characterization of exosomes derived from CL 187 cells and CRC patient plasma. A, Representative electron microscope images of exosomes isolated from CL 187 cells. B, Western blotting analysis of LEA and exosome-marker expression in exosomes from CL 187 cells using ND -1, anti- TSG 101, and anti- CD 63, respectively. C, Representative analysis of LEA expression in exosomes from CRC patient and healthy donor plasma by western blotting analysis using ND -1

- Submitted by
- Invitrogen Antibodies (provider)
- Main image

- Experimental details
- Figure 1 Isolation and characterization of exosomes. (A) Image of exosomes observed by transmission electron microscopy. (B) Size distribution of exosomes secreted by non-treated HCT116 cells. (C) Western blot of alpha-tubulin, CD63 and CD81 in exosomes and cells.

- Submitted by
- Invitrogen Antibodies (provider)
- Main image

- Experimental details
- Fig 2 Characteristics of exosome-depleted FBS. In (a) Quantification of exosomes present in the cell culture medium supplemented with STD FBS or ED FBS at the input and in the post-UC fractions (supernatant and pellet) based on ACHE activity. In (b) Western blot of CD63 in the cell culture medium either before (input) or after UC (supernatant); Ponceau S staining demonstrates the serum albumin content. In (c) Coomassie blue staining of electrophoretically-separated proteins from standard (STD) and exosome-depleted (ED) FBS. In (d) Effects of supplementation with FBS on cell viability; FaDu cells were cultured for 24 h in a medium supplemented with STD FBS, ultracentrifuged STD FBS (STD-UC) or ED FBS.

- Submitted by
- Invitrogen Antibodies (provider)
- Main image

- Experimental details
- Fig 3 Exosome isolation by the size exclusion chromatography. In (a) representative immunoblot showing the distribution of exosome markers (CD63, CD9, CD81) and high-abundance serum proteins (illustrated by Ponceau S staining) in the successive SEC fractions of a FaDU culture medium. In (b) total protein concentrations (mug/uL) in the subsequent SEC fractions. In (c) culture medium supplemented with 5% ED FBS and NOT co-cultured with cells was analyzed as in Panel A; ""E+"" denotes exosome-containing positive control.

- Submitted by
- Invitrogen Antibodies (provider)
- Main image

- Experimental details
- Figure 1 Generation and characterisation of TRAIL-loaded EVs (TRAIL-EVs). ( A ) Flow cytometry analysis of TRAIL expression in 293T cells transfected by empty virus (293T) or TRAIL-expressing lentiviruses (293TflT); ( B ) Immunofluorescent detection of TRAIL expression (red) by a PE-anti human TRAIL antibody in 293T and 293flT cells with nuclei labeled as blue by DAPI; ( C ) Electron microscopy of EVs isolated and purified by ultra-centrifugation of 0.22 um filtering cleared supernatant of 293TflT cells grown in EV-depleted FBS containing medium; ( D ) Assessment of size distribution of isolated EVs by a Flow Nanoanalyzer that can detect nanoparticles with size ranging from 7 to 1000 nm; ( E ) Measurement of TRAIL expression levels in EVs derived from 293T (293T-EV) or 293TflT(293TflT-EV) using a commercial TRAIL-specific ELISA kit. Values are mean +- S.E.M ( n = 3). ( F ) Western blotting detection of TRAIL, tetraspanin CD63 and loading control protein alpha-tubulin in EVs or cellular lysates; for each sample 10 µg of cellular or EV proteins were analyzed.

- Submitted by
- Invitrogen Antibodies (provider)
- Main image
- Experimental details
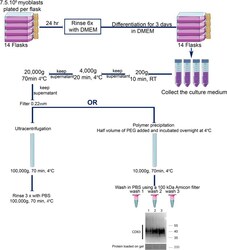
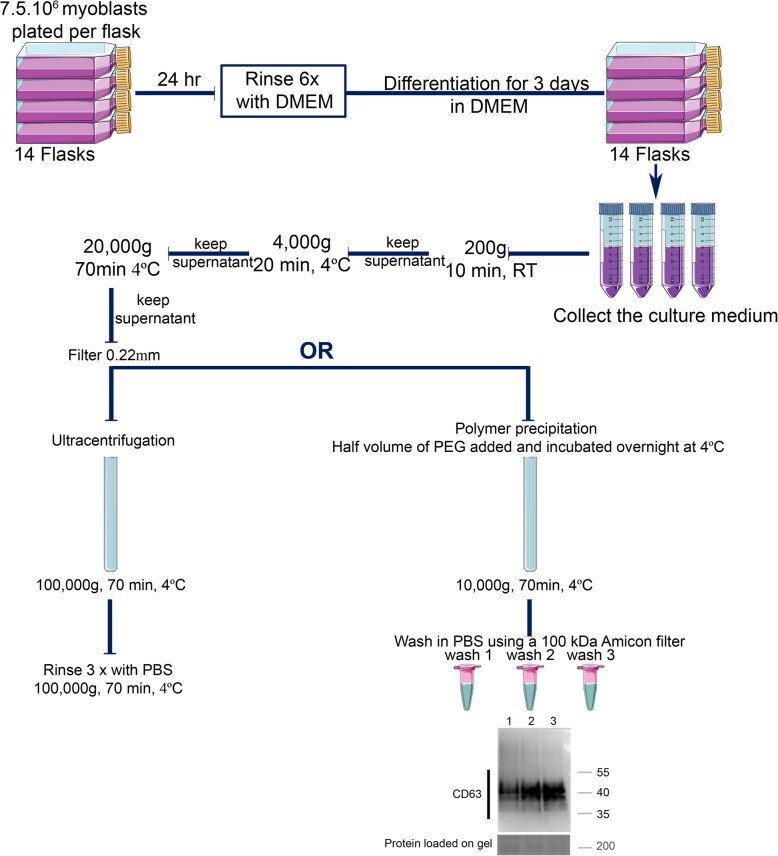
- Fig. 3 Schema summarizing the protocols used to extract muscle exosomes from the primary human myotube culture medium, using either the ultracentrifugation or the modified polymer-precipitation strategy. For a single data point, 14 flasks of 225 cm 2 are plated with 7.5 x 10 6 myoblasts. After 24 h, once the myoblasts have attached to the flask, they are rinsed 6 times in DMEM and then differentiated into myotubes by cultivating them in DMEM. After 72 hr, the conditioned medium is collected for muscle exosome extraction. After removing dead cells (200 g, 10 min, RT), cell debris (4000 g, 20 min, 4 degC), and ectosomes (20,000 g, 70 min at 4 degC, and filtered at 0.22 mum), the cleared media is subjected to exosome extraction either by the ultracentrifugation protocol or by a modified polymer-precipitation protocol. Ultracentrifugation is at 100,000 g (70 min, 4degC), which is followed by washing the pellets three times with PBS (100,000 g, 70 min, 4degC). The subsequent pellet is then either resuspended in 100 mul of PBS or in NuPAGE(tm) LDS sample buffer for western blot. For the modified polymer-precipitation protocol, the polymer is added at half the volume of the pre-cleared media and incubated overnight at 4 degC. The mix is then centrifuged at 10,000 g for 70 min at 4 degC. The subsequent pellet is then washed 3 times in PBS using a 100 kDa Amicon(r) filter column. Western blot shows the rescue of the epitope CD63 after 3 washes in PBS
- Submitted by
- Invitrogen Antibodies (provider)
- Main image

- Experimental details
- Fig. 4 Validation of exosome extraction strategy . For each experiment, exosomes were extracted from the culture medium of 100 x 10 6 myoblasts differentiated into myotubes for 3 days using either the ultracentrifugation or the polymer precipitation. The culture medium was non-supplemented DMEM (without serum). a Cup-shaped vesicles were observed by electron microscopy with both extraction protocols. bar = 100 nm. b Both extractions show vesicles that are positive for CD63 and CD82 by electron microscopy. Bar = 100 nm. c Exosome extracts were loaded on iodixanol gradients as described in material and methods. Western blot results are shown for CD63 and CD81 in twelve fractions for the iodixanol gradient. Top panel: exosomes extracted by ultracentrifugation. Bottom panel: exosomes extracted by polymer-based precipitation. Exosomes were detected at a density of 1.15-1.27 g.ml -1 . d Nanosight analyses show similar-sized vesicles using both strategies, from 100-200 nm, with a greater number of particles being detected when using the polymer extraction. e Proteomic analysis of muscle exosomes. Venn diagram showing the overlap between muscle exosomes and proteins known to be detected by mass spectrometry in exosomes (Vesiclepedia, Exocarta database [-])

- Submitted by
- Invitrogen Antibodies (provider)
- Main image

- Experimental details
- Fig. 5 Polymer-based precipitation efficiently extracts functional exosomes from 7.5 x 10⁶ cells. a SDS-page protein quantification showing that the greatest efficiency in terms of exosomal protein per cell plated was obtained when exosomes were extracted from differentiated myoblasts at a density of 33,400 cells.cm -2 . Differentiated myoblasts were plated at 14,147 (lane 1), 33,400 (lane 2), or 106,100 (lane 3) cells per cm 2 . Right panel: representative SDS-page stained with Coomassie. Left panel: protein concentration measurements in secreted exosomes from cells plated at a different density. *, ***, P < 0.05 and P < 0.001, significantly different from 33,400 and 106,100 cells.cm 2 . ( n = 4, 3, 4 per condition). b Muscle exosomes were positive for CD63, CD81, Flotillin, HSPA8, and Alix. c mRNA was detectable with a clean profile from polymer-precipitated exosomes of 7.5 x 10 6 differentiated myoblasts. No 18 s and 28 s RNA were detected, indicating that there were no RNA contaminants from dead cells. Inset panel: Representative electrophoresis obtain with Agilent 2100 Bioanalyzer for myotubes and exosome RNA extract. d Western blot showing that polymer precipitated exosomes from 7.5 x 10 6 differentiated myoblasts can be used to pull down a specific subpopulation such as CD63 positive exosomes (+/-CD63 = with/without anti-CD63 antibody). e Polymer-precipitated exosomes (pre-stained with PKH26 following extraction; red channel) were capable of integrating into myotubes o

- Submitted by
- Invitrogen Antibodies (provider)
- Main image

- Experimental details
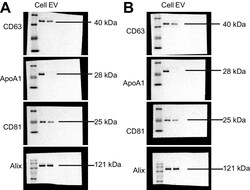
- FIGURE 4 Positive detection for specific exosomal surface markers (CD 63, CD9, and CD81) and for the control-positive marker (b-actin) by immunoblotting. (A) exosomes isolated by UC and (B) TEIp kit.

- Submitted by
- Invitrogen Antibodies (provider)
- Main image

- Experimental details
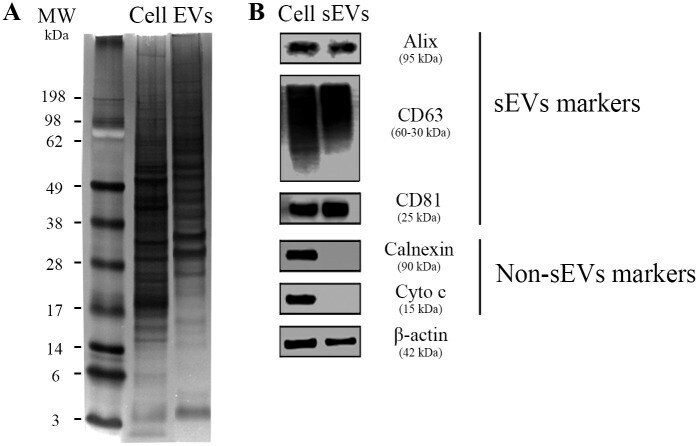
- Fig 4 Protein markers of MDM-derived sEVs. (A) Representative image of three independent assays of polyacrylamide gel stained with silver nitrate after separation of 40 mug total protein from cell (Cell) or sEVs pool lysates (EVs; pools comprise samples from four individual donors). (B) Western blot analysis of sEVs markers (Alix, CD63, and CD81) and non-EVs markers (Calnexin and Cytochrome C) ( n = 3). beta-actin = loading control. 40 mug of total protein were loaded onto the gel. MW: molecular weight marker.
- Submitted by
- Invitrogen Antibodies (provider)
- Main image

- Experimental details
- Figure 2 Successful isolation of exosomes from blood plasma was verified by Transmission Electron Microscopy (TEM), Western Blot, and Nanoparticle tracking. ( A ) Two representative TEM graphs showing negatively stained exosomes isolated from an HNSCC patient. As indicated by the size bars, exosomes vary in diameter between 30 and 150 nm and have round to oval shapes. Size bar on the top TEM graph = 500 nm, size bar on the bottom TEM graph = 200 nm. ( B ) Western Blot analysis of exosomes was performed to confirm the expression of exosomal markers TSG101, CD9 and CD63 and the expression of epithelial cell marker EpCAM (upper frame). Exosomes were also analyzed for negative markers ApoA1 and Grp94 along with plasma (diluted 50x in PBS) and cell lysate samples as positive controls. MW marker, positive control molecular weight marker. ( C ) Size distribution of exosomes was measured by nanoparticle tracking. The mean diameter was 86.8 nm. The maximal and minimal diameters were 257.5 nm and 22.5 nm, respectively. The 90th and 10th percentile were at 121.2 and 53.6 nm, respectively. ( D ) Protein content of exosomes was determined by Bicinchoninic Acid (BCA) Assay. Average protein content: 80.9 g/mL (HNSCC exosomes), 69.2 g/mL (healthy volunteer exosomes). n = 23 (HNSCC), n = 10 (NC). HNSCC, exosomes from blood plasma of HNSCC patients. NC = no cancer, exosomes from blood plasma of healthy volunteers. ( E ) B cells that were not co-cultured with exosomes exhibited colony formation

- Submitted by
- Invitrogen Antibodies (provider)
- Main image

- Experimental details
- FIGURE 2 Total IRS-1, p-IRS-1 and downstream substrates level in blood neuron-derived extracellular vesicles. (A) The representative protein blot images of IRS-1 and different phosphorylated forms of IRS-1, including Y612, S616, S636/639, and S312. HSP70 and CD63 were exosomal proteins and markers. GAPDH was the protein loading control (1 and 2 indicate different samples). Comparison of the levels of total IRS-1, p-IRS-1 Y612 , p-IRS-1 S616 , p-IRS-1 S636/639 , p-IRS-1 S312 (B) , and downstream IRS-1 substrates (C-E) between healthy controls [with or without diabetes mellitus (DM)] and Parkinson's disease (PD) patients (with or without DM). The phosphorylation status of IRS-1, P70S6K, Akt, and Erk was normalized to total form IRS-1, P70S6K, Akt, and Erk. (F) The EV markers-CD63 and HSP70 was not different between 4 groups. Data was presented as mean +- SEM. * p < 0.05.

- Submitted by
- Invitrogen Antibodies (provider)
- Main image

- Experimental details
- Figure 1 Human BMSC-derived sEVs can be taken by MM cells. (A) Transmission electron microscopy images of human BMSC-derived sEVs. (B) Size distribution of human BMSC-derived sEVs was determined using the nanoparticle tracking analysis. (C) Exosomal positive markers, including CD63, CD9, flotillin-1, as well as a negative marker calreticulin, in BMSC and BMSC-derived sEV lysate were measured using western blot. (D) 50 mug/mL DID-labeled BMSC-derived sEVs or DID control solution was added to four MM cell lines, including RPMI 8226, MM1S, U266, and H929. After 24 h of culture, the fluorescence signal of DID in these cells was examined using flow cytometry. PBS was added to cells and included as a control. (E) 50 mug/mL DID-labeled BMSC-derived sEVs were added to four MM cell lines and the mean and median fluorescence intensity of DID in these cells was determined using flow cytometry after the culture for indicated times. n=3. Error bar, mean +- SD.

- Submitted by
- Invitrogen Antibodies (provider)
- Main image

- Experimental details
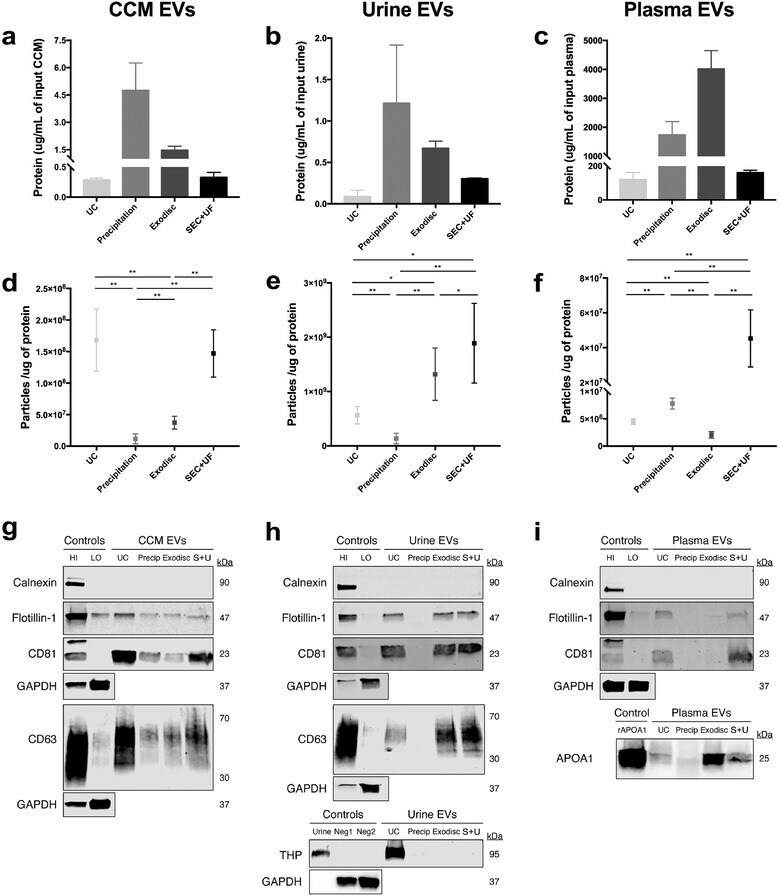
- FIGURE 6 Purity of EV samples assessed by particle/protein ratio and Western blotting. (a)-(c) The protein concentrations of EV preparations separated by different methods from CCM, urine and plasma. The protein concentrations have been corrected for initial sample input volume. (d)-(f) The particle/protein ratios of EV preparations separated by different methods from CCM, urine and plasma. The particle numbers were measured by nFCM. The error bars represented the standard deviation of three repetitive experiments. * P < 0.05, ** P < 0.01, one-way ANOVA analysis with Tukey multiple comparison test as well as a variance-covariance model. (g) Western blots of flotillin-1, CD63, CD81, and calnexin for EV preparations separated from CCM by different methods. 9 mug of protein from each EV preparation was loaded. (h) Western blots of flotillin-1, CD63, CD81, THP and calnexin for EV preparations separated from urine by different methods. 3.3 mug of protein from each EV preparation was loaded. (i) Western blots of flotillin-1, CD81, APOA1 and calnexin for EV preparations separated from plasma by different methods. 25 mug of protein from each EV preparation was loaded. MCF7 membrane and cytosolic protein fractions served as positive and negative controls for flotillin-1, CD63, CD81 and calnexin. Whole urine sample was used as positive control and MCF7 cellular fractions as negative control for THP. Recombinant human Apolipoprotein A1 served as positive control for APOA1.GAPDH staining
- Submitted by
- Invitrogen Antibodies (provider)
- Main image

- Experimental details
- Fig. 1 Characterization of extracellular vesicles (EVs) released by HaCaT cells. a Western blotting analysis of purified vesicles (EV) for exosomal surface markers (CD9, CD63) and endoplasmic reticulum marker (GRP94) side by side with HaCaT cell lysate (CL). b Venn diagram of identified proteins and proteins in the vesiclepedia database. The pink area represents proteins from the vesiclepedia database and the blue area represents proteins we identified. The identified proteins in HaCaT cell-derived EVs were analyzed using FunRich Bioinformatic Resources and classified by c biological process, d cellular component, or e molecular function

- Submitted by
- Invitrogen Antibodies (provider)
- Main image

- Experimental details
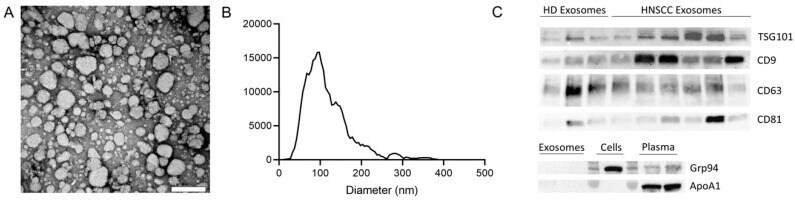
- Figure 1 Characterization of exosomes isolated from plasma. ( A ) Representative transmission electron microscopy (TEM) image of exosomes. Scalebar = 200 nm. ( B ) Representative size distribution of exosomes measured by nanoparticle tracking analysis (NTA). ( C ) Exosomes derived from plasma of healthy donors (HD) and head and neck squamous cell carcinoma (HNSCC) patients were analyzed by Western blot for the presence of exosome specific markers using antibodies against CD63 and CD81 under non-reducing conditions and antibodies against CD9 and TSG101 under reducing conditions. Western blot analysis for the negative marker Grp94 and the apolipoprotein Apo1A was also performed for exosomes, cells, and plasma.
- Submitted by
- Invitrogen Antibodies (provider)
- Main image

- Experimental details
- Figure 2 Successful isolation and characterization of engineered EVs displaying peptides of interest. (A) Representative size distribution of the naive, pep1- and p88-display EVs determined by Nanoparticle Tracking Analysis. (B) Transmission electron microscopy images of naive, pep1-, and p88-EVs showing gold labeled HA and CD63 surface markers. (C) Western blot analysis of engineered EVs (p88 fusion peptide-44Kda; pep1 fusion peptide-42KDa) for the presence of EV biomarkers CD63(30-60KDa) and TSG101(44KDa), and peptide HA-tag. Additionally, analysis of cell lysate and engineered EVs for cellular biomarkers Calnexin (67KDa) and beta-actin (42KDa) (D) Summary of particle number and pDNA copy numbers determined by NTA and qPCR of pep1- and p88-display EVs. (E) pDNA quantification before and after DNase I treatment of EVs. Naive EVs mixed with pDNA and p88 EVs were treated with DNase I. pDNA were quantified by qPCR following pDNA isolation. *pDNA undetected

- Submitted by
- Invitrogen Antibodies (provider)
- Main image

- Experimental details
- Fig. 3 Characterization of control EVs and Cur-EVs. a Representative western blot image showing bands of standard surface markers (CD9, CD63, CD81) of control EV- and Cur-EV lysates. b , c Morphology of control EVs and Cur-EVs was monitored by TEM; scale bar, 100 nm. d , e Particle size distribution of control EVs and Cur-EVs was measured by NTA. f , g Quantitative comparison between control EVs and Cur-EVs in count and size measured by NTA; n = 3. h Absorbance at 420 nm of control EVs and Cur-EVs was determined with by spectrophotometry indicating presence of curcumin in Cur-EVs; n = 3. i Cell nuclei were stained with DAPI (blue) and chondrocytes were stained with Phalloidin (green) to visualize the structure of the cytoskeleton. PKH26-labeled control EVs (red) and Cur-EVs (red) were internalized by chondrocytes and visualized with fluorescent microscopy

- Submitted by
- Invitrogen Antibodies (provider)
- Main image

- Experimental details
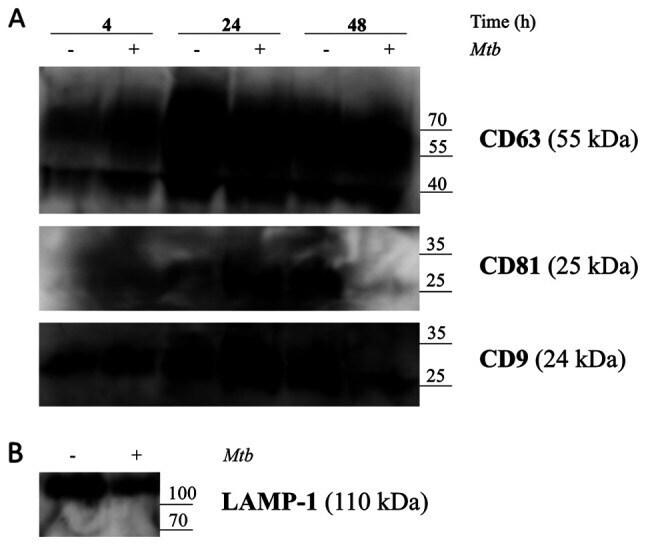
- Figure 5. Release of exosomes from Mtb H37Rv-infected or naive THP-1 cells. THP-1 macrophages were infected with Mtb H37Rv (Mtb + ) for 4 h (MOI 5) in DCM-UG medium for 4, 24 and 48 h at 37degC and in the presence of 5% CO 2 . Exosomes were extracted from cell culture supernatants using total exosome isolation reagent and were further analyzed by western blot analysis for the exosomal protein markers, (A) CD63, CD81, CD9 and (B) LAMP-1, which served as a positive control for exosomes signal and Mtb proteins [Ag85 and Mpt64 and recombinant Mtb Mpt64 protein (His-tag)]. Data from one representative experiment out of at least three independent experiments are shown. MOI, multiplicity of infection; Mtb, Mycobacterium tuberculosis ; DCM-UG, ultra-centrifuged CellGenix (r) GMP DC Medium; LAMP-1, lysosomal associated membrane protein-1; Ag85, mycobacterial antigen 85.
- Submitted by
- Invitrogen Antibodies (provider)
- Main image

- Experimental details
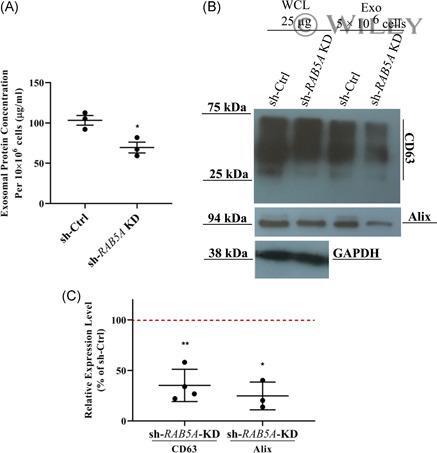
- 7 Figure Effect of RAB5A knockdown on exosome secretion. (A), Quantification of total protein of exosome samples isolated from RAB5A knockdown and scrambled cells ( n = 3, two-tailed Student's t test, mean +- SEM ). (B), Representative image of western blot of exosomal markers, CD63 and Alix. The total protein of exosome samples were loaded based on an equal number of cells (5 x 10 6 ), whereas an equal amount of whole-cell lysate (25 ug) was loaded. One experiment out of three is shown. (C), Quantitative analysis of CD63 and Alix expression in exosome samples isolated from RAB5A knockdown cells compared with scrambled cells. The red horizontal dashed line indicates the level of scrambled cells as control (CD63 n = 4, Alix n = 3, two-tailed Student's t test, mean +- SEM ). sh-Ctrl, stable scrambled cells; sh- RAB5A KD, stable RAB5A knockdown cells; * p
- Submitted by
- Invitrogen Antibodies (provider)
- Main image

- Experimental details
- Fig. 2 Effect of deuterium labelling on cell viability and extracellular vesicle production. (a-c) Effect of deuterium labelling on (a) cell viability ( N = 2, n = 12), (b) hydrodynamic diameter of isolated EVs ( N = 6, n = 3), and (c) particle number of isolated EVs ( N = 6, n = 3) for MDA-MB-231 cells cultured on deuterium-containing medium (containing D 2 O, d-Chol, or d-Gluc) for 72 hours as compared to untreated controls, measured via nanoparticle tracking analysis. Data presented as mean SD +- (one-way ANOVA, Tukey's honest significant differences post hoc correction, * P < 0.05, ** P < 0.01, *** P < 0.001). (d-f) Expression of three different EV markers, (d) CD9, (e) CD63, and (f) CD81, for EVs isolated from MDA-MB-231 cells cultured on deuterium-containing medium (containing D 2 O, d-Chol, or d-Gluc) for 72 hours as compared to untreated controls measured via immunoblotting analysis ( N = 6, n = 1). Data presented as mean +- SD.

- Submitted by
- Invitrogen Antibodies (provider)
- Main image

- Experimental details
- Figure 1 Protein sample were profiled with TotalSeq antibody. ( a ) Basic work flow for detection of immobilized protein sample by TotalSeq-A antibody. Structure of conjugated oligo in TotalSeq-A antibody (up right), reprint from BioLegend website with permission. Size and comparison of pre-cut strip and PCR tube (bottom right). ( b ) Melting curve of different TotalSeq antibodies on EV protein samples in triplicate. ( c ) Intact (upper left) or lysised (upper right) #1 EV samples were tested with TotalSeq CD63 (green) and control mIgG (blue) antibody in Triplicate. Equal amount of BSA (triangle) was used as negative control. Ct values of CD63 (white) and control mouse IgG (gray) are overlaid in column chart to show the difference. ( d ) Serial dilution of #1 EV sample was incubated with TotalSeq antibody CD63 (square), CD81 (triangle), EGFR (diamond) and control IgG (circle). Amplification curve (bottom) of CD63 on EV dilution (green) and BSA (blue). All experiments were performed in duplicate. ( e ) CD63 immunoblot result of EV and whole cell lysate. Full-length blots are presented in Supplementary Figure S7 . ( f ) TotalSeq qPCR result on the same samples as in ( e ). Data were normalized to wild type HEK293 samples.

- Submitted by
- Invitrogen Antibodies (provider)
- Main image

- Experimental details
- Fig. 1 Preparation and identification of ICG/PTX@RGE-EV. A Morphological characteristics of EVs derived from Raw264.7 cells under TEM (scale bar = 100 nm). B Diameter of EVs detected by NTA. C Protein expression of EV markers, CD63, CD81, Alix and EV contamination index ApoA1 detected by Western blot analysis. D Morphological characteristics of ICG/PTX@RGE-EV under TEM (scale bar = 100 nm). E Diameter of EVs detected by NTA. F Protein expression of EV markers, CD63, CD81, Alix and EV contamination index ApoA1 in ICG/PTX@RGE-EV detected by Western blot analysis. G ICG/PTX@RGE-EV observed under super-resolution fluorescence microscopy (green fluorescence: RGE) (scale bar = 20 mum). H ICG/PTX@RGE-EV under confocal microscope (red fluorescence: EV, green fluorescence: RGE) (scale bar = 20 mum). I U251 cells incubated with CM-DiI-labeled ICG/PTX@RGE-EV observed under confocal microscope (scale bar = 20 mum). J FITC-positive cells identified by flow cytometry (i, U251 cells incubated with ICG/PTX@RGE-EV; ii, U251 cells incubated with ICG/PTX@ EV and RGE; iii, U251 cells incubated with ICG/PTX@EV; iv, free U251 cells; v, FITC-labeled U251 cells). Measurement data were expressed as mean +- standard deviation. Data comparison was analyzed by one-way ANOVA among multiple groups, followed by Tukey's post hoc test. * p < 0.05 vs. the i group. The experiment was repeated in triplicate

- Submitted by
- Invitrogen Antibodies (provider)
- Main image
- Experimental details
- Additional file 1: Fig. S1. Representative images for Western blot analysis of EV markers CD63, CD81, Alix and EV contamination index ApoA1.

- Submitted by
- Invitrogen Antibodies (provider)
- Main image

- Experimental details
- Additional file 5: Fig. S5. In vitro stability of ICG/PTX@RGE-EV. A, Concentration of RGE-peptide bound on EVs. B, ICG concentration in EVs. C, PTX concentration in EVs. D, Expression of EV markers CD63, CD81 and EV contamination index ApoA1 in ICG/PTX@RGE-EV and Raw264.7 cells detected by Western blot analysis. E, Diameter and Zeta potential of EVs detected by NTA. Measurement data were expressed as mean +- standard deviation. Data comparison was analyzed by one-way ANOVA among multiple groups, followed by Tukey's post hoc test. The experiment was repeated three times independently.

- Submitted by
- Invitrogen Antibodies (provider)
- Main image

- Experimental details
- FIGURE 2 Characterization of control EVs and gene analysis of hsa-124-3p in serum-derived EVs and serum. (A) Representative image of Western blotting showed bands of standard surface markers ( CD9 , CD63 , and CD81 ) of EVs and EV-depleted serum. (B) Morphology of EVs was monitored by TEM; scale bar: 100 nm. (C,D) Particle size distribution of EVs was determined by NTA. (E,F) Gene expression of hsa-miR-124-3p in EVs and serum of different samples at different time points. Compared to the control group: * p < 0.05; ** p < 0.01; *** p < 0.001; **** p < 0.0001, # Difference between groups: # p < 0.05; ## p < 0.01; #### p < 0.0001; one-way ANOVA with the Newman-Keuls multiple comparison test.

- Submitted by
- Invitrogen Antibodies (provider)
- Main image

- Experimental details
- Fig. 2 Protein analyses of kidney EVs by western blot and mass spectrometry. a Western blots of lysed kidney EVs demonstrate presence of flotillin-1, CD63, and CD81 and absence of cellular debris marker calnexin. Control samples were MCF7 membrane (HI) and cytosolic protein (LO) fractions. b Bubble plot of EV protein expression across kidney EVs demonstrates a similar pattern of EV protein expression as seen on the western blots. For each marker, log 2 ratios were calculated by normalization to the reference channel (pooled cellular reference). c Functional Gene Ontology (GO) annotation of the EV-associated proteins commonly identified across six renal cell lines

- Submitted by
- Invitrogen Antibodies (provider)
- Main image
- Experimental details
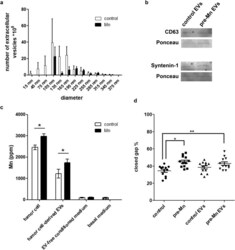
- Figure 6 Tumor cell-derived extracellular vesicles are enriched in manganese and affect tumor cell migration. LLC cells-derived extracellular vesicles were concentrated by ultracentrifugation. ( a ) EVs quantification and size determination. N = 6. ( b ) CD63 and syntenin-1 detection by Western blotting. Ponceau was used as total protein control. ( c ) Tumor cells, EV-enriched fraction, EV-free conditioned medium and basal medium were analyzed by X-Ray Fluorescence. N = 6. Units are expressed in concentration as ppm (parts per million). Control cells--white bars; Mn-pretreated cells (Mn) - black bars. *p < 0.05, Student's T test. ( d ) Wound healing assays of LLC cells incubated with extracellular vesicle-enriched medium from control and Mn-pretreated LLC cells. N = 12. *p < 0.05; **p < 0.01, one-way ANOVA and Bonferroni's Multiple Comparison Test.

- Submitted by
- Invitrogen Antibodies (provider)
- Main image

- Experimental details
- FIGURE 1 VE characterization from explant culture supernatant. (A) Representative vesicle size distribution (nm) by NTA of VE. (B) Western blot analysis for the CD63 exosome marker. (C) Quantification of VE by ELISA measuring CD63 (controls vs. EO-PE p = 0,2069; controls vs. LO-PE p = 0,0262; EO-PE vs. LO-PE: p = 0,0175). (D) Quantification of protein within VE by Bradford method (controls vs. EO-PE p = 0,2069; controls vs. LO-PE p = 0,6031; EO-PE vs. LO-PE: p = 0,3129). (E) Analysis of ratio of protein quantity by VE (controls vs. EO-PE p = 0,0175; controls vs. LO-PE p = 0,3759; EO-PE vs. LO-PE: p = 0,0262) * p

- Submitted by
- Invitrogen Antibodies (provider)
- Main image
- Experimental details
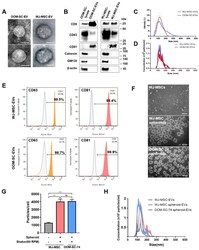
- Figure 3 Characterization of OOM-SC-EVs. ( A ) TEM images of EVs showing cup- or sphere-shaped morphology. TEM analysis was performed at 80 kV. Scale bar = 100 nm. ( B ) Characterization of the expression levels of the EV-associated positive surface markers, including CD9, CD63, CD81, calnexin, and GM130, via immunoblotting. We used 3 ug of EVs for the immunoblotting analysis. The protein expression levels of the EV markers were compared with those of the whole cell lysate. ( C ) Dynamic light scattering analysis of EVs sizes. The average diameter of the purified EVs was of a size range of 90 to 120 nm. ( D ) Nanoparticle tracking analyzer NS300 for counting EV numbers. EVs concentrations were 1.66 x 10 10 particles/mL for OOM-SC-EVs and 1.5 x 10 10 particles/mL for WJ-MSC-EVs. ( E ) FACS analysis confirmed the expression of EV-associated markers, namely CD63 and CD81. ( F ) Phase-contrast microscopic pictures of WJ-MSCs monolayer and spheroids of WJ-MSCs and OOM-SCs (OOM-SC-74). For spheroid culture, WJ-MSCs and OOM-SCs were seeded onto F127 -coated AggreWell 400 TM plates for 24 h for EB formation. Then, EBs were transferred to the ORS at 60 rpm for two days. EVs were isolated from both spheroids and the monolayer simultaneously. Scale bar = 200 mum. ( G , H ) Nanoparticle tracking analyzer NS300 for counting EV numbers in monolayer and spheroids. We detected 1246 particles/cell in WJ-MSCs monolayer, whereas EVs yield from WJ-MSCs and OOM-SCs spheroids were 3984 particles/c

- Submitted by
- Invitrogen Antibodies (provider)
- Main image

- Experimental details
- Figure 1 Characterization of small extracellular vesicles (sEVs) derived from human Head and Neck Squamous Cell Carcinoma cell lines: FaDu (hypopharyngeal squamous cell carcinoma), PCI-30 (tongue squamous cell carcinoma), SCC-25 (tongue squamous cell carcinoma); and sEVs derived from HaCat (immortalized human keratinocytes). ( A ) Representative cryogenic transmission microscopy image of HNSCC cell-derived sEVs. ( B ) Representative concentration and size distribution plot of HNSCC-derived sEVs measured by nanoparticle tracking analysis (NTA) and particle visualization based on Brownian motions. ( C ) Immunoblotting of sEV markers CD63, CD9, and negative marker Grp94 in HNSCC-derived sEVs. Full blot images are presented in Figures S2-S4 . ( D ) Particle concentration related to normoxic (21% O 2 ) and hypoxic (1% O 2 , 5% O 2 , 10% O 2 ) conditions. Results were obtained using NTA and normalized to the protein levels in lysates of producer cells. ( E ) Particle diameter related to normoxic (21% O 2 ) and hypoxic (1% O 2 , 5% O 2 , 10% O 2 ) conditions. Results were obtained using NTA. All data represent three biological replicates and are presented as means +- SD. * p < 0.05 vs. 21%; ** p < 0.01 vs. 21%; *** p < 0.001 vs. 21%.

- Submitted by
- Invitrogen Antibodies (provider)
- Main image

- Experimental details
- Figure 1 Characterization of control EVs and HR-EVs. EVs were processed for western blot, TEM and NTA after isolated from 500mul serum of control and HR groups. (A) The same amount (30mul) of control EVs, HR-EVs and EVs-depleted-Serum were identified using western blot. Representative western blot image showing bands of standard surface markers (CD9, CD63, CD81) of control EVs and HR-EVs. (B, C) Morphology of control EVs and HR-EVs was monitored by TEM; Scale bar: 100 nm. (D, E) Particle size distribution of control EVs and HR-EVs was determined by NTA. Distribution of EVs with a size of 90-200 nm in diameter in both groups. (F, G) Quantitative comparison between control EVs and HR-EVs in count and size measured by NTA; n = 10; All values represent mean +- standard deviation. * p < 0,05, independent two-tailed Student's t -tests.

- Submitted by
- Invitrogen Antibodies (provider)
- Main image

- Experimental details
- Figure 2 HR promoted the concentration of EVs and CD203c + -EVs and CD63 + -EVs derived from serum. 500mul serum from control and different time point HR groups were used to pellet EVs, finally, the EVs were resuspended in 200mul PBS. The total concentration of EVs was determined by a BCA assay. The protein expression levels of CD63, CD203c, CD9 and CD81 in EVs/serum were identified using western blotting. (A) Total concentration of EVs isolated from same volume serum of control and different time point HR groups, n = 10. (B-F) Relative CD63, CD203c, CD9 and CD81 protein expression levels of EVs derived from same volume of serum in control and HR groups, 30mul EVs/lane, n = 5 (G-I) Relative CD63 and CD203c expression levels in same volume of serum in the control and HR groups, 30mul serum/lane, n = 5. All values represent the mean +- standard deviation. Difference to control: ** p < 0,01; *** p < 0,001; # Difference between groups: # p < 0,05; ## p < 0,01; 1 way ANOVA with Newman-Keuls Multiple Comparison Test.

- Submitted by
- Invitrogen Antibodies (provider)
- Main image

- Experimental details
- FIGURE 6 Characterization of plasma exosomes and uptake of exosomes by macrophages. (A) Electron microscopy observation of whole-mounted exosomes purified from plasma. (B) Average overall size distribution of exosomes from plasma using nanoparticle tracking analysis. (C) The proteins from isolated exosomes were initially characterized on Western blot to assess the expression of CD63 and CD9. (D) Internalization of PKH67 (green)-labeled exosomes in THP1 cells induced by phorbol-12-myristate-13-acetate was captured by living cell imaging. Fluorescent cellular imaging was carried out using the green fluorescent protein channel for PKH67 fluorescence-labeled exosomes (green). Cell counts were detected with bright field. (E) The relative object integral fluorescence was measured over time with the uptake of exosomes. (F) The percentage of uptake rate was calculated with the software.

- Submitted by
- Invitrogen Antibodies (provider)
- Main image

- Experimental details
- Figure 1 Characterization of OCEXs. (A) The sizes of the WSU-HN4- and SCC-9-derived exosomes were determined by NTA. (B) Representative images of exosomes derived from WSU-HN4 and SCC-9 cells, as detected by TEM. Scale bars, 50 nm. (C) Expression of the exosomal markers, Alix, CD63, CD9 and Rab5, in WSU-HN4- and SCC-9-derived exosomes was determined by western blot analysis. (D) Co-expressed proteins in WSU-HN4- and SCC-9-derived exosomes were detected by mass spectrometry. (E) Overlap of OCEX proteins and the top 100 frequently identified exosomal protein markers from the ExoCarta database. OCEXs, oral cancer-derived exosomes; NTA, nanoparticle tracking analysis; TEM, transmission electron microscopy; EXO/Exo, exosomes.

- Submitted by
- Invitrogen Antibodies (provider)
- Main image

- Experimental details
- Figure 2 Characterization of hBMSC-derived EVs. (A) Representative western blot image ( n = 4) demonstrates standard surface markers (CD9, CD63, and CD81) of hBMSC-derived EVs (lane 1: hBMSC lysate; lane 2: hBMSC-EVs). (B) Particle size distribution of hBMSC-EVs was measured by NTA. (C) Morphology of hBMSC-EVs was monitored by SEM, scale bar: 1 mum. (D) Cell nuclei were stained with DAPI (blue) and chondrocytes were stained with phalloidin (green) to visualize the cytoskeleton. PKH26-labeled hBMSC-derived EVs (red) internalized by chondrocytes were visualized with fluorescent microscopy.

- Submitted by
- Invitrogen Antibodies (provider)
- Main image

- Experimental details
- Figure 3 Characterization of EV-depleted FCS (FCS depl-uc ). Prior to ultracentrifugation, normal FCS was diluted in culture medium to different concentrations (20, 50%, and undiluted = 100%); different FCS depl-uc groups were identified after ultracentrifugation. (A,B) FCS depl-uc-20% was controlled for EV surface makers (CD9, CD63, and CD81) detected by western blotting (lane 1: hBMSC lysate; lane 2: hBMSC-EVs; lane 3: undepleted FCS; lane 4: FCS depl-uc-20% ). Representative western blot image (A) and Ponceau Red-stained images for each surface marker (B) are shown; n = 3. (C,D) Proliferation and apoptosis of hBMSC were determined by BrdU assay and caspase-3/7 activity assay separately after being incubated in culture medium supplemented with the different FCS groups for 24 h. All values represent mean +- standard deviation. *Significant difference to control: * p < 0.05; ** p < 0.01; # Significant difference between groups: # p < 0.05; ### p < 0.001 one-way ANOVA with Newman-Keuls Multiple Comparison Test; n = 4.
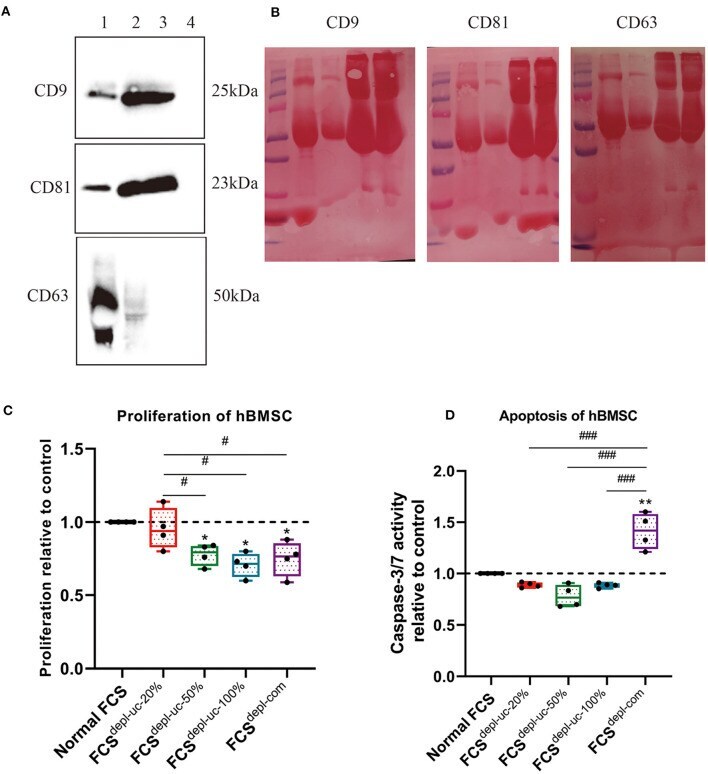
- Submitted by
- Invitrogen Antibodies (provider)
- Main image

- Experimental details
- Fig. 3 Plasma cell exosomal miR-330-3p could be transferred to ovarian cancer. ( A ) Schematic diagram of plasma cells and ovarian cancer cells cocultured in six-well plates. ( B ) Ovarian cancer cells were cocultured in the absence or presence of primary PKH67-labeled plasma cells (green). Nuclei were stained with DAPI (blue) ( n = 3 for each group). Scale bar, 20 mum. ( C ) Western blot analysis for CD63, CD81, and beta-actin in plasma cell exosomes ( n = 3 for each group). ( D ) Electron micrograph of plasma cell exosomes shows the morphological size (50 to 200 nm). Scale bar, 100 nm. ( E ) Size distribution of exosomes was measured using NanoSight analysis. ( F and G ) Immunofluorescent images of PKH67 abrogation in ovarian cancer cells with respective treatment. Scale bar, 20 mum. Statistical chart was plotted ( n = 3 for each group). ( H ) Scheme chart for small RNA sequencing in plasma cell exosomes in patients with ovarian cancer. tRNA, transfer RNA; rRNA, ribosomal RNA; snRNA, small nuclear RNA; snoRNA, small nucleolar RNA; piRNA, Piwi-interacting RNA. ( I ) Venn diagram for overlapped miRNAs identified in ovarian cancer plasma cell exosomes. ( J ) Heatmap for unsupervised hierarchical clustering of GSE73582 dataset using plasma cell exosome-specific miRNA panel as classifiers. ( K ) Cellular programs enriched by GSEA for plasma cell exosome-specific miRNAs represented using Enrichment Map. ( L ) The univariate regression analyses of the identified top miRNAs associa
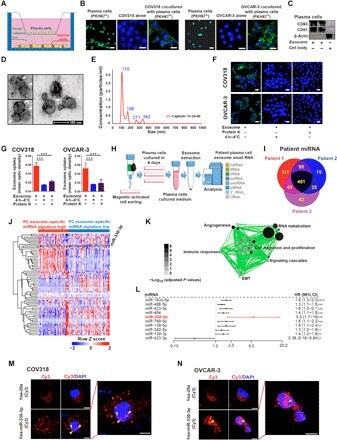
- Submitted by
- Invitrogen Antibodies (provider)
- Main image

- Experimental details
- Fig. 5 MAAP promotes association of AAV with EVs. A Schematic of EV isolation by iodixanol density gradient from HEK293 suspension culture. B Immunoblots of iodixanol fractions from suspension cells producing recombinant MAAP8Delta vector complemented in trans with CMV-HA and C CMV-MAAP8-HA. EVs, capsid and MAAP were analyzed from the media of HEK293 producing cells at day 3 post transfection. Capsid and MAAP proteins were analyzed by SDS-PAGE under reducing conditions while EV markers (CD81, CD63, CD9) were analyzed by SDS-PAGE under non-reducing conditions ( n = 2). D Graph displaying percent vector genome titer relative to total viral genomes for each fraction from iodixanol gradient purified MAAP8Delta vector complemented in trans with CMV-HA and CMV-MAAP8-HA. E Schematic of EV isolation by size exclusion chromatography (SEC) from HEK293 suspension culture. F Immunoblots of SEC fractions from suspension cells producing recombinant MAAP8Delta vector complemented in trans with CMV-HA and G CMV-MAAP8-HA. EVs and MAAP were analyzed from the media of HEK293 producing cells at day 3 post transfection. MAAP protein was analyzed by SDS-PAGE under reducing conditions while the EV marker CD63 was analyzed by SDS-PAGE under non-reducing conditions ( n = 2). H Graph displaying percent vector genome titer relative to total viral genomes for each fraction from SEC purified MAAP8Delta vector complemented in trans with CMV-HA and CMV-MAAP8-HA.

- Submitted by
- Invitrogen Antibodies (provider)
- Main image

- Experimental details
- Fig. 1 CD63-positive ferroptosis-dependent EVs (FedEVs) derived from macrophages simultaneously exposed to asbestos and iron in vivo and in vitro . (a) Histological images of peritoneal wall in situ in the murine model 6 months after ip injection of 3 mg crocidolite; hematoxylin and eosin (HE) image (left upper), Berlin blue staining (insoluble iron as bluish green, left lower), phase-contrast with red fluorescent image (right panels); cell-specific marker: MSLN (mesothelin), mesothelial cell; alphaSMA (smooth muscle actin), myofibroblast; CD68, macrophage; white arrowheads, crocidolite (bar = 100 mum). (b) High-resolution fluorescent image in granuloma; red, cell specific marker; green, CD63; blue, Hoechst33342 nuclear staining (bar = 20 mum). (c) Quantification of fluorescent intensity of CD63 in different cells surrounding granuloma (n = 30; mean +- SEM). (d) Schematic image of peritoneal wall surrounding the asbestos-induced granuloma. (e, g) Immunoblot analysis of CD63 in cells under ferroptosis and their media; HT1080 fibrosarcoma cells were exposed to RSL3 (10 muM, 24 h), and phorbol myristate acetate (PMA)-primed THP1 macrophage cells were exposed to crocidolite (15 mug/cm 2 ) in the presence of absence of ferric ammonium citrate (Fe, 100 mug/ml) up to 96 h. (f, h) Membrane-catch transmission electronmicroscopy (TEM) images of EVs on carbon grids (bar = 200 nm). (i-l) The precision of nanoparticle tracking analysis (NTA) concentration measurements counted size-distrib

- Submitted by
- Invitrogen Antibodies (provider)
- Main image

- Experimental details
- Fig. 2 Mesothelial cells phagocytose FedEVs derived from asbestos-exposed macrophages under ferroptosis. (a) Schema of culture system for the uptake by MeT-5A (recipient) cells of FedEVs from THP1 cells stably expressing GFP-CD63. (b) Fluorescent cellular images of recipient mesothelial cells phagocytosing GFP-positive FedEVs derived from THP1 macrophage cells exposed to asbestos; red, endogenous CD63; bar = 10 mum. (c) Time-course of quantitative colocalization ratio between GFP-CD63 and endogenous CD63 (mean +- SEM). (d, e) FACS analysis of MeT-5A mesothelial cells for catalytic Fe(II) (RhoNox-4, red) after exposure to GFP-CD63-labeled FedEVs derived from HT1080 by ferroptosis-stimulation with RSL3; mean +- SEM). (f, g) FACS analysis of MeT-5A mesothelial cells for catalytic Fe(II) (RhoNox-4, red) after exposure to GFP-CD63-labeled FedEVs derived from THP1 cells by ferroptosis-stimulation with [crocidolite + Fe]; mean +- SEM). (For interpretation of the references to color in this figure legend, the reader is referred to the Web version of this article.) Fig. 2

- Submitted by
- Invitrogen Antibodies (provider)
- Main image
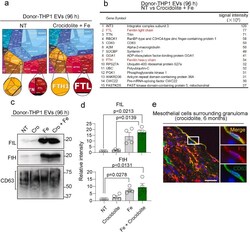
- Experimental details
- Fig. 3 Non-selective proteome analysis of asbestos-induced FedEVs reveals ferritins as major components. (a) Proteomaps depicting the fold changes and associated functions for all the identified proteins within FedEVs derived from THP1 macrophage cells (NT or crocidolite + Fe exposure). (b) Relative abundance of proteins in FedEVs (crocidolite + Fe) in comparison to EVs from untreated control THP1 cells. (c) Immunoblot analysis of FedEVs from THP1 macrophage. (d) Quantification of band intensity (n = 4; mean +- SEM). (e) Immunofluorescent analysis of peritoneal wall in situ in the murine model 6 months after ip injection of 3 mg crocidolite; CD63 (FedEVs, green); FtL (ferritin light chain, red) with blue Hoechst33342 nuclear staining (bar = 50 mum). (For interpretation of the references to color in this figure legend, the reader is referred to the Web version of this article.) Fig. 3

- Submitted by
- Invitrogen Antibodies (provider)
- Main image

- Experimental details
- Fig. 6 Phagocytosis of FedEVs causes oxidative DNA base modification (8-hydroxy-2'-deoxyguanosine, 8-OHdG) and DNA double-strand breaks detected by gammaH2AX in the recipient mesothelial cells. (a) Immunofluorescent images of mesothelial cells after exposure of THP1-derived FedEVs for 24 h; green, CD63-positive FedEVs from THP1 cells; yellow, 8-OHdG; magenda, gammaH2AX with blue Hoechst33342 nuclear staining (bar = 10 mum). (b-e) FACS analysis, detecting 8-OHdG and gammaH2AX in mesothelial cells exposed to FedEVs. (f) Immunofluorescent images of mesothelial cells surrounding granuloma in vivo 6 months after ip injection of crocidolite to mice; green, gammaH2AX; yellow, CD63; magenta, FtL (bar = 20 mum at the left panels; 20 mum at the right 3 panels). (g) Quantification of the gammaH2AX in mesothelial cells. Refer to text for details (mean +- SEM). (For interpretation of the references to color in this figure legend, the reader is referred to the Web version of this article.) Fig. 6

- Submitted by
- Invitrogen Antibodies (provider)
- Main image
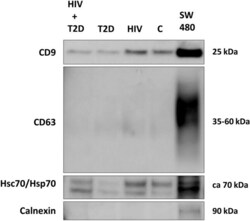
- Experimental details
- Figure 2 Western blot detection of CD9, Hsc70/Hsp70 and Calnexin in plasma pool EVs. As a positive control, lysate from the colorectal cancer cell line SW480 was used. Full-length blots are presented in Supplementary Fig. 3 (Supplementary Information).
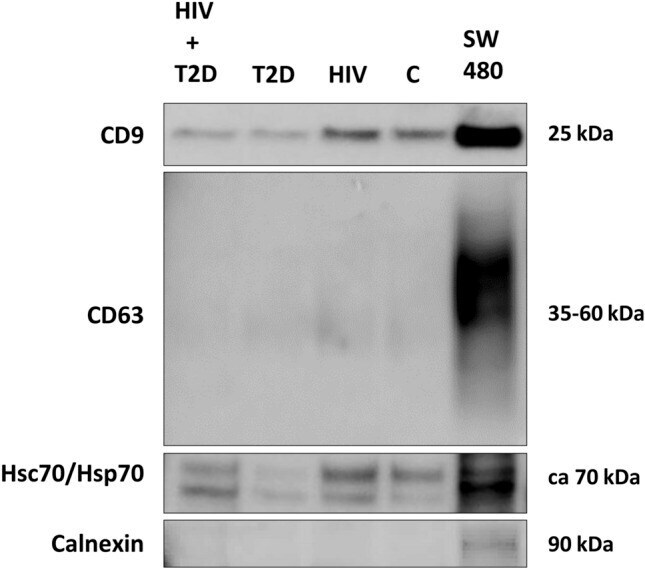
- Submitted by
- Invitrogen Antibodies (provider)
- Main image

- Experimental details
- Figure 2 Successful isolation and characterization of engineered EVs displaying peptides of interest. ( A ) Representative size distribution of the naive, RDG, and E626 display EVs determined by nanoparticle tracking analysis. The peak particle sizes were 106.2 nm, 98.2 nm, and 102.6 nm, respectively. ( B ) Western blot analysis of engineered EVs (RDG and E626 fusion peptide 55kDa) for the presence of EV biomarkers CD63 (30-60 kDa) and TSG101 (44 kDa), Alix (95 kDa), and peptide HA-tag. The analysis of cell lysate and engineered EVs for cellular biomarker calnexin (67KDa) is also shown. ( C ) Representative immuno-transmission electron microscopy images of naive, RDG, and E626 EVs showing gold-labeled HA on engineered EV (RDG and E626) surfaces and CD63 EV surface markers on all the EVs.

- Submitted by
- Invitrogen Antibodies (provider)
- Main image

- Experimental details
- Figure 1 Characterization of sEVs isolated from plasma of young (3-month-old) and old mice (24-month-old). sEVs were enriched by differential ultracentrifugation. ( A ) Nanoparticle-tracking analysis (NTA) of sEV fractions from young (blue line) and old (red line) mice blood plasma. The graph shows sEV concentration and size, mean +- SEM ( n = 3). ( B ) Protein equivalents measured by microBCA. ( C ) Cryo-TEM on purified sEVs. ( D ) Western blotting for sEV- and endothelial-associated markers. ** p < 0.01 from unpaired t -test with Welch's correction.
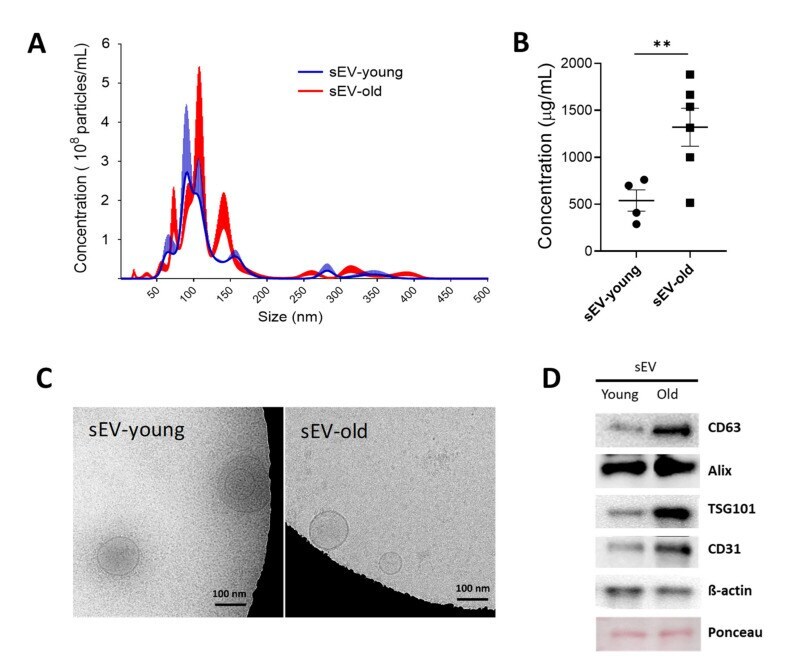
- Submitted by
- Invitrogen Antibodies (provider)
- Main image

- Experimental details
- 10.1371/journal.ppat.1010322.g004 Fig 4 Cytosolic entry of reovirus cores. (A) WT, KO, and KO+ HBMECs were adsorbed with Alexa 647 labeled-reovirus virions (cyan) at an MOI of 10,000 particles/cell at 37degC for 45 min and fixed with 4% PFA at 8 h post-adsorption. Cells were stained with DAPI (gray), a CD63-specific antibody to label endosomes (red), and an antiserum specific for reovirus cores (green), and imaged using confocal microscopy. Representative confocal micrographs are shown. Insets represent a merged image (far left), cores (center left), CD63 (center right), and virus (far right). (B) Colocalization of reovirus virions, cores, and endosomes was analyzed using the JaCoP plugin function from ImageJ. The results are presented as the mean colocalization (quantified by Manders coefficient) of ~ 50 cells from three independent experiments. Error bars indicate standard deviation. **, P < 0.01; ***, P < 0.001, as determined by two-tailed unpaired t-test.

- Submitted by
- Invitrogen Antibodies (provider)
- Main image

- Experimental details
- MuVs and lmEVs present different markers and have different buoyant properties. ( A ) histograms showing the MuV and lmEV particle-size distributions (representative sample, from ALS EVs). ( B ) Representative Western blots showing the detection of CD63, CD81, CD82, AnnexinA1, ARF6, and actin, in MuVs (line1), lmEVs (line 2) and cells (line 3). Exosomal markers were enriched in MuVs and at relatively low or undetectable levels in lmEVs (EVs were extracted from the same cell culture medium for both exosomal and microparticle markers). Protein loaded on the gel is also shown, as loading control. Cellular contamination was not observed as neither of the vesicle fractions were positive for alpha-skeletal actin. ( C ) Vesicle extracts loaded on iodixanol gradients. MuVs presented classic exosomal buoyant properties while the buoyant range of lmEVs extended to a higher iodixanol density. Top panel: representative Western blot showing detection of CD63 for the MuVs at a density of 1.112 g*mL -1 ; bottom panel: representative Western blot (EVs extracted from the same cell culture medium as top panel) showing detection of Annexin A1 and ARF6 for the lmEVs at a density of 1.086-1.112 g*mL -1 and 1.185-1.230 g*mL -1 . Right panel: iodixanol/sucrose density across the 12 fractions; gradient range from 1.048 to 1.263 g*mL -1 . ( D ) Protein concentration in MuVs samples. Protein quantification was below detection sensitivity for lmEVs (ND: not detected). ( E ) Lipid quantification in MuVs

- Submitted by
- Invitrogen Antibodies (provider)
- Main image

- Experimental details
- Characterization of human oligodendroglia-derived extracellular vesicles. A Western blotting analysis of small extracellular vesicle protein markers CD63, CD9, Flotillin-1, Annexin A2, HSP70, and the negative control marker GRP94. B Representative overview (scale bar 200 nm) and cropped (scale bar 100 nm) image showing the morphology, as revealed by transmission electron microscopy, of EVs isolated from wild-type native human oligodendroglia (OL-EVs) and stably expressing HSPB8 oligodendroglia (OL-HSPB8-EV). C - E Particle size profile distribution, particles per mL, and total EV protein measured by Nanoparticle Tracking Analysis (NTA) and BCA of OL-EVs and OL-HSPB8-EVs, pelleted from 30 mL of conditioned medium. F - H Western blotting and qPCR analysis of HSPB8 present in OL-EVs and OL-HSPB8-EVs. Statistical analysis was performed using GraphPad. Student's t-test was used to determine significance (** P < 0.01, **** P < 0.0001). Data are presented as mean +- SEM

- Submitted by
- Invitrogen Antibodies (provider)
- Main image

- Experimental details
- 10.1371/journal.pone.0272511.g002 Fig 2 Exosome characterization. (A) Immunocytochemical detection of CD9 as an exosomal marker on GFP-packed exosome. Imaged with Fluorescence microscope at 400X total magnification. (B) Dot blot analysis of isolated exosomes for CD9 and CD63 as exosome markers. Detection of Tom40 signal for Tom40-exosome. PBS as a negative control. (C) The significant presence of Tom40 protein in isolated Tom40-exosome was shown in Western blot analysis. (D) Graphical representation of Tom40 signal normalized by CD9. Student t-test was performed *P

- Submitted by
- Invitrogen Antibodies (provider)
- Main image

- Experimental details
- Characterization of the purified exosomes from hiPSC-EC and HCMEC conditioned media. Exosomes isolated from cell culture media of hiPSC-ECs and HCMECs. ( A ) Western blot showed the detection of exosome markers CD9, CD63, and CD81 in isolated exosomes. ( B ) Glucose-regulated protein 94 (GRP94) and Golgi marker GM130 were not found in exosomes. ( C ) Flow cytometry analysis using exosome marker CD9. ( D ) The size distribution of isolated exosomes was measured by nanoparticle tracking analysis (NTA) in hiPSC-ECs and HCMECs.

- Submitted by
- Invitrogen Antibodies (provider)
- Main image

- Experimental details
- Characterization of EVs released by SW620, CD9-GFP + SW620, and SW480 cells. ( A - E ) EVs were recovered from the conditioned media of SW620, CD9-GFP + SW620, and SW480 cells by differential centrifugation, and the resulting 200,000x g pellets were analyzed by the ZetaView particle analyzer ( A ), immunoblotting ( B , C ), and dSTORM ( D , E ). The concentration and size of EVs derived from the indicated cells are shown ( A ). Note the presence of a common population of small particles ( 5000 EVs per experiment). Note that small and large EVs derived from SW480 cells were also quantified ( Supplementary Figure S2 ). Scale bars, 50 nm.

- Submitted by
- Invitrogen Antibodies (provider)
- Main image

- Experimental details
- Figure 1 CSSC cells secrete extracellular vesicles (EVs). (A): Negative staining transmission electron microscopy of a high-speed pellet from conditioned media of cultured CSSC cells shows abundant vesicles with a range of diameters from 16 to 180 nm having a median of 28 nm. (B): Size distribution of extracellular vesicles isolated from CSSC conditioned media was examined using resistive pulse sensing as described in the ""Materials and Methods"" section. (C): CD63-bead cytometry was used to identify surface antigens present on the EVs isolated from CSSC. (D): Western blotting of 10 mug protein from purified EVs from three CSSC cell lines (C1, C2, C3) and from HEK293T cells (HEK). Antibodies to calnexin (CNX) and CD63 were used on the same samples.

- Submitted by
- Invitrogen Antibodies (provider)
- Main image

- Experimental details
- Figure 2 Extracellular vescile (EV) characterization. ( A ) Nanoparticle tracking analysis (NTA) showing a peak between 100-200 nm for the control (CT), luminal A (LA), and triple negative (TNBC) groups. ( B ) Transmission electron microscopy (TEM) image of EVs from cancer patient showing a size corresponding to NTA results. Size bar = 200 nm. ( C ) Western blotting (WB) analysis showing strong protein expression of CD9 and CD63 on EVs from control (2) and cancer (4), when compared with corresponding serum supernatant EV-depleted from control (1) and cancer (3).
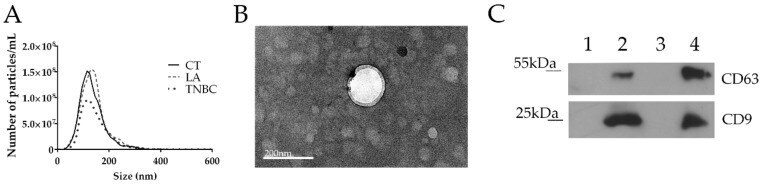
- Submitted by
- Invitrogen Antibodies (provider)
- Main image

- Experimental details
- Figure 3 Identification of S1P 2 in exosomes shed from MDA-MB-231 breast cancer cells (A) Western blot with anti-GFP or anti-mCherry antibodies showing the over-expression of GFP-hsp70 and mCherry-tgs101 in vector (V) or plasmid transfected MDA-MB-231 cells for 24 or 48 h. (B) Western blot with anti-GFP or anti-mCherry or anti-HA antibodies showing the presence of GFP-hsp70, mCherry-tsg101 or HA tagged S1P 2 (Mr = 40 kDa) in transfected MDA-MB-231 cell lysate (CL) and acid precipitates (PPT) of CM. (C) Western blot with anti-hsp70, anti-CD63 and anti-S1P 2 antibodies showing the presence of GFP-hsp70, CD63 or S1P 2 in MDA-MB-231 cell lysates (CL) and isolated exosomes (EXO) from CM. (D) Immunofluorescence image of MDA-MB-231 cells stained with anti-CD63/TRITC (red) secondary and anti-S1P 2 /FITC (green) secondary antibodies showing co-localisation (yellow) of CD63 and S1P 2 in large vesicles typical of MVBs. (E) Electron micrograph of immunogold staining with anti-CD63 [attached to secondary goat anti-mouse IgG-immune-gold particles (15 nm)] and anti-S1P 2 antibodies [attached to secondary goat anti-rabbit IgG-immune-gold particles (10 nm)] in exosomes isolated from CM of MDA-MB-231 cells. Control represents exosomes that have not been incubated with primary antibody. Results are representative of 3 independent experiments.

- Submitted by
- Invitrogen Antibodies (provider)
- Main image

- Experimental details
- Fig. 2 EV biogenesis is impaired in C9-ALS iAstrocytes. Representative size distribution graph (a) of ADEVs and TEM (b, c-i, c-ii) show that most ADEVs range between 50 and 120 nm. ADEVs are positive for CD63 (arrow heads) with immunogold labeling (c-iii). ADEV direct quantification using the ZetaView Nanoparticle Tracking System (d) shows a significant decrease in the number of particles secreted by C9 iAstrocytes (One-way ANOVA; p < .01). This suggests impairment in vesicle formation, as supported by TaqMan qRT-PCR data showing downregulation in a number of transcripts involved in EV biogenesis in C9 iAstrocytes (e). t -test (**p < .01; *** p < .001), 3xControls versus 3xC9-ALS, N = 3 per condition, error bar = SD. Fig. 2
