 Explore
 Validate
 Learn
Learn Flow cytometry
Antibody data
- Antibody Data
- Antigen structure
- References [7]
- Comments [0]
- Validations
- Flow cytometry [1]
- Other assay [9]
Submit
Validation data
Reference
Comment
Report error
- Product number
- 50-0639-42 - Provider product page

- Provider
- Invitrogen Antibodies
- Product name
- CD63 Monoclonal Antibody (H5C6), eFluor™ 660, eBioscience™
- Antibody type
- Monoclonal
- Antigen
- Other
- Description
- Description: This H5C6 monoclonal antibody reacts with human CD63, a type III member of the tetraspanin family of transmembrane proteins. CD63 is expressed intracellularly on lysosomes, endosomes, and granules of resting platelets and basophils. However, cell surface expression of CD63 can be detected on activated basophils and platelets, monocytes, macrophages, and granulocytes. This receptor is also expressed on endothelial cells, fibroblasts, and smooth muscle cells. Studies have demonstrated that CD63 associates with integrins (VLA-3 and VLA-6) and TIMP-1 to mediate the allergic response. Applications Reported: This H5C6 antibody has been reported for use in flow cytometric analysis. Applications Tested: This H5C6 antibody has been pre-titrated and tested by flow cytometric analysis of normal human peripheral blood cells. This can be used at 5 µL (0.5 µg) per test. A test is defined as the amount (µg) of antibody that will stain a cell sample in a final volume of 100 µL. Cell number should be determined empirically but can range from 10^5 to 10^8 cells/test. eFluor® 660 is a replacement for Alexa Fluor® 647. eFluor® 660 emits at 659 nm and is excited with the red laser (633 nm). Please make sure that your instrument is capable of detecting this fluorochome. Excitation: 633-647 nm; Emission: 668 nm; Laser: Red Laser. Filtration: 0.2 µm post-manufacturing filtered.
- Reactivity
- Human
- Host
- Mouse
- Isotype
- IgG
- Antibody clone number
- H5C6
- Vial size
- 100 Tests
- Concentration
- 5 µL/Test
- Storage
- 4° C, store in dark, DO NOT FREEZE!
Submitted references Excess fatty acids induce pancreatic acinar cell pyroptosis through macrophage M1 polarization.
M2-like tumor-associated macrophages transmit exosomal miR-27b-3p and maintain glioblastoma stem-like cell properties.
Ionizing Radiation Increases the Activity of Exosomal Secretory Pathway in MCF-7 Human Breast Cancer Cells: A Possible Way to Communicate Resistance against Radiotherapy.
Urinary exosomes as a novel biomarker for evaluation of α-lipoic acid's protective effect in early diabetic nephropathy.
MicroRNA-containing extracellular vesicles released from endothelial colony-forming cells modulate angiogenesis during ischaemic retinopathy.
Microvesicles derived from human umbilical cord Wharton's jelly mesenchymal stem cells attenuate bladder tumor cell growth in vitro and in vivo.
Identification of CD63 as a tissue inhibitor of metalloproteinase-1 interacting cell surface protein.
Xia W, Lu Z, Chen W, Zhou J, Zhao Y
BMC gastroenterology 2022 Feb 19;22(1):72
BMC gastroenterology 2022 Feb 19;22(1):72
M2-like tumor-associated macrophages transmit exosomal miR-27b-3p and maintain glioblastoma stem-like cell properties.
Zhao G, Ding L, Yu H, Wang W, Wang H, Hu Y, Qin L, Deng G, Xie B, Li G, Qi L
Cell death discovery 2022 Aug 4;8(1):350
Cell death discovery 2022 Aug 4;8(1):350
Ionizing Radiation Increases the Activity of Exosomal Secretory Pathway in MCF-7 Human Breast Cancer Cells: A Possible Way to Communicate Resistance against Radiotherapy.
Jabbari N, Nawaz M, Rezaie J
International journal of molecular sciences 2019 Jul 25;20(15)
International journal of molecular sciences 2019 Jul 25;20(15)
Urinary exosomes as a novel biomarker for evaluation of α-lipoic acid's protective effect in early diabetic nephropathy.
Sun H, Yao W, Tang Y, Zhuang W, Wu D, Huang S, Sheng H
Journal of clinical laboratory analysis 2017 Nov;31(6)
Journal of clinical laboratory analysis 2017 Nov;31(6)
MicroRNA-containing extracellular vesicles released from endothelial colony-forming cells modulate angiogenesis during ischaemic retinopathy.
Dellett M, Brown ED, Guduric-Fuchs J, O'Connor A, Stitt AW, Medina RJ, Simpson DA
Journal of cellular and molecular medicine 2017 Dec;21(12):3405-3419
Journal of cellular and molecular medicine 2017 Dec;21(12):3405-3419
Microvesicles derived from human umbilical cord Wharton's jelly mesenchymal stem cells attenuate bladder tumor cell growth in vitro and in vivo.
Wu S, Ju GQ, Du T, Zhu YJ, Liu GH
PloS one 2013;8(4):e61366
PloS one 2013;8(4):e61366
Identification of CD63 as a tissue inhibitor of metalloproteinase-1 interacting cell surface protein.
Jung KK, Liu XW, Chirco R, Fridman R, Kim HR
The EMBO journal 2006 Sep 6;25(17):3934-42
The EMBO journal 2006 Sep 6;25(17):3934-42
No comments: Submit comment
Supportive validation
- Submitted by
- Invitrogen Antibodies (provider)
- Main image

- Experimental details
- Staining of CD3-IgE+CCR3+ cells from normal human peripheral blood cells with Mouse IgG1 K Isotype Control eFluor® 660 (Product # 50-4714-82) (blue) or Anti-Human CD63 eFluor® 660 (purple) (right). Cells in the CD3-IgE+CCR3+ gate were used for analysis (left).

Supportive validation
- Submitted by
- Invitrogen Antibodies (provider)
- Main image
- Experimental details
- NULL
- Submitted by
- Invitrogen Antibodies (provider)
- Main image
- Experimental details
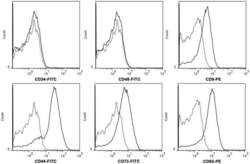
- Figure 2 hWJMSC-MVs surface expressed molecules analysis. Flow cytometery analysis showed hWJMSC-MVs were positive for some surface expressed molecules typically expressed by MSCs, such as CD9, CD44, CD63, CD73, and negative for CD34, CD45.

- Submitted by
- Invitrogen Antibodies (provider)
- Main image
- Experimental details
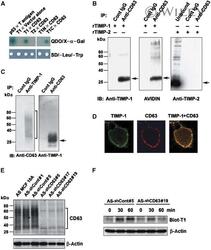
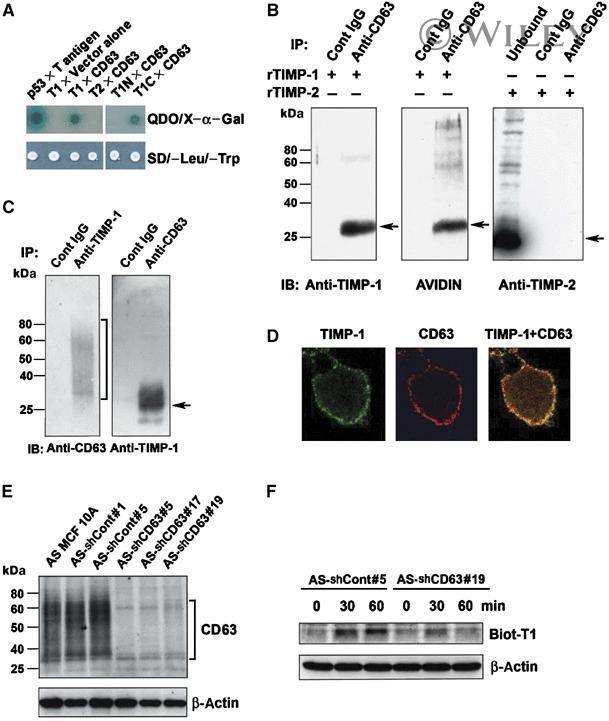
- TIMP-1-specific interaction with CD63. ( A ) Yeast AH109 expressing p53 bait (as a positive control), full-length TIMP-1 (amino acids 1-184) lacking signal peptide (T1), full-length TIMP-2 (T2), N-terminal domain (amino acids 1-125) of TIMP-1 (T1N), or C-terminal domain (amino acids 126-184) of TIMP-1 (T1C) was mated with Y187 expressing large T antigen prey (as a positive control), vector alone (as a negative control), or full-length CD63. Diploids grow on SD/-Leu/-Trp selective media. The specific interaction between bait and prey proteins was detected on quadruple dropout (QDO) media SD/-Leu/-Trp/-His/-Ade containing X-alpha-Gal. ( B ) Anti-CD63 immunoprecipitates of MCF10A cell lysates in the presence of 500 ng/ml biotinylated rTIMP-1 (left and middle panel) or rTIMP-2 (right panel) were analyzed by Western blot analysis with anti-TIMP-1 monoclonal antibody, avidin-HRP, and anti-TIMP-2 polyclonal antibody. ( C ) TIMP-1 overexpressing MCF10A (T29) cell lysates were immunoprecipitated with anti-TIMP-1 polyclonal antibody or anti-CD63 monoclonal antibody, followed by immunoblot analysis using anti-CD63 under nonreducing condition or anti-TIMP-1 antibody under reducing condition, respectively. ( D ) MCF10A cells were grown on the coverslips overnight, blocked with PBS containing 10% horse serum 1% BSA, and co-stained with anti-CD63 Ab/Texas red conjugated secondary Ab (red staining), or with anti-TIMP-1 Ab/FITC conjugated secondary Ab (green staining). Co-localization of TIMP
- Submitted by
- Invitrogen Antibodies (provider)
- Main image
- Experimental details
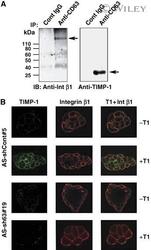
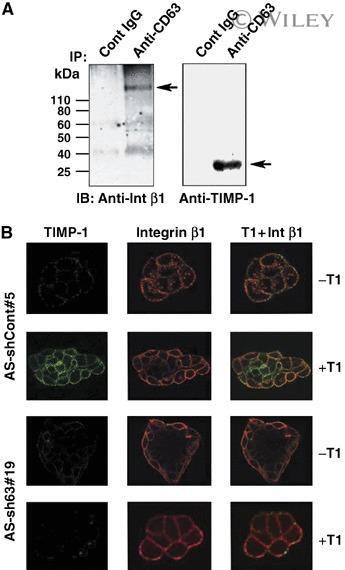
- CD63 mediates TIMP-1 binding to cell surface and TIMP-1 co-localization with integrin beta1 in human breast epithelial cells. ( A ) MCF10A cell lysates were immunoprecipitated with anti-CD63 antibody, followed by immunoblotting with anti-integrin beta1 or anti-TIMP-1 monoclonal antibody. ( B ) AS-shCont#5 and AS-shCD63#19 cells were cultured on the coverslips overnight and incubated with or without 500 ng/ml TIMP-1 for 30 min. Live cells were co-stained with anti-integrin beta1 Ab/Texas red conjugated secondary Ab (red staining) and anti-TIMP-1 Ab/FITC conjugated secondary Ab (green staining). Colocalization of TIMP-1 and integrin beta1 is shown as yellow staining.
- Submitted by
- Invitrogen Antibodies (provider)
- Main image

- Experimental details
- Downregulation of CD63 expression reverses TIMP-1mediated antiapoptotic activity. ( A ) T29-shCont-P and T29-shCD63-P cells were subjected to immunoblot analysis with an anti-CD63 antibody in a nonreducing condition. The bottom panel shows the beta-actin levels of the same blot reprobed with an anti-human beta-actin antibody. ( B ) Conditioned medium and cell lysates of T29-shCont-P and T29-shCD63-P cells were subjected to immunoblot analysis with an anti-TIMP-1 antibody. The bottom panel shows the beta-actin levels of the same blot reprobed with an anti-human beta-actin antibody. Densitometry analysis of the signals between cellular TIMP-1 and beta-actin was presented by normalizing to the signal ratio in T29-ShCont-P cells. ( C ) Cell lysates (40 mug/lane) of 48 h serum-starved MCF10Aneo (Neo), T29, T29-shCont-P, and T29-shCD63-P cells were subjected to immunoblot analysis with anti-active ERKs (pERK1/2) and anti-ERK1/2 antibodies. Densitometry analysis of the signals between pERK1/2 and ERK1/2 were presented by normalizing to the signal ratio in T29 (left panel) or T29-shCont-P cells (right panel). ( D ) Cell lysates (40 mug/lane) of 48 h serum-starved Neo, T29, T29-shCont-P, and T29-shCD63-P cells were subjected to immunoblot analysis with anti-FAK (pY397) and anti-FAK antibodies. Densitometry analysis of the signals between anti-FAK (pY397) and anti-FAK were presented by normalizing to the signal ratio in T29 (left panel) or T29-shCont-P cells (right panel). ( E ) MCF10A

- Submitted by
- Invitrogen Antibodies (provider)
- Main image
- Experimental details
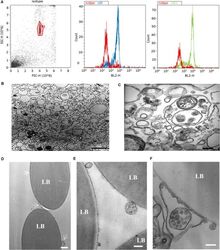
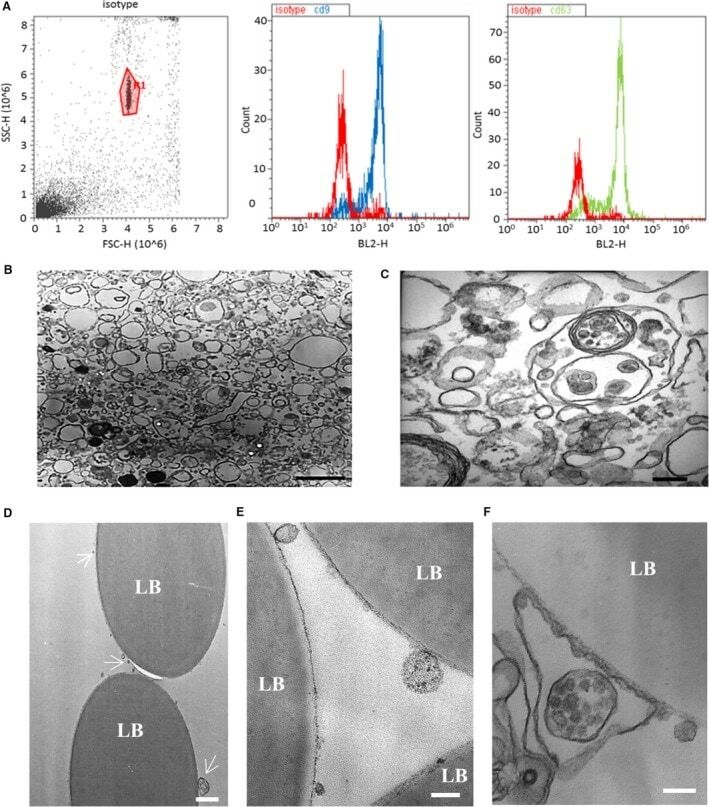
- Figure 1 Characterization of endothelial colony-forming cells (ECFC)-derived extracellular vesicles (EVs). ( A ) Isolated ECFC-derived EVs were conjugated to CD63-coated latex beads to aid detection by flow cytometry. The gated bead-bound population (left panel) tested positive for EV markers CD9 and CD63. ( B ) Electron micrograph demonstrating the heterogeneity of the EV population (scale bar 1 mum). ( C ) Higher-magnification electron micrograph showing EVs of variable sizes and including a multivesicular body (scale bar 200 nm). ( D-F ) Electron micrographs of EVs bound to latex beads (LB) coated with anti-CD63 antibody. ( D ) White arrows indicate CD63-positive EVs of varying sizes (scale bar 1 mum). ( E ) Higher-magnification micrograph of EVs (scale bar 200 nm). In ( F ), a multivesicular body appears to be encapsulated within a CD63-positive membrane (scale bar 200 nm).
- Submitted by
- Invitrogen Antibodies (provider)
- Main image
- Experimental details
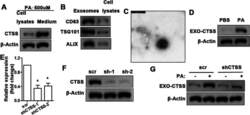
- Fig. 3 CTSS is produced in macrophage and transported by exosomes. Western blot analysis of CTSS in macrophage cell lysates and medium after PA (500 muM) stimulation for 24 h ( A ). Western blot analysis of exosome-specific proteins in exosomes and cell lysates detected 24 h after palmitic acid (PA, 500 muM) stimulation of macrophage ( B ). Electron microscopy of exosomes ( C ). (Scale bars = 500 nm) Exosome-derived CTSS from PA (500 muM) stimulated macrophage ( D ). QRT-PCR ( E ) and western blot ( F ) analysis of CTSS gene knockdown efficiency in macrophage. Data are shown as the mean +- SEM, n = 3, ANOVA. * P < 0.05. Detection of CTSS in exosomes from PA (500 muM) stimulated macrophage; macrophage were transfected with shCTSS, scr transfection as the control ( G )

- Submitted by
- Invitrogen Antibodies (provider)
- Main image
- Experimental details
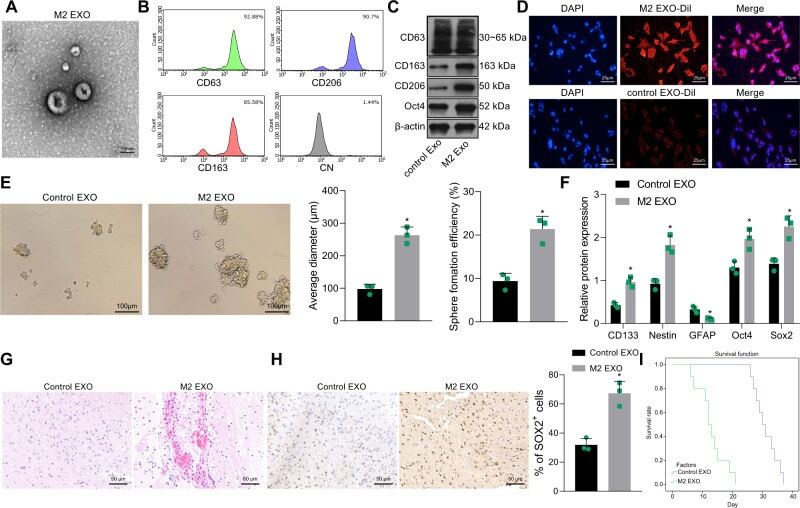
- Fig. 2 M2-TAM-derived exosomes enhance the stemness of GSCs. A TEM images of M2-TAM-derived exosomes. The presence of CD63, CD206, and CD163 in M2-TAM-derived exosomes analyzed by flow cytometric ( B ) and Western blot ( C ) analyses. D Fluorescence images of GSCs co-cultured with Dil-labeled M2-TAM-derived exosomes with nuclei stained with DAPI (blue). E Representative images showing neurosphere formation of GSCs along with the statistics of GSC formation rate and diameter of spheres. F Expression of stem cell-related protein CD133, Nestin, Oct4, Sox2, and GFAP in GSCs measured by Western blot analysis. G HE staining images of xenograft tumors from mice. H The representative immunohistochemical images of Sox2 in xenograft tumors and the percentage of GSCs labeled by Sox2. I Kaplan-Meier survive curve of tumor-bearing mice. n = 10. * p < 0.05 vs. the control EXO group. Measurement data were depicted as mean +- standard deviation, comparison of that between two groups was conducted by unpaired t test. Cell experiments were repeated three times independently.
- Submitted by
- Invitrogen Antibodies (provider)
- Main image
- Experimental details
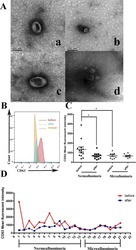
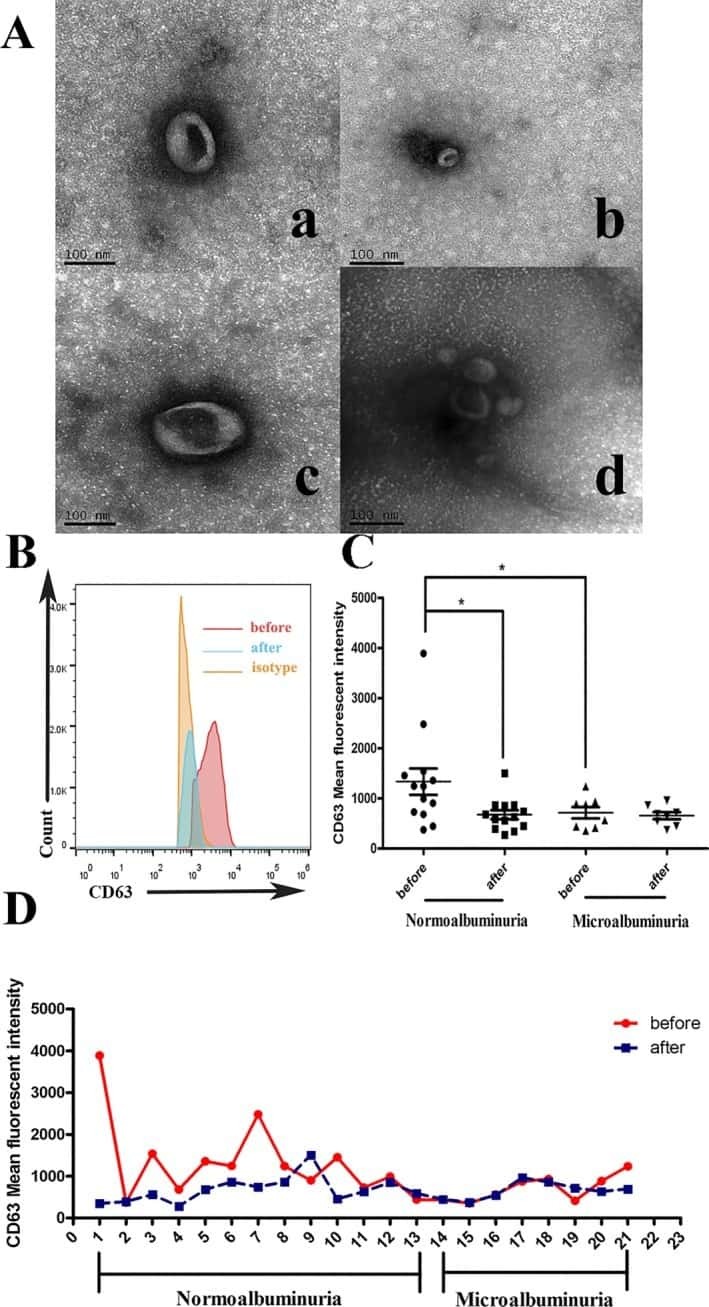
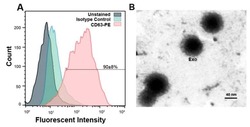
- Figure 5 ( A ) Flow cytometric data confirmed exosomes by identifying exosomal marker CD63 and 90 +- 8% of exosomes in suspension represented CD63 marker. ( B ) Representative micrograph from transmission electron microscopy showing the nano-sized exosomes (Scale bar 40 nm). Exo: exosomes.
