Explore
 Validate
 Learn
Learn Immunocytochemistry
 Immunoprecipitation
Antibody data
- Antibody Data
- Antigen structure
- References [6]
- Comments [0]
- Validations
- Immunocytochemistry [11]
- Immunohistochemistry [1]
- Flow cytometry [2]
- Other assay [4]
Submit
Validation data
Reference
Comment
Report error
- Product number
- MA1-19281 - Provider product page

- Provider
- Invitrogen Antibodies
- Product name
- CD63 Monoclonal Antibody (MEM-259)
- Antibody type
- Monoclonal
- Antigen
- Other
- Description
- This antibody reacts with an extracellular/luminal epitope of CD63 (LAMP-3), a 40-60 kDa tetraspan glycoprotein expressed by granulocytes, platelets, T cells, monocytes/macrophages and endothelial cells. Cell surface exposition of CD63 is usually activation-dependent.
- Reactivity
- Human
- Host
- Mouse
- Isotype
- IgG
- Antibody clone number
- MEM-259
- Vial size
- 100 μg
- Concentration
- 1 mg/mL
- Storage
- 4°C, do not freeze
Submitted references Characterization of plasma exosomal microRNAs in responding to radiotherapy of human esophageal squamous cell carcinoma.
Infarct-preconditioning exosomes of umbilical cord mesenchymal stem cells promoted vascular remodeling and neurological recovery after stroke in rats.
The LRRK2 G2019S mutation alters astrocyte-to-neuron communication via extracellular vesicles and induces neuron atrophy in a human iPSC-derived model of Parkinson's disease.
RASSF1C oncogene elicits amoeboid invasion, cancer stemness, and extracellular vesicle release via a SRC/Rho axis.
Assessment of TSPAN Expression Profile and Their Role in the VSCC Prognosis.
Changes in Sphingolipid Profile of Benzo[a]pyrene-Transformed Human Bronchial Epithelial Cells Are Reflected in the Altered Composition of Sphingolipids in Their Exosomes.
Miao N, Cai W, Ding S, Liu Y, Chen W, Sun T
Molecular medicine reports 2022 Sep;26(3)
Molecular medicine reports 2022 Sep;26(3)
Infarct-preconditioning exosomes of umbilical cord mesenchymal stem cells promoted vascular remodeling and neurological recovery after stroke in rats.
Ye YC, Chang ZH, Wang P, Wang YW, Liang J, Chen C, Wang JJ, Sun HT, Wang Y, Li XH
Stem cell research & therapy 2022 Jul 28;13(1):378
Stem cell research & therapy 2022 Jul 28;13(1):378
The LRRK2 G2019S mutation alters astrocyte-to-neuron communication via extracellular vesicles and induces neuron atrophy in a human iPSC-derived model of Parkinson's disease.
de Rus Jacquet A, Tancredi JL, Lemire AL, DeSantis MC, Li WP, O'Shea EK
eLife 2021 Sep 30;10
eLife 2021 Sep 30;10
RASSF1C oncogene elicits amoeboid invasion, cancer stemness, and extracellular vesicle release via a SRC/Rho axis.
Tognoli ML, Vlahov N, Steenbeek S, Grawenda AM, Eyres M, Cano-Rodriguez D, Scrace S, Kartsonaki C, von Kriegsheim A, Willms E, Wood MJ, Rots MG, van Rheenen J, O'Neill E, Pankova D
The EMBO journal 2021 Oct 18;40(20):e107680
The EMBO journal 2021 Oct 18;40(20):e107680
Assessment of TSPAN Expression Profile and Their Role in the VSCC Prognosis.
Ferreira KP, de Almeida BC, Dos Anjos LG, Baiocchi G, Soares FA, Rocha RM, Baracat EC, Dobroff AS, Carvalho KC
International journal of molecular sciences 2021 May 9;22(9)
International journal of molecular sciences 2021 May 9;22(9)
Changes in Sphingolipid Profile of Benzo[a]pyrene-Transformed Human Bronchial Epithelial Cells Are Reflected in the Altered Composition of Sphingolipids in Their Exosomes.
Machala M, Slavík J, Kováč O, Procházková J, Pěnčíková K, Pařenicová M, Straková N, Kotouček J, Kulich P, Mollerup S, Vondráček J, Hýžďalová M
International journal of molecular sciences 2021 Aug 25;22(17)
International journal of molecular sciences 2021 Aug 25;22(17)
No comments: Submit comment
Supportive validation
- Submitted by
- Invitrogen Antibodies (provider)
- Main image
- Experimental details
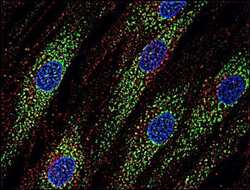
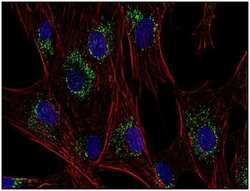
- Immunofluorescent staining of CD63 in human skin fibroblasts using anti-CD63 monoclonal antibody (Product # MA1-19281, green) after co-incubation of living cells with human Transferrin-Dyomics 547 (red). Nuclei were stained with DAPI (blue).
- Submitted by
- Invitrogen Antibodies (provider)
- Main image
- Experimental details
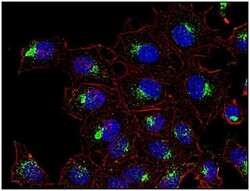
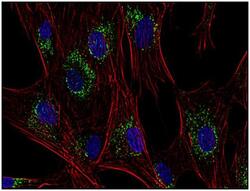
- Immunofluorescent staining of CD63 in HeLa cells using anti-CD63 (Product # MA1-19281; green). Actin cytoskeleton staining was performed using a phalloidin (red) and cell nuclei were stained with DAPI (blue).

- Submitted by
- Invitrogen Antibodies (provider)
- Main image
- Experimental details
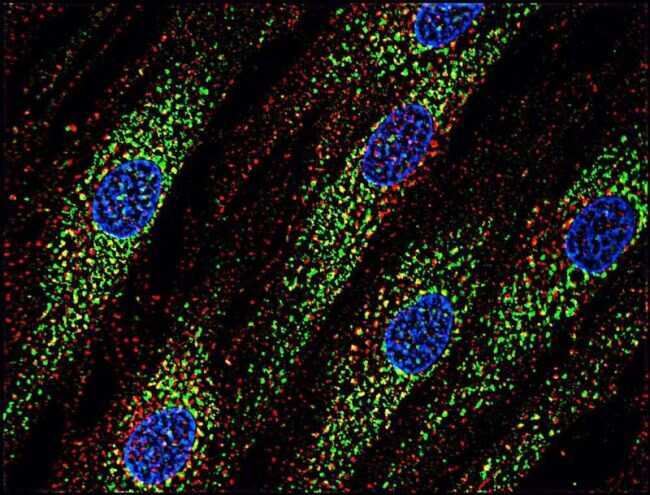
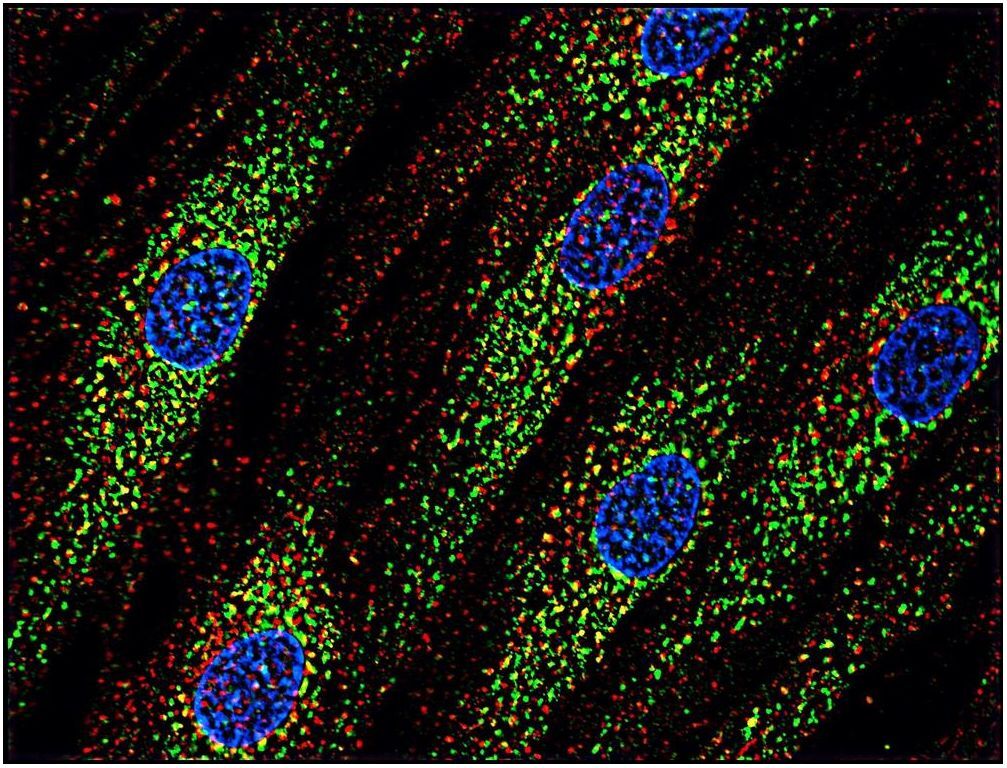
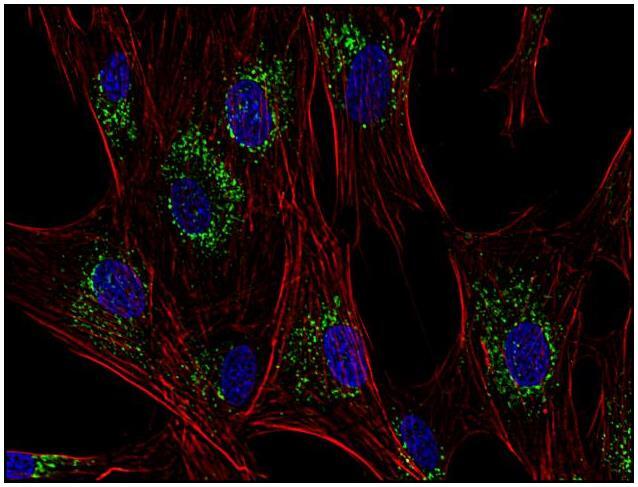
- Immunofluorescent staining of CD63 in human primary fibroblasts using anti-CD63 (Product # MA1-19281; green). Actin cytoskeleton staining was performed using a phalloidin (red) and cell nuclei were stained with DAPI (blue).

- Submitted by
- Invitrogen Antibodies (provider)
- Main image

- Experimental details
- Immunocytochemistry staining of human skin fibroblasts with anti-CD63 (MEM-259; green) Monoclonal antibody (Product # MA1-19281) after co-incubation of living cells with human Transferrin - Dyomics 547 (red); cell nuclei stained with DAPI (blue).
- Submitted by
- Invitrogen Antibodies (provider)
- Main image

- Experimental details
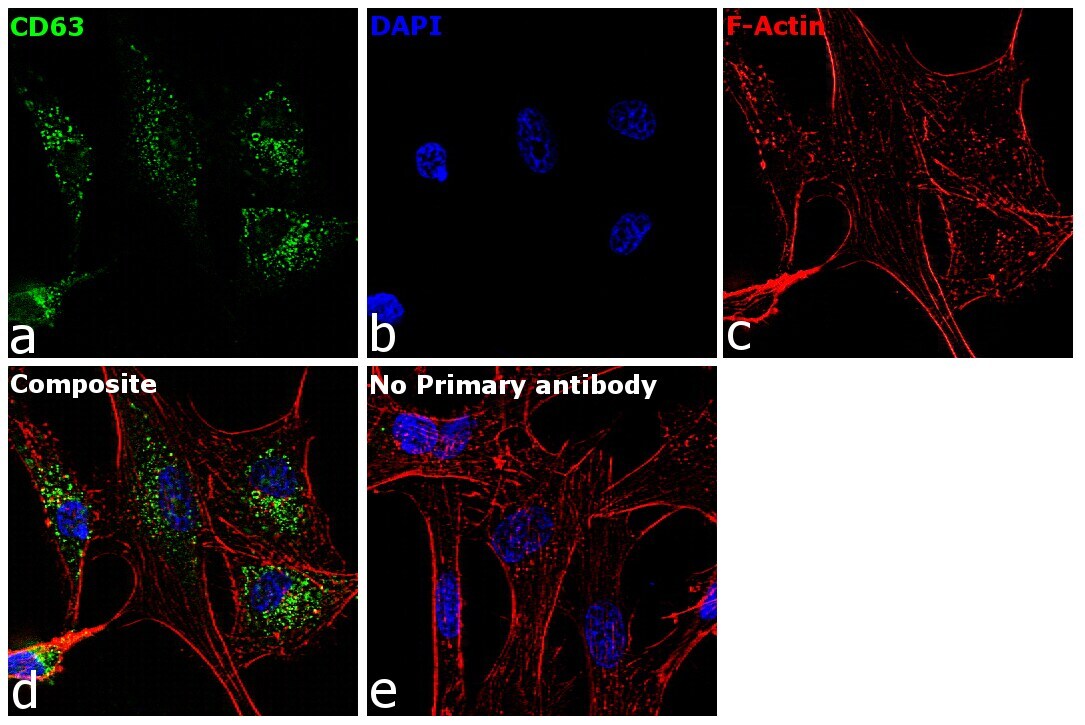
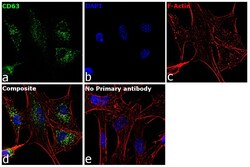
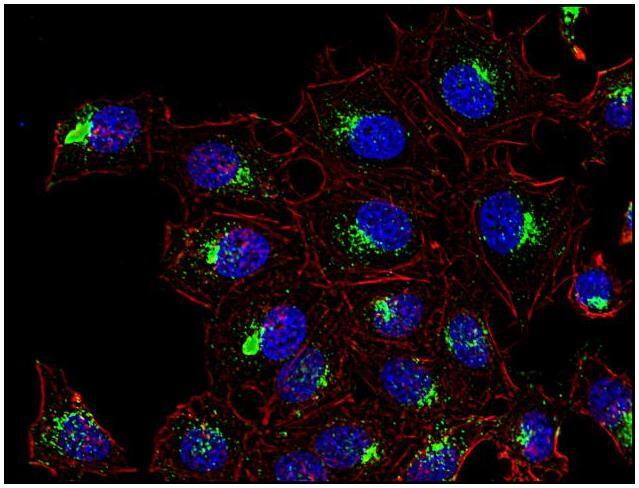
- Immunofluorescence analysis of CD63 was performed using 70% confluent log phase U-87 MG cells. The cells were fixed with 4% paraformaldehyde for 10 minutes, permeabilized with 0.1% Triton™ X-100 for 15 minutes, and blocked with 2% BSA for 1 hour at room temperature. The cells were labeled with CD63 Mouse Monoclonal Antibody (MEM-259) (Product # MA1-19281) at 5 µg/mL in 0.1% BSA, incubated at 4 degree celsius overnight and then with Goat anti-Mouse IgG (H+L) Superclonal™ Recombinant Secondary Antibody, Alexa Fluor® 488 conjugate (Product # A28175) at a dilution of 1:2000 for 45 minutes at room temperature (Panel a: green). Nuclei (Panel b: blue) were stained with ProLong™ Diamond Antifade Mountant with DAPI (Product # P36962). F-actin (Panel c: red) was stained with Rhodamine Phalloidin (Product # R415, 1:300). Panel d represents the merged image showing cytoplasmic (Lysosomal pattern) localization. Panel e represents control cells with no primary antibody to assess background. The images were captured at 60X magnification.
- Submitted by
- Invitrogen Antibodies (provider)
- Main image

- Experimental details
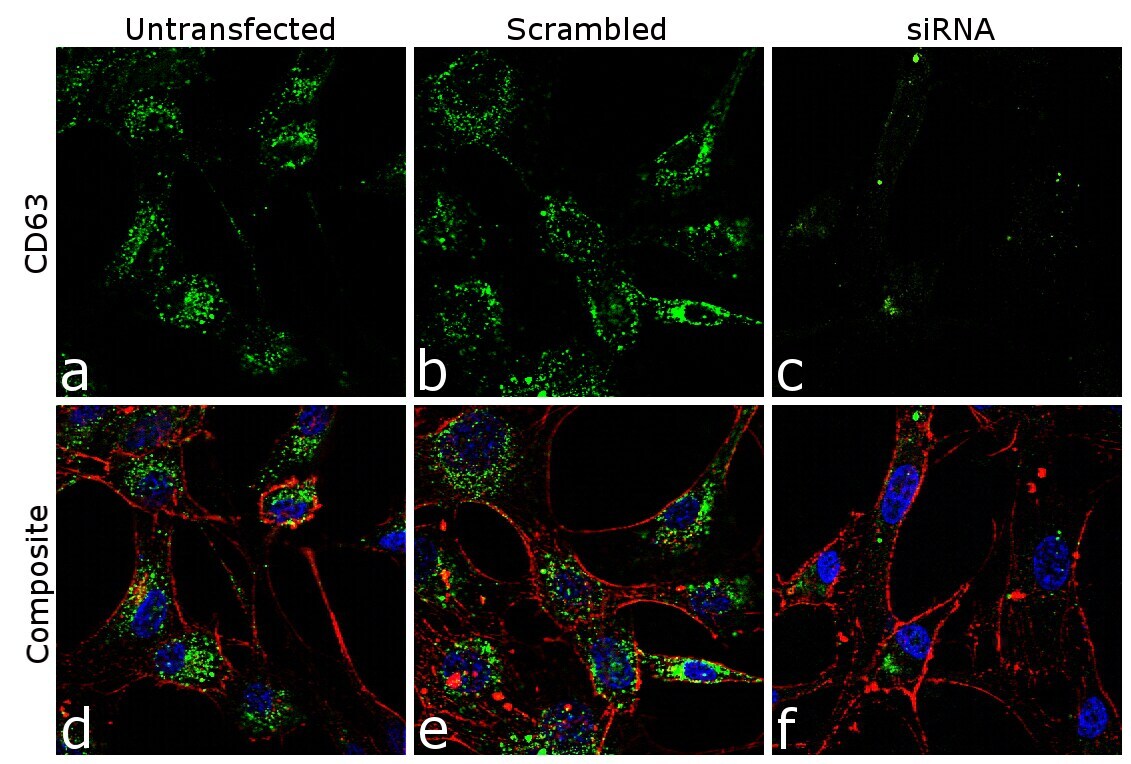
- Knockdown of CD63 was achieved by transfecting U-87 MG cells with CD63 specific siRNA (Silencer® select Product # s2700, s2699). Immunofluorescence analysis was performed on U-87 MG cells (untransfected, panel a,d), transfected with non-specific scrambled siRNA (panels b,e) and transfected with CD63 specific siRNA (panel c,f). Cells were fixed, permeabilized, and labelled with CD63 Mouse Monoclonal Antibody (Product # MA1-19281, 5 µg/mL), followed by Goat anti-Mouse IgG (H+L) Superclonal™ Recombinant Secondary Antibody, Alexa Fluor® 488 (Product # A28175, 1:2000). Nuclei (blue) were stained using ProLong™ Diamond Antifade Mountant with DAPI (Product # P36962), and Rhodamine Phalloidin (Product # R415, 1:300) was used for cytoskeletal F-actin (red) staining. Loss of specific signal was observed upon siRNA mediated knockdown (panel c,f) confirming specificity of the antibody to CD63 (green). The images were captured at 60X magnification.

- Submitted by
- Invitrogen Antibodies (provider)
- Main image

- Experimental details
- Immunocytochemistry staining of human skin fibroblasts with anti-CD63 (MEM-259; green) Monoclonal antibody (Product # MA1-19281) after co-incubation of living cells with human Transferrin - Dyomics 547 (red); cell nuclei stained with DAPI (blue).

- Submitted by
- Invitrogen Antibodies (provider)
- Main image
- Experimental details
- Immunofluorescence analysis of CD63 was performed using 70% confluent log phase U-87 MG cells. The cells were fixed with 4% paraformaldehyde for 10 minutes, permeabilized with 0.1% Triton™ X-100 for 15 minutes, and blocked with 2% BSA for 1 hour at room temperature. The cells were labeled with CD63 Mouse Monoclonal Antibody (MEM-259) (Product # MA1-19281) at 5 µg/mL in 0.1% BSA, incubated at 4 degree celsius overnight and then with Goat anti-Mouse IgG (H+L) Superclonal™ Recombinant Secondary Antibody, Alexa Fluor® 488 conjugate (Product # A28175) at a dilution of 1:2000 for 45 minutes at room temperature (Panel a: green). Nuclei (Panel b: blue) were stained with ProLong™ Diamond Antifade Mountant with DAPI (Product # P36962). F-actin (Panel c: red) was stained with Rhodamine Phalloidin (Product # R415, 1:300). Panel d represents the merged image showing cytoplasmic (Lysosomal pattern) localization. Panel e represents control cells with no primary antibody to assess background. The images were captured at 60X magnification.

- Submitted by
- Invitrogen Antibodies (provider)
- Main image

- Experimental details
- Knockdown of CD63 was achieved by transfecting U-87 MG cells with CD63 specific siRNA (Silencer® select Product # s2700, s2699). Immunofluorescence analysis was performed on U-87 MG cells (untransfected, panel a,d), transfected with non-specific scrambled siRNA (panels b,e) and transfected with CD63 specific siRNA (panel c,f). Cells were fixed, permeabilized, and labelled with CD63 Mouse Monoclonal Antibody (Product # MA1-19281, 5 µg/mL), followed by Goat anti-Mouse IgG (H+L) Superclonal™ Recombinant Secondary Antibody, Alexa Fluor® 488 (Product # A28175, 1:2000). Nuclei (blue) were stained using ProLong™ Diamond Antifade Mountant with DAPI (Product # P36962), and Rhodamine Phalloidin (Product # R415, 1:300) was used for cytoskeletal F-actin (red) staining. Loss of specific signal was observed upon siRNA mediated knockdown (panel c,f) confirming specificity of the antibody to CD63 (green). The images were captured at 60X magnification.
- Submitted by
- Invitrogen Antibodies (provider)
- Main image
- Experimental details
- Immunofluorescent staining of CD63 in human primary fibroblasts using anti-CD63 (Product # MA1-19281; green). Actin cytoskeleton staining was performed using a phalloidin (red) and cell nuclei were stained with DAPI (blue).
- Submitted by
- Invitrogen Antibodies (provider)
- Main image

- Experimental details
- Immunofluorescent staining of CD63 in HeLa cells using anti-CD63 (Product # MA1-19281; green). Actin cytoskeleton staining was performed using a phalloidin (red) and cell nuclei were stained with DAPI (blue).
Supportive validation
- Submitted by
- Invitrogen Antibodies (provider)
- Main image
- Experimental details
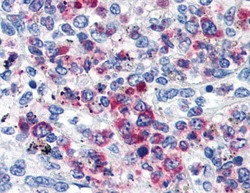
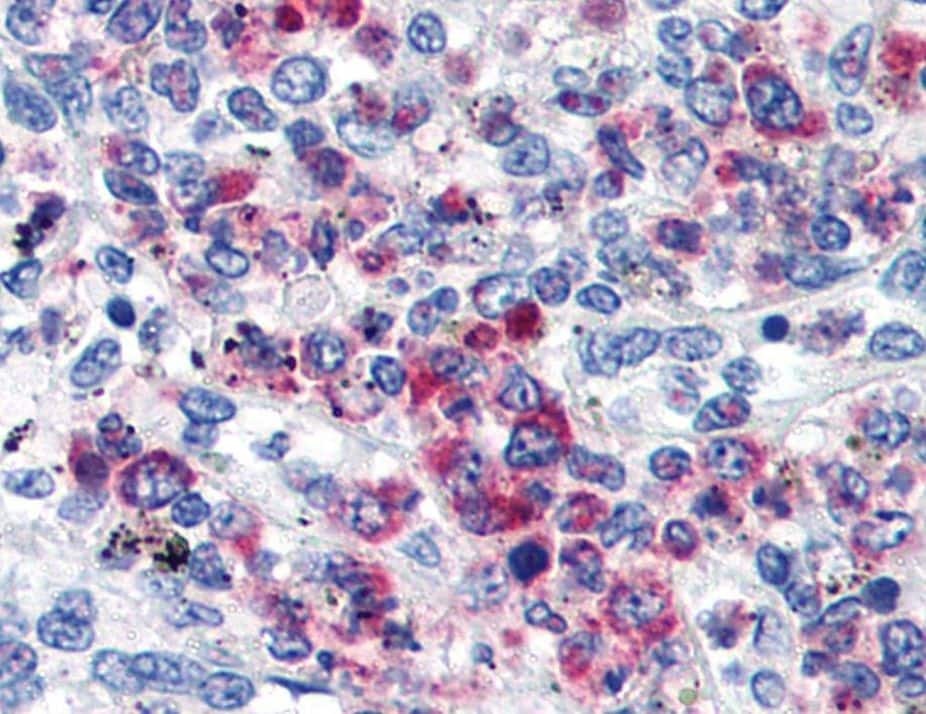
- Immunohistochemistry staining of CD63 in paraffin-embedded human spleen tissue using anti-CD63 monoclonal antibody (Product # MA1-19281).
Supportive validation
- Submitted by
- Invitrogen Antibodies (provider)
- Main image
- Experimental details
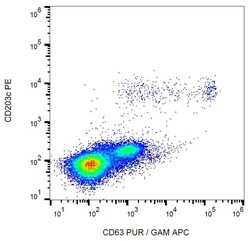
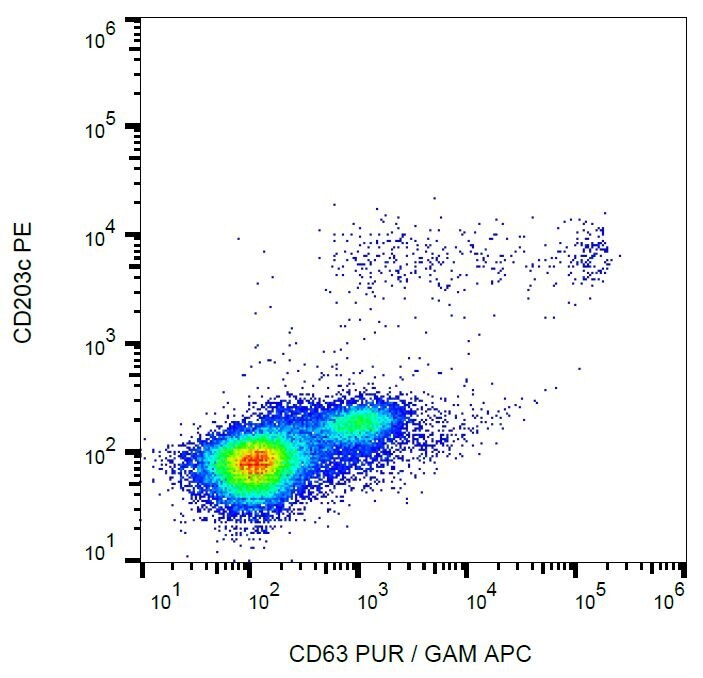
- Flow cytometry analysis of IgE-activated peripheral human blood stained with anti-human CD63 (MEM-259) purified Monoclonal antibody (Product # MA1-19281), GAM-APC.

- Submitted by
- Invitrogen Antibodies (provider)
- Main image

- Experimental details
- Flow cytometry analysis of IgE-activated peripheral human blood stained with anti-human CD63 (MEM-259) purified Monoclonal antibody (Product # MA1-19281), GAM-APC.
Supportive validation
- Submitted by
- Invitrogen Antibodies (provider)
- Main image
- Experimental details
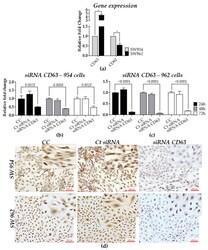
- Figure 4 In vitro TSPANs expression in both non-metastatic (SW954) and metastatic (SW962) cell lines. ( a ) Basal transcript expression levels for CD63 and CD82 in SW962 cells, as compared with SW954 (RQ = 1). Expression values were determined after normalization with beta2 microglobulin (B2M); relative expression of CD63 in SW954 ( b ) and in SW962 ( c ) cells 24, 48, and 72 h after CD63-siRNA transfection; ( d ) CD63 protein expression assessment by ICC (scale bars, 100 px) 48 h after cells transfection. Results were plotted as mean values +- standard deviation (SD). * p < 0.05. CC: Non-transfected cells, Ct siRNA: siRNA control (eGFP-siRNA) and CD63 siRNA: CD63-inhibited cells.
- Submitted by
- Invitrogen Antibodies (provider)
- Main image
- Experimental details
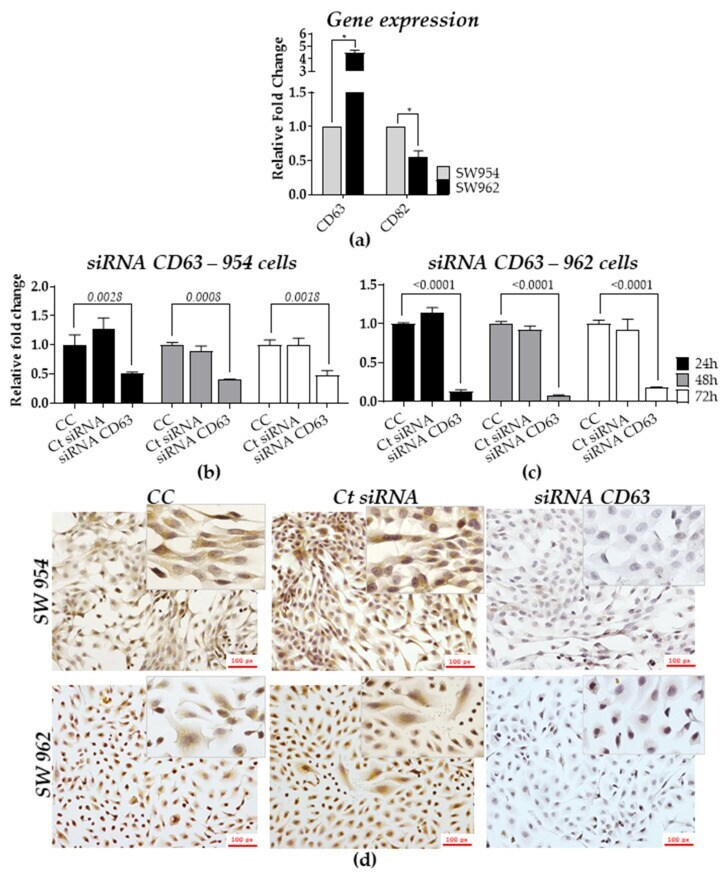
- Figure 2. Multivesicular bodies (MVBs) in LRRK2 G2019S astrocytes are smaller than in WT astrocytes. ( A ) Transmission electron microscopy (TEM) images of MVBs in WT and LRRK2 G2019S astrocytes. For illustration purposes, the red boxes in the top panel indicate MVBs in the cytoplasm of astrocytes and the lower panel shows a zoomed-in view of the MVBs. ( B, C ) Quantification of mean area ( B ) and size distribution ( C ) of MVBs identified in TEM images of WT and LRRK2 G2019S astrocytes. Data are sampled from at least 20 cells (>=40 MVBs) in each experimental condition; error bars represent mean + SEM for two independent biological samples ( B ). Statistical analysis was performed using two-tailed unpaired Student's t-test with equal s.d. (****p

- Submitted by
- Invitrogen Antibodies (provider)
- Main image
- Experimental details
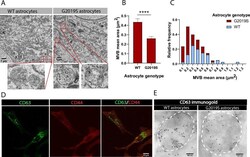
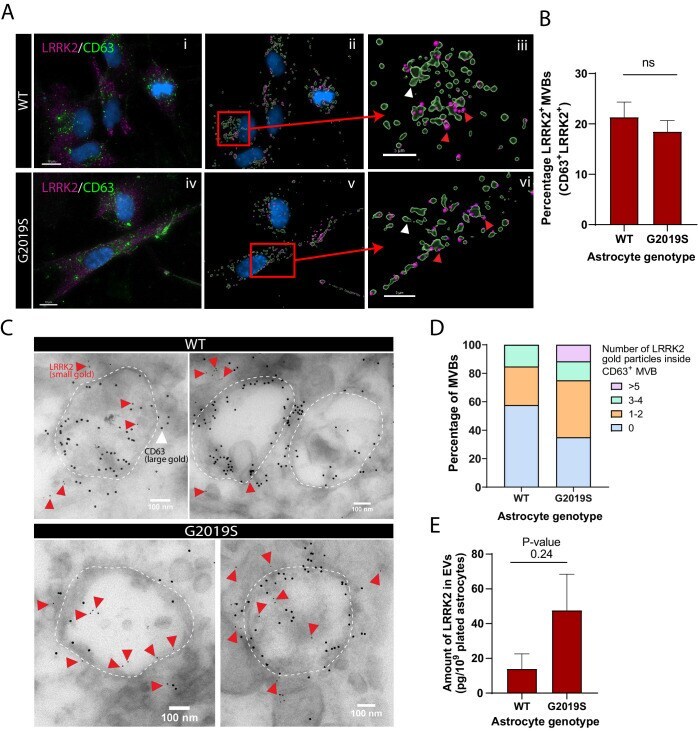
- Figure 4. LRRK2 is associated with multivesicular bodies (MVBs) in astrocytes and accumulates in the MVBs of LRRK2 G2019S mutant. ( A ) Representative images of WT and LRRK2 G2019S isogenic astrocytes labeled by immunofluorescence with CD63 (green), LRRK2 (purple), and DAPI nuclear stain (blue) ( Ai, Aiv ). The images were analyzed using Imaris software to identify CD63 + MVBs (green surfaces) colocalized with LRRK2 (purple dots) and show the localization of the nucleus (DAPI, blue) ( Aii, Av ). Zoomed-in images shows two populations of CD63 + surfaces: CD63 + /LRRK2 + (red arrowhead), and CD63 + /LRRK2 - (white arrowhead) ( Aiii, Avi ). ( B ) Percentage of CD63-labeled surfaces that are also LRKK2 positive in WT and LRRK2 G2019S astrocytes, quantified with Imaris software using object-based colocalization. Data are from three independent biological replicates, and >=40 astrocytes (>3000 MVBs) were analyzed per experimental condition; error bars represent mean + SEM. Statistical analysis was performed using two-tailed unpaired Student's t-test with equal s.d. (ns: not significant). ( C ) Immunogold electron microscopy shows the presence of LRRK2 (small gold, red arrowheads) inside and in the vicinity of CD63 + MVBs (large gold) in WT and LRRK2 G2019S astrocytes. The dashed lines indicate the contour of MVBs. ( D ) Distribution of CD63 + MVBs according to their number of internal LRRK2 gold particles. Data are sampled from at least 20 astrocytes (>=59 MVBs) in each experimenta
- Submitted by
- Invitrogen Antibodies (provider)
- Main image
- Experimental details
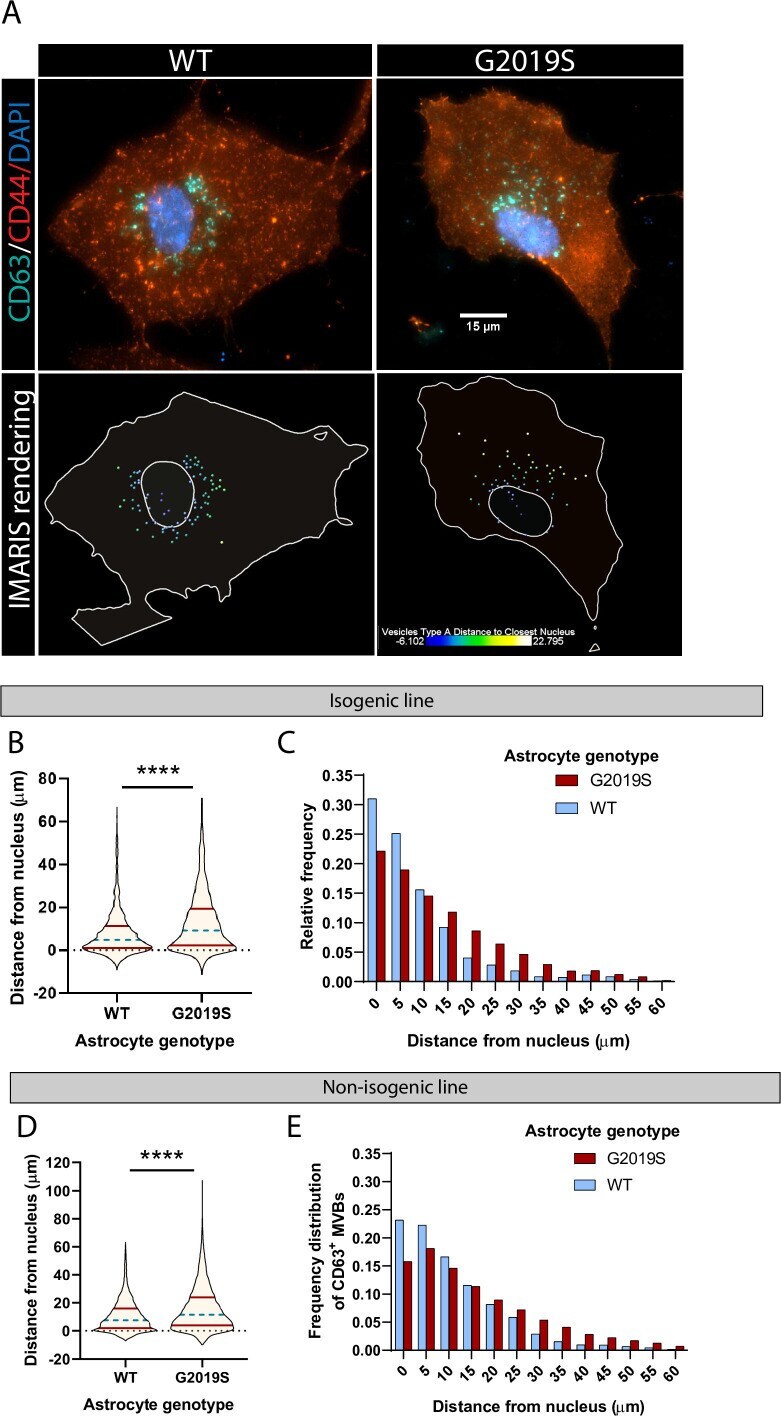
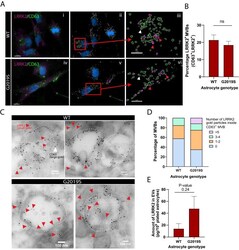
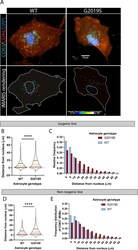
- Figure 5. The spatial distribution of multivesicular bodies (MVBs) in LRRK2 G2019S astrocytes is altered. ( A ) Representative immunofluorescence images of WT and LRRK2 G2019S astrocytes labeled with the exosome marker CD63 (green), the astrocyte marker CD44 (red), and the nuclear marker DAPI (dark blue). The bottom images show the corresponding Imaris software rendering of CD63 + MVBs, color-coded by distance to the nucleus, from blue (closest) to white (farthest). The plain white lines indicate the cell boundary (outer line) and nucleus (inner circle). ( B-E ) Quantification of the distance of CD63 + MVBs from the nuclear membrane in WT and LRRK2 G2019S isogenic ( B, C ) or non-isogenic ( D, E ) astrocytes using Imaris software 'vesicles distance to closest nucleus' calculation. The violin plot shows the median (blue dashed line) and interquartile range (red solid line) ( B, D ). Data are from three independent biological replicates, 40-70 astrocytes (>3300 MVBs) were analyzed for each experimental condition. Statistical analysis was performed using a Mann-Whitney test (****p