Explore
 Validate
 Learn
Learn Western blot
Antibody data
- Antibody Data
- Antigen structure
- References [1]
- Comments [0]
- Validations
- Western blot [1]
- ELISA [1]
- Immunocytochemistry [3]
- Other assay [2]
Submit
Validation data
Reference
Comment
Report error
- Product number
- MA5-24514 - Provider product page

- Provider
- Invitrogen Antibodies
- Product name
- RBP7 Monoclonal Antibody (4F4)
- Antibody type
- Monoclonal
- Antigen
- Recombinant full-length protein
- Description
- Peptide Sequence: KLLKPQKVIE QNGDSFTIHT NSSLRNYFVK FKVGEEFDED NRGLDNRKCK SLVIWDNDRL TCIQKGEKKN RGWTHWIEGD KLHLEMFCEG QVCKQTFQRA
- Reactivity
- Human
- Host
- Mouse
- Isotype
- IgG
- Antibody clone number
- 4F4
- Vial size
- 100 μg
- Concentration
- 0.5 mg/mL
- Storage
- -20°C, Avoid Freeze/Thaw Cycles
Submitted references Single-cell transcriptome profiling reveals vascular endothelial cell heterogeneity in human skin.
Li Q, Zhu Z, Wang L, Lin Y, Fang H, Lei J, Cao T, Wang G, Dang E
Theranostics 2021;11(13):6461-6476
Theranostics 2021;11(13):6461-6476
No comments: Submit comment
Supportive validation
- Submitted by
- Invitrogen Antibodies (provider)
- Main image

- Experimental details
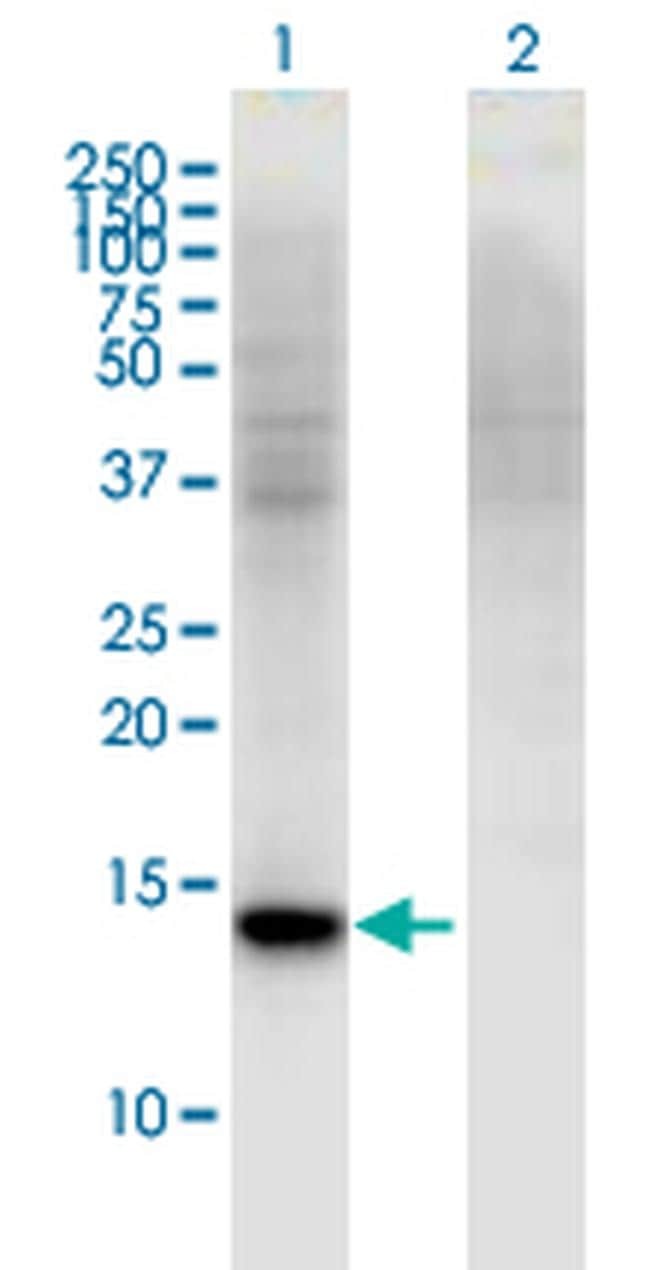
- Western blot analysis of RBP7 / Retinol-Binding Protein 7 in transfected 293T cell line. Lane 1: RBP7 transfected lysate (Predicted MW: 15.5 KDa). Lane 2: Non-transfected lysate. Samples were probed using a Mouse Monoclonal RBP7 / Retinol-Binding Protein 7 (4F4) Antibody (Product # MA5-24514).
Supportive validation
- Submitted by
- Invitrogen Antibodies (provider)
- Main image

- Experimental details
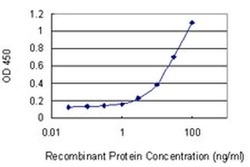
- ELISA analysis using recombinant GST tagged RBP7 / Retinol-Binding Protein 7 Antibody (Product # MA5-24514) at 1 ng/mL as the capture antibody.

Supportive validation
- Submitted by
- Invitrogen Antibodies (provider)
- Main image

- Experimental details
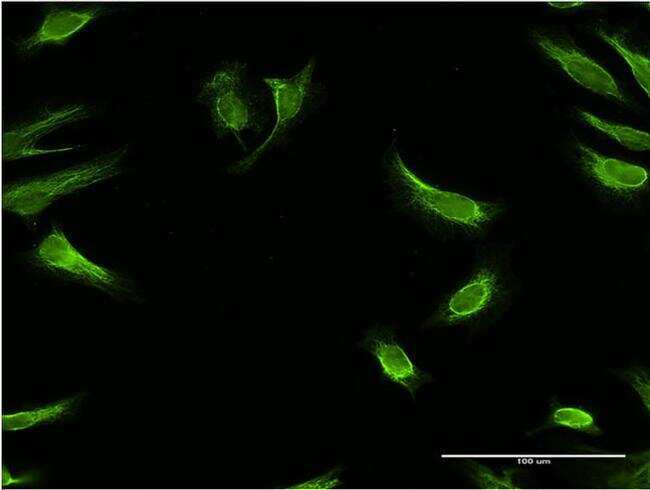
- Immunofluorescent analysis of RBP7 / Retinol-Binding Protein 7 in HeLa cell lysates. Samples were probed using a Mouse Monoclonal RBP7 / Retinol-Binding Protein 7 (4F4) Antibody (Product # MA5-24514) at 10 µg/mL.
- Submitted by
- Invitrogen Antibodies (provider)
- Main image

- Experimental details
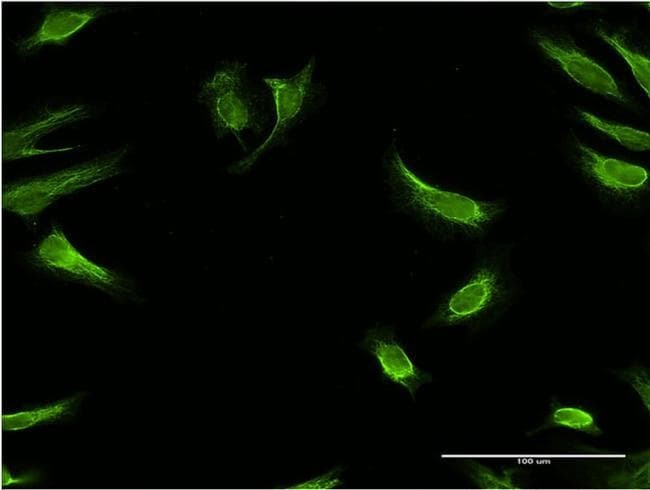
- Immunofluorescent analysis of RBP7 / Retinol-Binding Protein 7 in HeLa cell lysates. Samples were probed using a Mouse Monoclonal RBP7 / Retinol-Binding Protein 7 (4F4) Antibody (Product # MA5-24514) at 10 µg/mL.

- Submitted by
- Invitrogen Antibodies (provider)
- Main image

- Experimental details
- Immunofluorescent analysis of RBP7 / Retinol-Binding Protein 7 in HeLa cell lysates. Samples were probed using a Mouse Monoclonal RBP7 / Retinol-Binding Protein 7 (4F4) Antibody (Product # MA5-24514) at 10 µg/mL.
Supportive validation
- Submitted by
- Invitrogen Antibodies (provider)
- Main image
- Experimental details
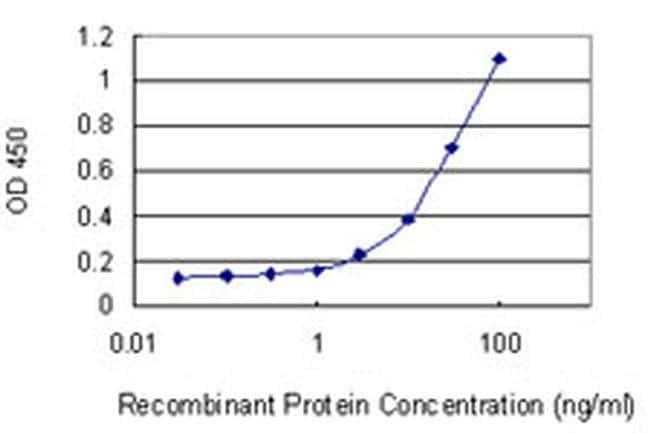
- ELISA analysis using recombinant GST tagged RBP7 / Retinol-Binding Protein 7 Antibody (Product # MA5-24514) at 1 ng/mL as the capture antibody.
- Submitted by
- Invitrogen Antibodies (provider)
- Main image
- Experimental details
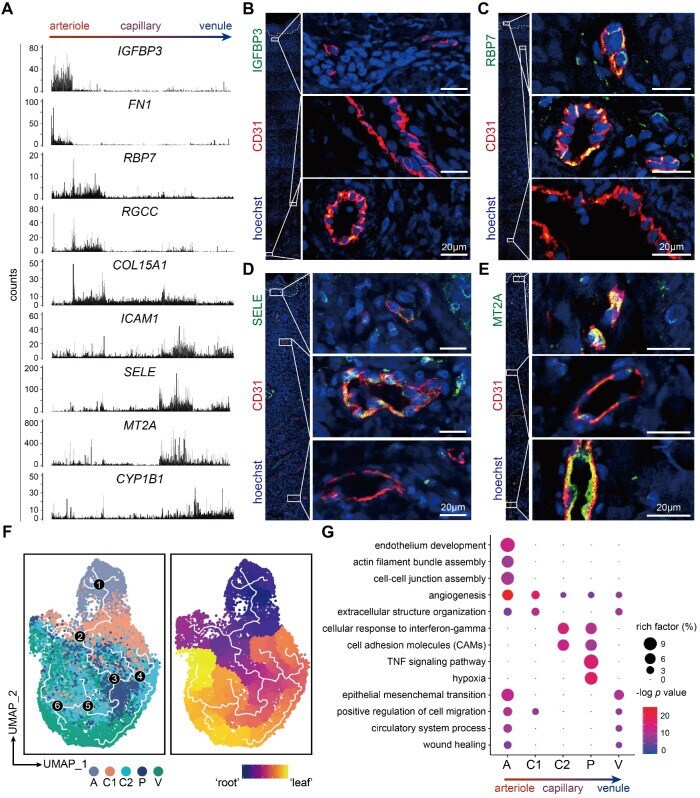
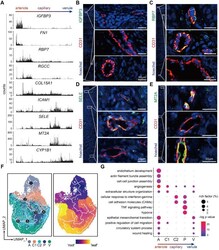
- Figure 2 Heterogeneous expressions and functions of dermal ECs along the arteriovenous axis. ( A ) Zonational expression of representative genes across dermal vascular bed. ECs are rearranged in an arteriovenous order. y axis represents counts. ( B-E ) Immunofluorescence of IGFBP3, RBP7, SELE, MT2A and CD31. Images of CD31 + ECs in the superficial, intermediate, and deep plexus are zoomed in. The image is representative of 11 biological replicates (limbs, n = 4; trunk, n = 4; foreskin, n = 3). The white dotted line marks the interface between epidermis and dermis. Scale bars represent 20 um. ( F ) Single-cell trajectory of dermal EC subtypes by pseudotime analysis. The white line traces the trajectory. ECs in the left panel are colored by clusters, and white numbers in black circles mark the branch nodes of the pseudotime trajectory. ECs in the right panel plot are colored by pseudotime. Color scale: yellow, 'leaf' of the trajectory; purple, 'root' of the trajectory. ( G ) GO pathway enrichment analysis of the marker genes of dermal EC clusters. The color represents -log p value, and the size indicates the rich factor. Cluster A: arteriole ECs; Cluster C1, C2: capillary ECs; Cluster P: post-capillary ECs; Cluster V: venule ECs. ECs: vascular endothelial cells; GO: gene ontology; UMAP: uniform manifold approximation and projection.