Explore
 Validate
 Learn
Learn Western blot
 Immunocytochemistry
Antibody data
- Antibody Data
- Antigen structure
- References [1]
- Comments [0]
- Validations
- Immunocytochemistry [3]
- Immunohistochemistry [2]
- Other assay [6]
Submit
Validation data
Reference
Comment
Report error
- Product number
- PA5-104324 - Provider product page

- Provider
- Invitrogen Antibodies
- Product name
- GSDMD Polyclonal Antibody
- Antibody type
- Polyclonal
- Antigen
- Synthetic peptide
- Description
- Antibody detects endogenous levels of total GSDMD.
- Reactivity
- Human
- Host
- Rabbit
- Isotype
- IgG
- Vial size
- 100 μL
- Concentration
- 1 mg/mL
- Storage
- -20°C
Submitted references LncRNA-HOTAIR promotes endothelial cell pyroptosis by regulating the miR-22/NLRP3 axis in hyperuricaemia.
Chi K, Geng X, Liu C, Zhang Y, Cui J, Cai G, Chen X, Wang F, Hong Q
Journal of cellular and molecular medicine 2021 Sep;25(17):8504-8521
Journal of cellular and molecular medicine 2021 Sep;25(17):8504-8521
No comments: Submit comment
Supportive validation
- Submitted by
- Invitrogen Antibodies (provider)
- Main image

- Experimental details
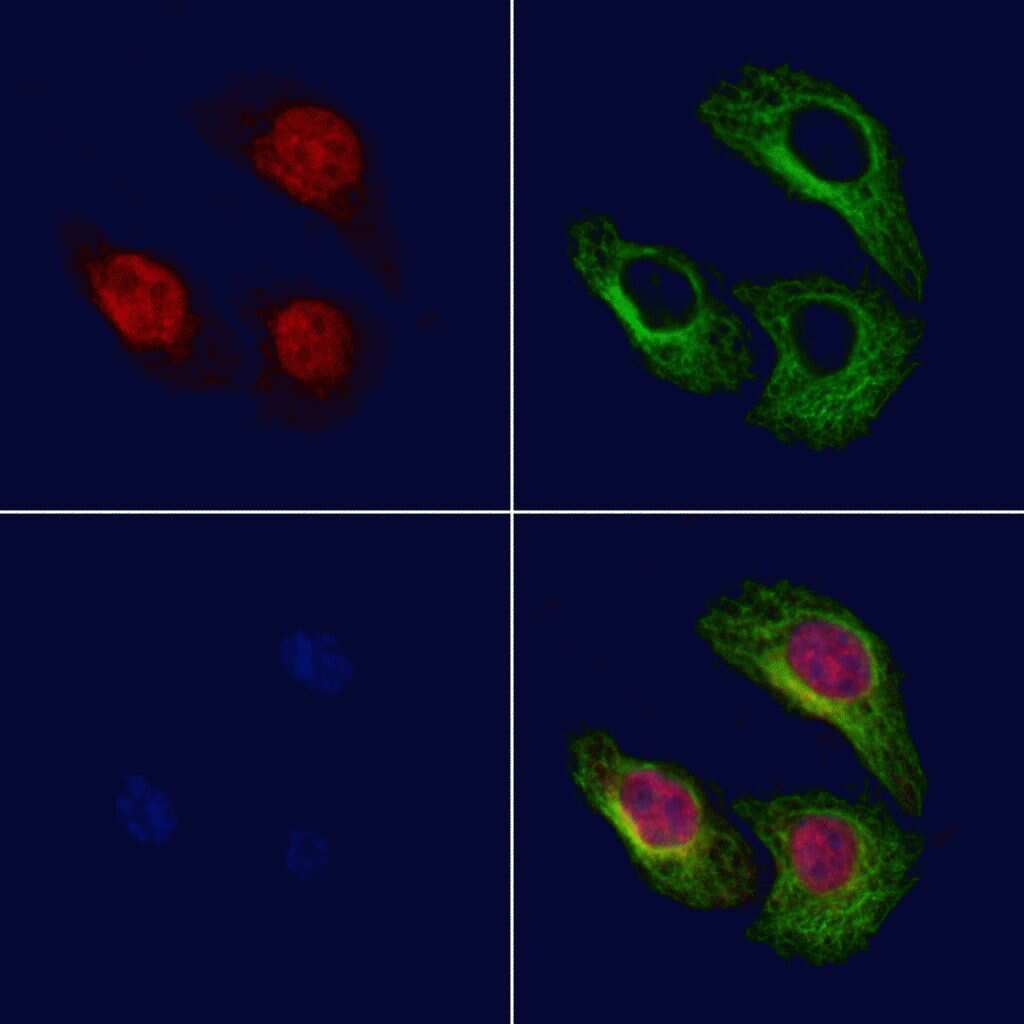
- Immunofluorescent analysis of GSDMD in HeLa cells. Samples were fixed with paraformaldehyde, permeabilized with 0.1% Triton X-100, blocked with 10% serum (45 min at 25°C), incubated with mouse anti-beta tubulin and GSDMD polyclonal antibody (Product # PA5-104324) using a dilution of 1:200 (1 hr, 37°C), and followed by goat anti-rabbit IgG Alexa Fluor 594 (red) and goat anti-mouse IgG Alexa Fluor 488 (green).

- Submitted by
- Invitrogen Antibodies (provider)
- Main image

- Experimental details
- Immunofluorescent analysis of GSDMD in HeLa cells. Samples were fixed with paraformaldehyde, permeabilized with 0.1% Triton X-100, blocked with 10% serum (45 min at 25°C), incubated with mouse anti-beta tubulin and GSDMD polyclonal antibody (Product # PA5-104324) using a dilution of 1:200 (1 hr, 37°C), and followed by goat anti-rabbit IgG Alexa Fluor 594 (red) and goat anti-mouse IgG Alexa Fluor 488 (green).

Supportive validation
- Submitted by
- Invitrogen Antibodies (provider)
- Main image
- Experimental details
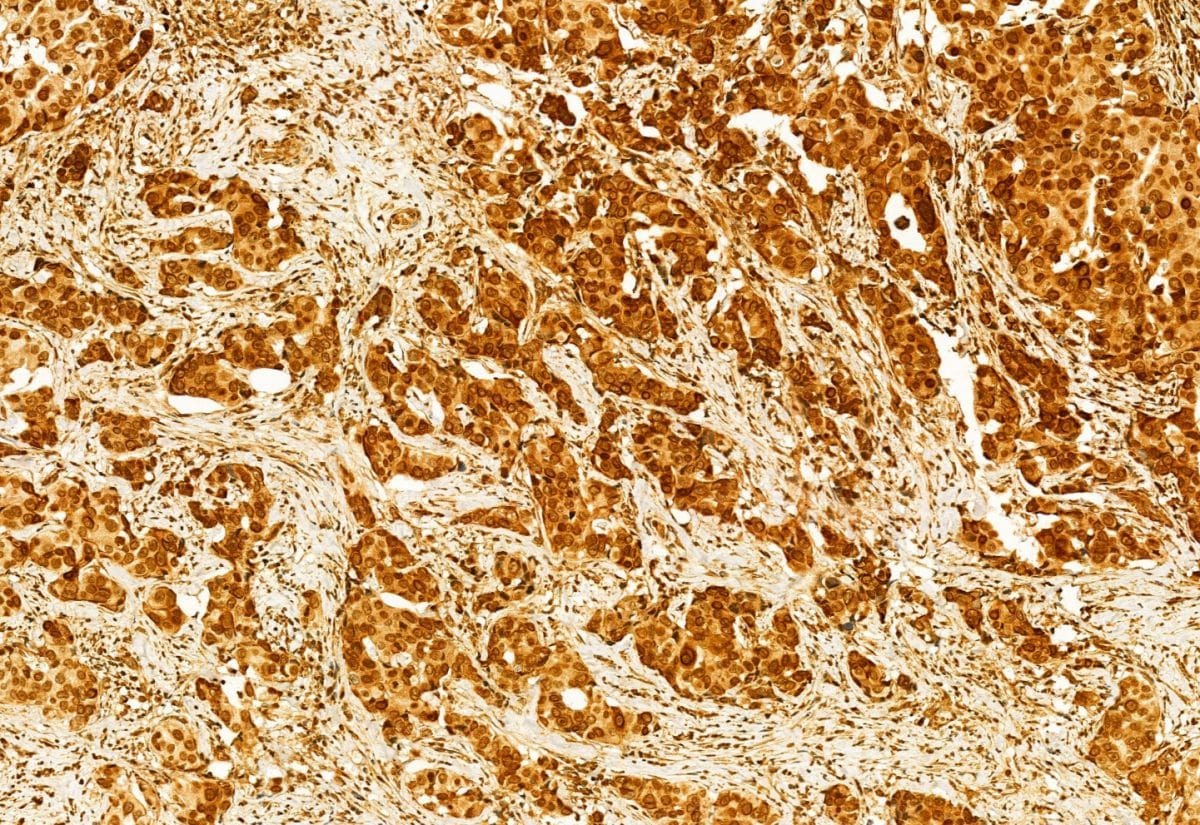
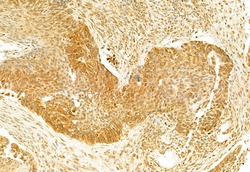
- Immunohistochemistry analysis of GSDMD in human mammary cancer. The sample was formaldehyde fixed and a heat mediated antigen retrieval step in citrate buffer was performed. Samples were incubated with GSDMD polyclonal antibody (Product # PA5-104324) using a dilution of 1:100 (4°C overnight) followed by HRP conjugated anti-Rabbit secondary antibody.
- Submitted by
- Invitrogen Antibodies (provider)
- Main image
- Experimental details
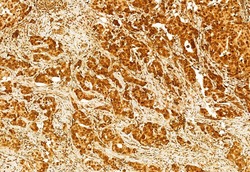
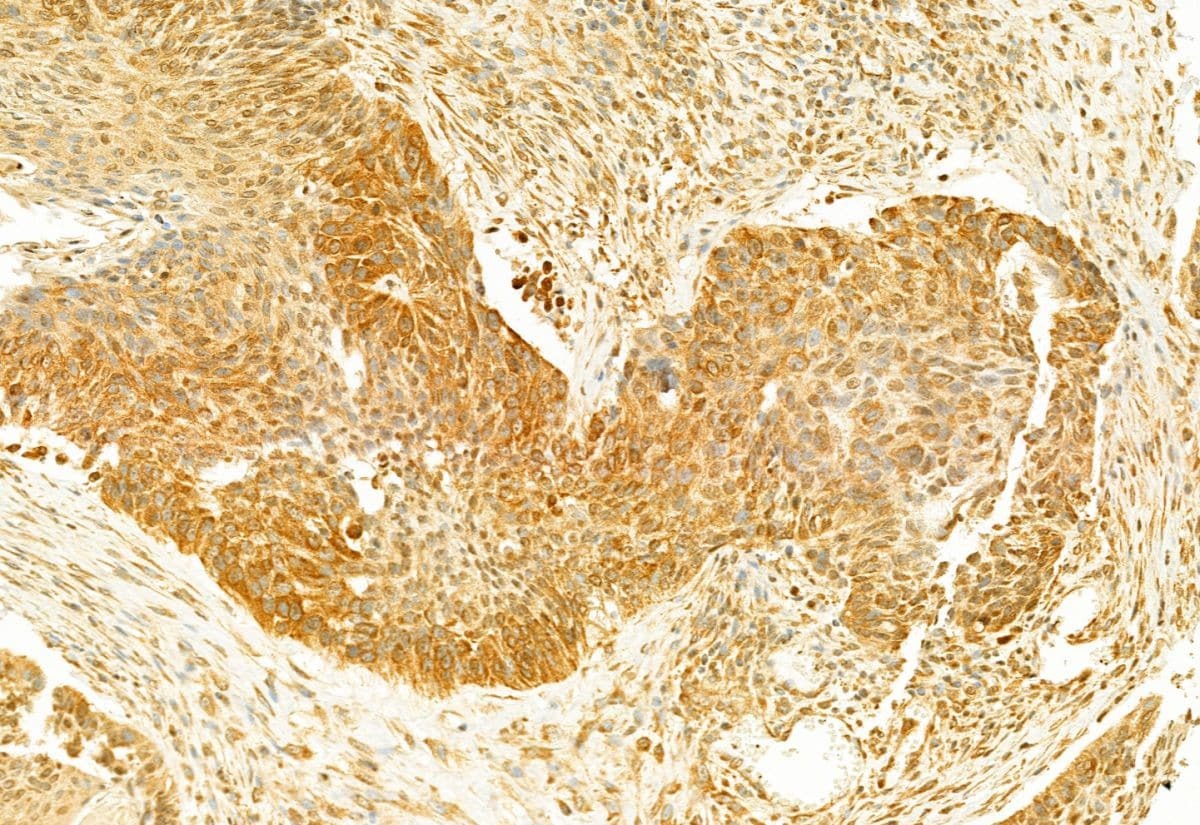
- Immunohistochemistry analysis of GSDMD in human lung cancer. The sample was formaldehyde fixed and a heat mediated antigen retrieval step in citrate buffer was performed. Samples were incubated with GSDMD polyclonal antibody (Product # PA5-104324) using a dilution of 1:100 (4°C overnight) followed by HRP conjugated anti-Rabbit secondary antibody.
Supportive validation
- Submitted by
- Invitrogen Antibodies (provider)
- Main image

- Experimental details
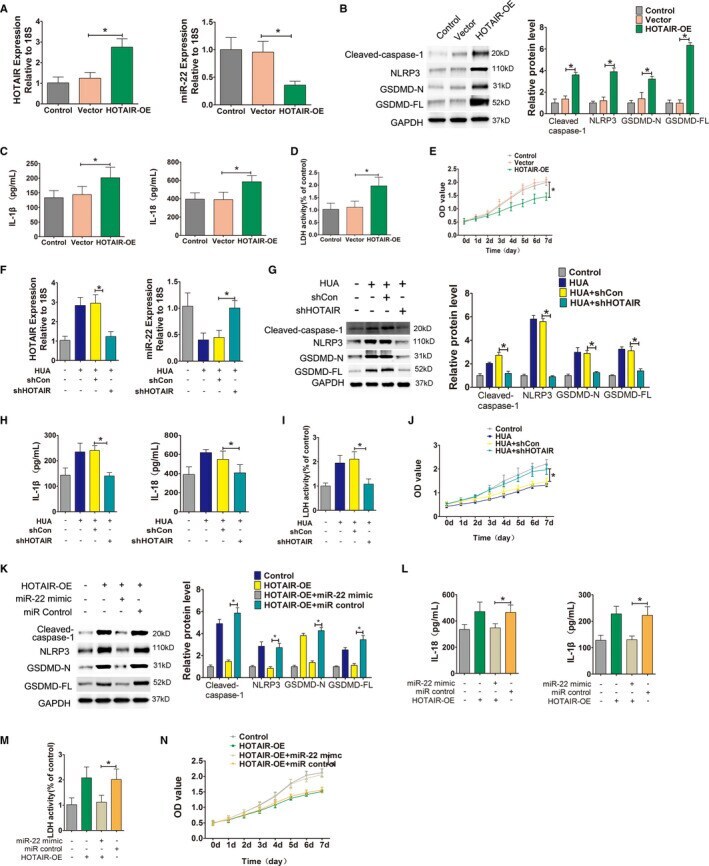
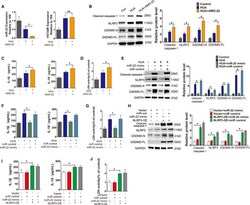
- 4 FIGURE HOTAIR, as a molecular sponge, down-regulates miR-22. (A) Relative HOTAIR and miR-22 expression in HUVECs, measured by qPCR after transfection. HOTAIR was significantly upregulated and miR-22 was significantly down-regulated in the HOTAIR-OE group; * p < 0.05 compared to the vector group; n = 3 in each group. (B) Protein levels of caspase-1, NLRP3, GSDMD-N and GSDMD-FL, were measured by Western blot analysis; quantification normalized to GAPDH in HUVECs that were transfected with lentiviruses. After transfection, NLRP3, caspase-1, GSDMD-N and GSDMD-FL protein expression levels increased in the HOTAIR-OE group; * p < 0.05 compared to the vector group; n = 3 in each group; OE: overexpression. (C) Levels of IL-1beta and IL-18 in cell culture supernatants were measured by ELISA after transfection. After transfection, the levels of IL-1beta and IL-18 in the culture supernatant significantly increased in HOTAIR-OE group; * p < 0.05 compared to the vector group; n = 3 in each group. (D) LDH secretion was assessed using a commercial kit. After infection, LDH release increased significantly in the HOTAIR-OE group; * p < 0.05 compared to the vector group; n = 3 in each group. (E) Cell viability was determined by the CCK-8 assay after transfection. The growth of HUVECs in the HOTAIR group was significantly inhibited. * p < 0.05 compared to the vector group; n = 3 in each group. (F) Relative HOTAIR and miR-22 expression in HUA-treated cells, measured by qPCR after shRNA transfec

- Submitted by
- Invitrogen Antibodies (provider)
- Main image
- Experimental details
- FIGURE 4 HOTAIR, as a molecular sponge, down-regulates miR-22. (A) Relative HOTAIR and miR-22 expression in HUVECs, measured by qPCR after transfection. HOTAIR was significantly upregulated and miR-22 was significantly down-regulated in the HOTAIR-OE group; * p < 0.05 compared to the vector group; n = 3 in each group. (B) Protein levels of caspase-1, NLRP3, GSDMD-N and GSDMD-FL, were measured by Western blot analysis; quantification normalized to GAPDH in HUVECs that were transfected with lentiviruses. After transfection, NLRP3, caspase-1, GSDMD-N and GSDMD-FL protein expression levels increased in the HOTAIR-OE group; * p < 0.05 compared to the vector group; n = 3 in each group; OE: overexpression. (C) Levels of IL-1beta and IL-18 in cell culture supernatants were measured by ELISA after transfection. After transfection, the levels of IL-1beta and IL-18 in the culture supernatant significantly increased in HOTAIR-OE group; * p < 0.05 compared to the vector group; n = 3 in each group. (D) LDH secretion was assessed using a commercial kit. After infection, LDH release increased significantly in the HOTAIR-OE group; * p < 0.05 compared to the vector group; n = 3 in each group. (E) Cell viability was determined by the CCK-8 assay after transfection. The growth of HUVECs in the HOTAIR group was significantly inhibited. * p < 0.05 compared to the vector group; n = 3 in each group. (F) Relative HOTAIR and miR-22 expression in HUA-treated cells, measured by qPCR after shRNA transfec
- Submitted by
- Invitrogen Antibodies (provider)
- Main image
- Experimental details
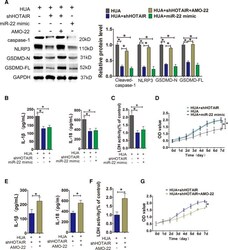
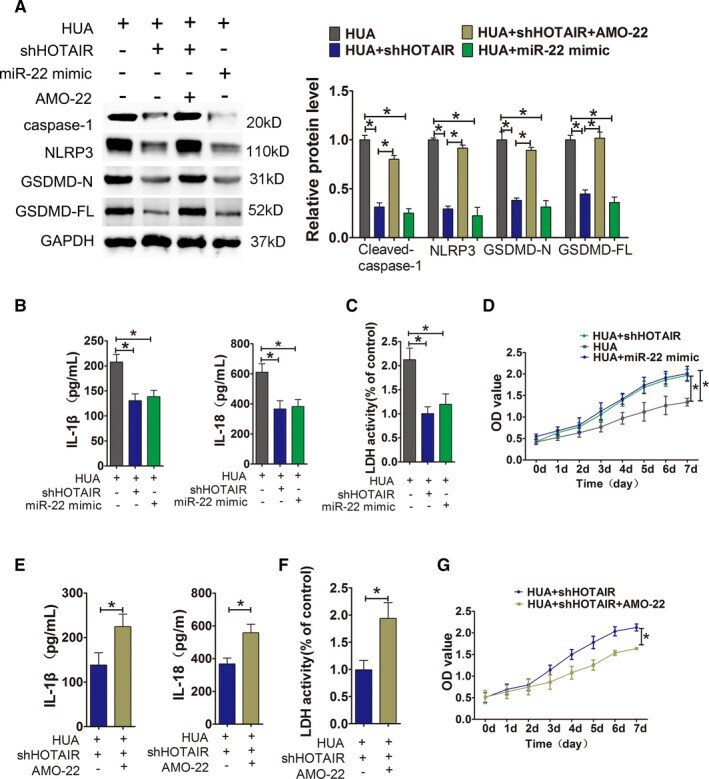
- FIGURE 5 HUA promoted HUVECs inflammation and pyroptosis through HOTAIR/miR-22. (A) Protein levels of caspase-1, NLRP3, GSDMD-N and GSDMD-FL, as measured by Western blot analysis; quantification normalized to GAPDH after incubation with miR-22 mimic or AMO-22 after HIOTAIR knockdown. The expression of NLRP3, caspase-1, GSDMD-N and GSDMD-FL decreased in UA+shHOTAIR group and UA+miR-22 mimc group; * p < 0.05 compared to the UA group. The expression of NLRP3, caspase-1, GSDMD-N and GSDMD-FL increased in UA+shHOTAIR+AMO-22 group; * p < 0.05 compared to the UA+shHOTAIR group; n = 3 in each group. (B,C) Levels of IL-1beta, IL-18 and LDH in cell culture supernatants, measured by ELISA after incubation with miR-22 mimic after HIOTAIR knockdown. The levels of IL-1beta, IL-18 and LDH decreased in UA+shHOTAIR group and UA+miR-22 mimc group; * p < 0.05 compared to the UA group; n = 3 in each group. (D) Cell viability was determined by the CCK-8 assay after incubation with miR-22 mimic after HIOTAIR knockdown. The proliferation of UA+shHOTAIR group and UA+miR-22 mimc group significantly increased; * p < 0.05 compared to the UA group; n = 3 in each group. (E,F) Levels of IL-1beta, IL-18 and LDH in cell culture supernatants, measured by ELISA after incubation with AMO-22 after HIOTAIR knockdown. The levels of IL-1beta, IL-18 and LDH significantly increased in UA+shHOTAIR+AMO-22 group; * p < 0.05 compared to UA+shHOTAIR group; n = 3 in each group. (G) Cell viability was determined by the CCK
- Submitted by
- Invitrogen Antibodies (provider)
- Main image

- Experimental details
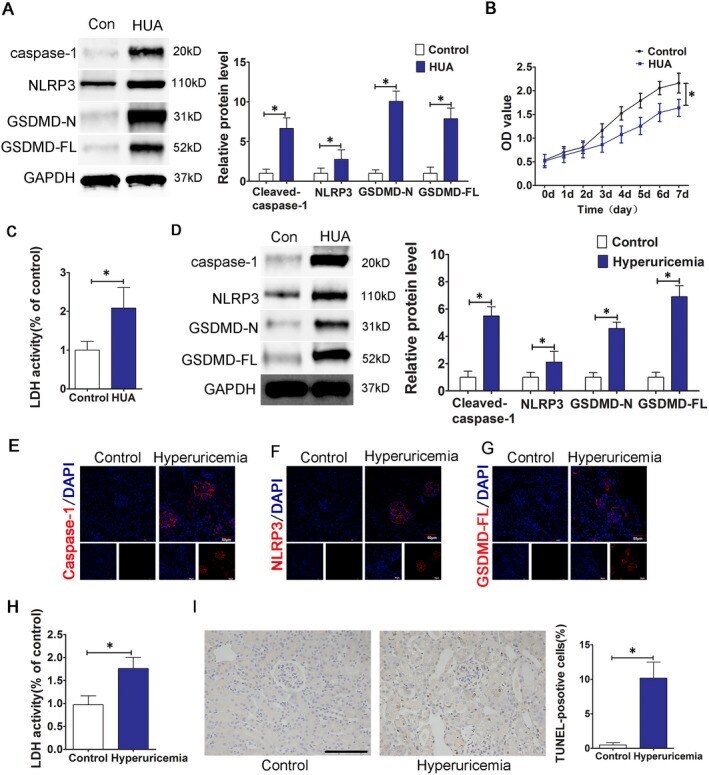
- FIGURE 2 HUA induces the activation of the NLRP3 inflammasome and pyroptosis. (A) The protein levels of caspase-1, NLRP3, GSDMD-N and GSDMD-FL, as measured by Western blot analysis; quantification normalized to GAPDH in HUA-treated HUVECs. The HUA group showed increased caspase-1, NLRP3, GSDMD-N, GSDMD-FL protein expression levels after 24 h of stimulation; p < 0.05 compared to the control group; n = 3 in each group. (B) Cell viability of HUA-treated HUVECs was determined by the CCK-8 assay. The growth of HUVECs was significantly inhibited in HUA group. * p < 0.05 compared to the control group; n = 3 in each group. (C) LDH secretion in HUA-treated cells was assessed using a commercial kit. LDH release increased significantly in HUA group. * p < 0.05 compared to the control group; n = 3 in each group. (D) The protein levels of caspase-1, NLRP3, GSDMD-N and GSDMD-FL, as measured by Western blot analysis; quantification normalized to GAPDH in renal tissue from hyperuricaemia mice. The protein levels of caspase-1, NLRP3, GSDMD-N and GSDMD-FL increased significantly in hyperuricaemia group. * p < 0.05 compared to the control group; n = 6 in each group. (E-G) Immunofluorescence images showing the expression of caspase-1, NLRP3 and GSDMD-FL in renal tissue from hyperuricaemia mice. Tissue immunofluorescence showed that the fluorescence intensity of glomerular NLRP3, caspase-1 and GSDMD-FL in the hyperuricaemia group was significantly higher than that in the control group. * p < 0.05
- Submitted by
- Invitrogen Antibodies (provider)
- Main image
- Experimental details
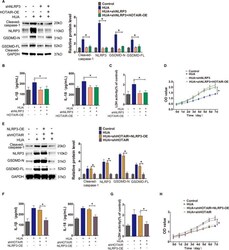
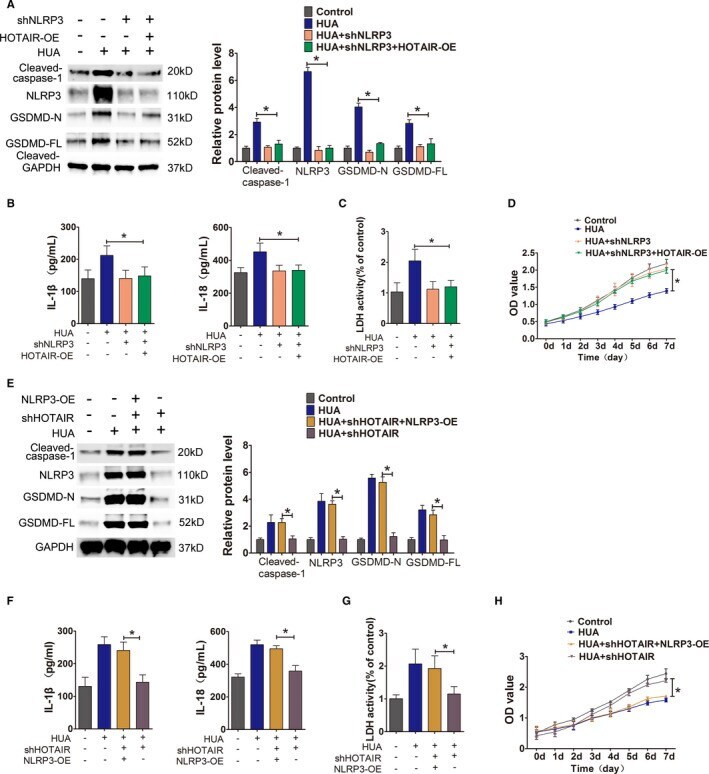
- FIGURE 6 Identification of the role of NLRP3 in the HOTAIR-induced pyroptosis pathway. (A) Protein levels of caspase-1, NLRP3, GSDMD-N and GSDMD-FL, as measured by Western blot analysis; quantification normalized to GAPDH after shNLRP3 transfection. The expression of NLRP3, caspase-1, GSDMD-N and GSDMD-FL decreased in HUA+shNLRP3+HOTAIR-OE group; p < 0.05 compared to HUA group; n = 3 in each group. (B,C) Levels of IL-1beta, IL-18 and LDH in cell culture supernatants, measured by ELISA after shNLRP3 transfection. The levels of IL-1beta, IL-18 and LDH in culture supernatants decreased significantly in HUA+shNLRP3 + HOTAIR-OE group; p < 0.05 compared to HUA group; n = 3 in each group. (D) Cell viability was determined using the CCK-8 assay after shNLRP3 transfection. The proliferation of HUA+shNLRP3 + HOTAIR-OE group significantly increased; p < 0.05 compared to HUA group; n = 3 in each group. (E) Protein levels of caspase-1, NLRP3, GSDMD-N and GSDMD-FL, as measured by Western blot analysis; quantification normalized to GAPDH after HUVECs' HOTAIR knockdown and NLRP3 overexpressing, followed by UA stimulation. The expression of NLRP3, caspase-1, GSDMD-N and GSDMD-FL increased in UA+shHOTAIR+NLRP3-OE group; * p < 0.05 compared to UA+shHOTAIR group; n = 3 in each group. (F,G) Levels of IL-1beta, IL-18 and LDH in cell culture supernatants, measured by ELISA after HUVECs' HOTAIR knockdown and NLRP3 overexpressing, followed by UA stimulation. The levels of IL-1beta, IL-18 and LDH incr
- Submitted by
- Invitrogen Antibodies (provider)
- Main image
- Experimental details
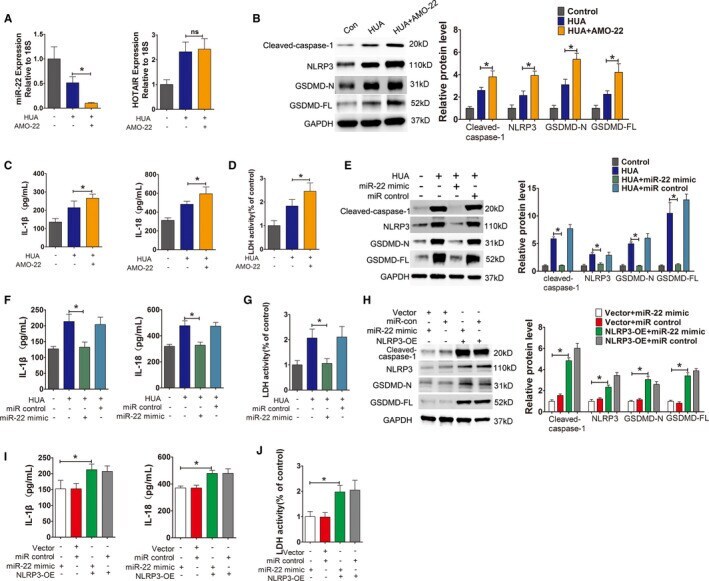
- FIGURE 7 HUA promoted HUVECs inflammation and pyroptosis through miR-22/NLRP3. (A) Relative HOTAIR expression was measured by qPCR after incubation with AMO-22. The expression of HOTAIR did not change after incubation in HUA+AMO-22 group. p > 0.05 compared to the HUA group; n = 3 in each group. (B) Protein levels of caspase-1, NLRP3, GSDMD-N and GSDMD-FL, as measured by Western blot analysis; quantification normalized to GAPDH after incubation with AMO-22. After knocking down miR-22 with AMO-22, the expression of NLRP3, caspase-1, GSDMD-N and GSDMD-FL increased in HUA+AMO-22 group; * p < 0.05 compared to the HUA group; n = 3 in each group. (C,D) Levels of IL-1beta, IL-18 and LDH in cell culture supernatants, measured by ELISA after incubation with AMO-22. The levels of IL-1beta, IL-18 and LDH increased in HUA+AMO-22 group; * p < 0.05 compared to the HUA group; n = 3 in each group. (E) Protein levels of caspase-1, NLRP3, GSDMD-N and GSDMD-FL, as measured by Western blot analysis; quantification normalized to GAPDH after incubation with a miR-22 mimic. After incubation with the miR-22 mimic in a HUA environment, the expression of NLRP3, caspase-1, GSDMD-N and GSDMD-FL significantly decreased; * p < 0.05 compared to the HUA group; n = 3 in each group. (F,G) Levels of IL-1beta, IL-18 and LDH in cell culture supernatants, measured by ELISA after incubation with a miR-22 mimic. The levels of IL-1beta, IL-18 and LDH significantly decreased in HUA+miR-22 mimic group; * p < 0.05 compa