Explore
 Validate
 Learn
Learn Western blot
 ELISA
ELISA Other assay
Antibody data
- Antibody Data
- Antigen structure
- References [7]
- Comments [0]
- Validations
- Other assay [3]
Submit
Validation data
Reference
Comment
Report error
- Product number
- 37-0300 - Provider product page

- Provider
- Invitrogen Antibodies
- Product name
- CKS2 Monoclonal Antibody (1F7G5)
- Antibody type
- Monoclonal
- Antigen
- Synthetic peptide
- Reactivity
- Human
- Host
- Mouse
- Isotype
- IgG
- Antibody clone number
- 1F7G5
- Vial size
- 100 μg
- Concentration
- 0.5 mg/mL
- Storage
- -20°C
Submitted references Single cell transcriptomics reveals the heterogeneity of the human cornea to identify novel markers of the limbus and stroma.
Mitochondrial Function of CKS2 Oncoprotein Links Oxidative Phosphorylation with Cell Division in Chemoradioresistant Cervical Cancer.
The Cks1/Cks2 axis fine-tunes Mll1 expression and is crucial for MLL-rearranged leukaemia cell viability.
Upregulation of the cycline kinase subunit CKS2 increases cell proliferation rate in gastric cancer.
Gene expression of cyclin-dependent kinase subunit Cks2 is repressed by the tumor suppressor p53 but not by the related proteins p63 or p73.
Expression of cyclin-dependent kinase subunit 1 (Cks1) is regulated during the cell cycle by a CDE/CHR tandem element and is downregulated by p53 but not by p63 or p73.
Gene expressions and copy numbers associated with metastatic phenotypes of uterine cervical cancer.
Català P, Groen N, Dehnen JA, Soares E, van Velthoven AJH, Nuijts RMMA, Dickman MM, LaPointe VLS
Scientific reports 2021 Nov 5;11(1):21727
Scientific reports 2021 Nov 5;11(1):21727
Mitochondrial Function of CKS2 Oncoprotein Links Oxidative Phosphorylation with Cell Division in Chemoradioresistant Cervical Cancer.
Jonsson M, Fjeldbo CS, Holm R, Stokke T, Kristensen GB, Lyng H
Neoplasia (New York, N.Y.) 2019 Apr;21(4):353-362
Neoplasia (New York, N.Y.) 2019 Apr;21(4):353-362
The Cks1/Cks2 axis fine-tunes Mll1 expression and is crucial for MLL-rearranged leukaemia cell viability.
Grey W, Ivey A, Milne TA, Haferlach T, Grimwade D, Uhlmann F, Voisset E, Yu V
Biochimica et biophysica acta. Molecular cell research 2018 Jan;1865(1):105-116
Biochimica et biophysica acta. Molecular cell research 2018 Jan;1865(1):105-116
Upregulation of the cycline kinase subunit CKS2 increases cell proliferation rate in gastric cancer.
Kang MA, Kim JT, Kim JH, Kim SY, Kim YH, Yeom YI, Lee Y, Lee HG
Journal of cancer research and clinical oncology 2009 Jun;135(6):761-9
Journal of cancer research and clinical oncology 2009 Jun;135(6):761-9
Gene expression of cyclin-dependent kinase subunit Cks2 is repressed by the tumor suppressor p53 but not by the related proteins p63 or p73.
Rother K, Dengl M, Lorenz J, Tschöp K, Kirschner R, Mössner J, Engeland K
FEBS letters 2007 Mar 20;581(6):1166-72
FEBS letters 2007 Mar 20;581(6):1166-72
Expression of cyclin-dependent kinase subunit 1 (Cks1) is regulated during the cell cycle by a CDE/CHR tandem element and is downregulated by p53 but not by p63 or p73.
Rother K, Li YY, Tschöp K, Kirschner R, Müller GA, Mössner J, Engeland K
Cell cycle (Georgetown, Tex.) 2007 Apr 1;6(7):853-62
Cell cycle (Georgetown, Tex.) 2007 Apr 1;6(7):853-62
Gene expressions and copy numbers associated with metastatic phenotypes of uterine cervical cancer.
Lyng H, Brøvig RS, Svendsrud DH, Holm R, Kaalhus O, Knutstad K, Oksefjell H, Sundfør K, Kristensen GB, Stokke T
BMC genomics 2006 Oct 20;7:268
BMC genomics 2006 Oct 20;7:268
No comments: Submit comment
Supportive validation
- Submitted by
- Invitrogen Antibodies (provider)
- Main image
- Experimental details
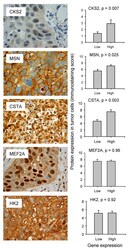
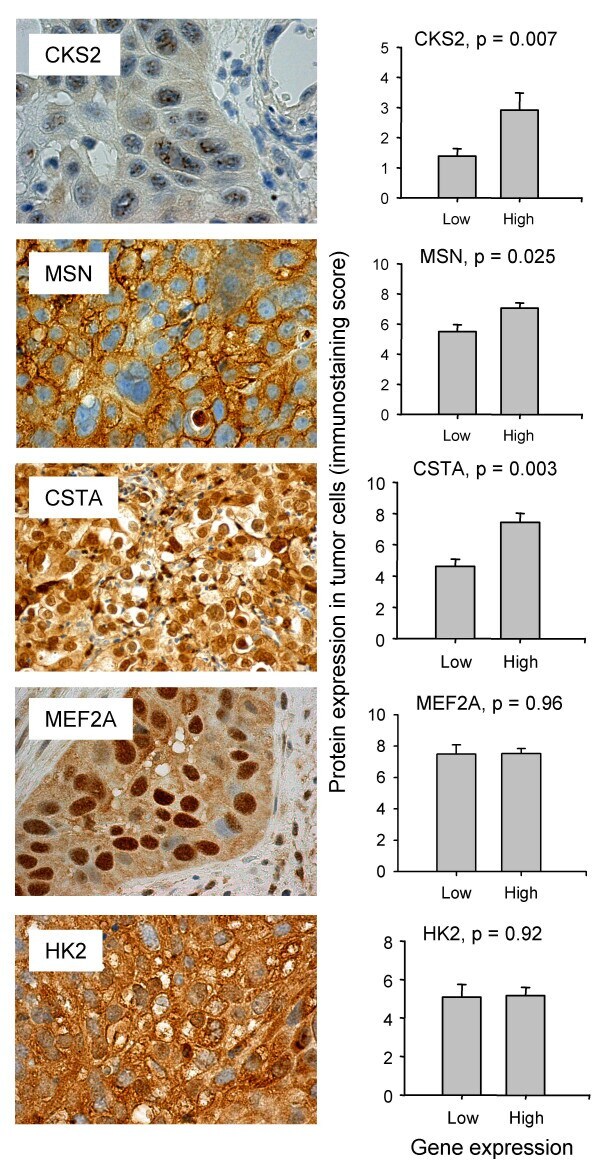
- Figure 3 Protein expressions in relation to gene expressions . Immunostaining of CKS2 (nuclear), MSN (membrane/cytoplasmic), CSTA (nuclear/cytoplasmic), MEF2A (nuclear/cytoplasmic), and HK2 (cytoplasmic) in cervical tumors with high protein levels (left panels) and immunostaining score in 48 cervical tumors with low or high gene expression of CKS2, MSN, CSTA, MEF2A , and HK2 (right panels). MSN, MEF2A, and HK2 were expressed in both tumor and stroma cells, and only the immunostaining in tumor cells is included in the histograms. For CKS2 and CSTA, which were upregulated in node positive tumors, the histograms compares the immunostaining score between the quartile of tumors (n = 12) with the highest gene expression and the remaining 36 ones. For HK2, MEF2A, and MSN, which were downregulated in node positive tumors, the immunostaining score between the quartile of tumors with lowest gene expression and the remaining 36 ones is compared. Columns , mean values for all tumors in the groups; bars , standard errors. P-values for the correlations are indicated.
- Submitted by
- Invitrogen Antibodies (provider)
- Main image
- Experimental details
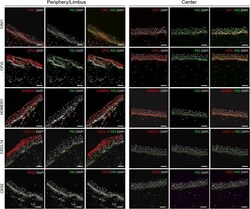
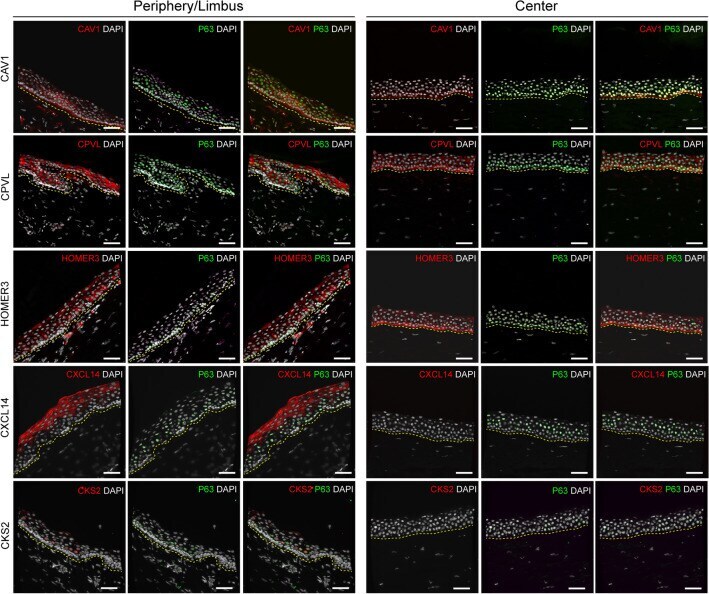
- Figure 4 Immunofluorescence of caveolin-1 ( CAV1 ), CXCL14 and CKS2 (red) on human corneal tissue cryosections confirmed differential protein expression in the limbus/periphery, and absence (CKS2, and CXCL14) or minimal expression (caveolin-1) in the central cornea. Basal corneal epithelial cells retained minimal expression of both DeltaNp63 and caveolin-1, suggesting their limbal origin. HOMER3 and CPVL were expressed in the limbus, but also in the central cornea, where central basal epithelial cells appeared to have higher expression. P63 (DeltaNp63 or p63alpha) was used as a corneal epithelial limbal cell marker (green). Cell nuclei were stained with DAPI (white). The yellow dashed line indicates the boundary between epithelium (above) and stroma (below). Scale bars represent 50 mum.
- Submitted by
- Invitrogen Antibodies (provider)
- Main image

- Experimental details
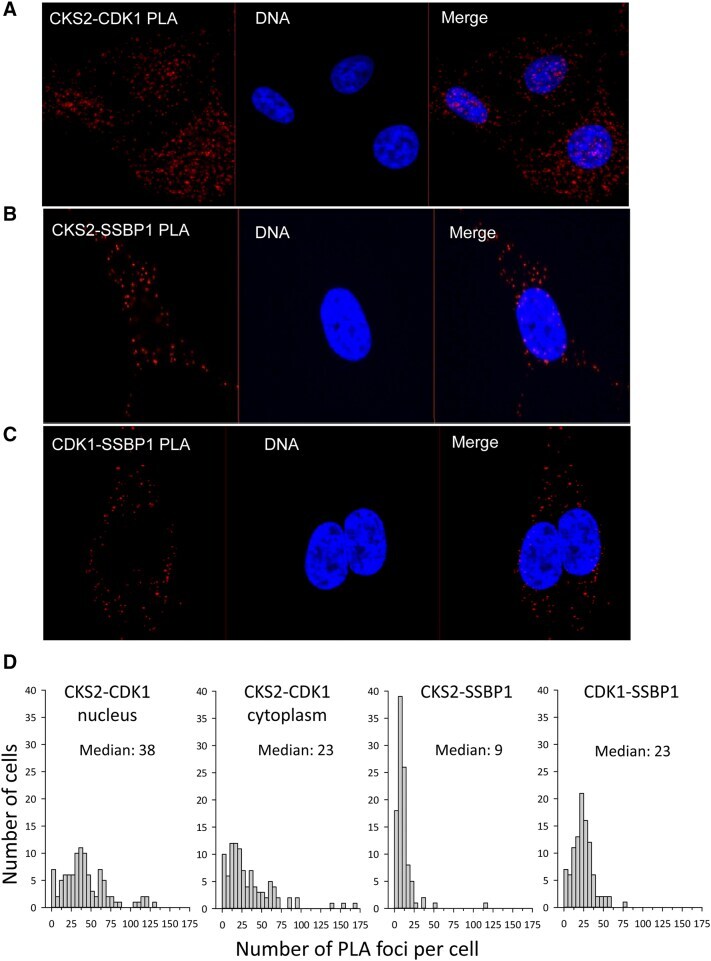
- Figure 2 CKS2, CDK1, and SSBP1 protein-protein complexes in HeLa cells. Immunofluorescence images (maximal projection of z -stacks) of (A) CKS2-CDK1;, (B) CKS2-SSBP1;, and (C) CDK1-SSBP1 PLA foci in interphase cells. The PLA foci are shown in red and DNA in blue. In panel A, foci are present in the nucleus and cytoplasm. In panels B and C, foci are present in the cytoplasm only, including a few lying above the nucleus. (D) Frequency distribution showing number of PLA foci per cell for the foci types in panels A-C. A total of 100 randomly selected interphase cells in an exponentially growing cell culture were counted. For CKS2-CDK1, data for nuclear and cytoplasmic foci are shown separately. Figure 2