Explore
 Validate
 Learn
Learn Western blot
Antibody data
- Antibody Data
- Antigen structure
- References [2]
- Comments [0]
- Validations
- Western blot [3]
- Other assay [3]
Submit
Validation data
Reference
Comment
Report error
- Product number
- PA5-78475 - Provider product page

- Provider
- Invitrogen Antibodies
- Product name
- GLS2 Polyclonal Antibody
- Antibody type
- Polyclonal
- Antigen
- Synthetic peptide
- Description
- Positive Control: Huh-7, HepG2, mouse liver, rat liver Predicted Reactivity: Bovine (100%) Store product as a concentrated solution. Centrifuge briefly prior to opening the vial.
- Reactivity
- Human, Mouse, Rat
- Host
- Rabbit
- Isotype
- IgG
- Vial size
- 100 μL
- Concentration
- 1.17 mg/mL
- Storage
- Store at 4°C short term. For long term storage, store at -20°C, avoiding freeze/thaw cycles.
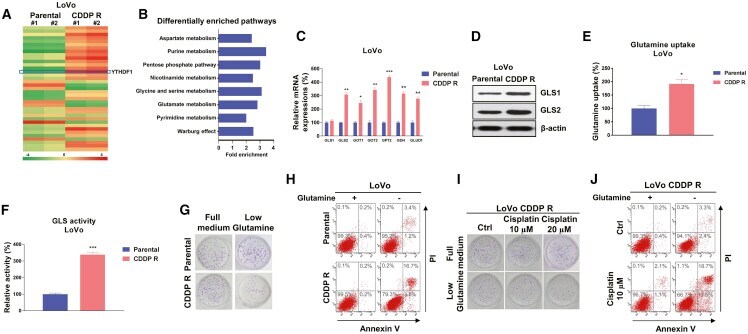
Submitted references Targeting YTHDF1 effectively re-sensitizes cisplatin-resistant colon cancer cells by modulating GLS-mediated glutamine metabolism.
Impact of the acidic environment on gene expression and functional parameters of tumors in vitro and in vivo.
Chen P, Liu XQ, Lin X, Gao LY, Zhang S, Huang X
Molecular therapy oncolytics 2021 Mar 26;20:228-239
Molecular therapy oncolytics 2021 Mar 26;20:228-239
Impact of the acidic environment on gene expression and functional parameters of tumors in vitro and in vivo.
Rauschner M, Lange L, Hüsing T, Reime S, Nolze A, Maschek M, Thews O, Riemann A
Journal of experimental & clinical cancer research : CR 2021 Jan 6;40(1):10
Journal of experimental & clinical cancer research : CR 2021 Jan 6;40(1):10
No comments: Submit comment
Supportive validation
- Submitted by
- Invitrogen Antibodies (provider)
- Main image
- Experimental details
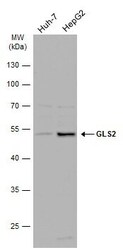
- Western Blot using GLS2 Polyclonal Antibody (Product # PA5-78475). Various whole cell extracts (30 µg) were separated by 10% SDS-PAGE, and the membrane was blotted with GLS2 Polyclonal Antibody (Product # PA5-78475) diluted at 1:1,000. The HRP-conjugated anti-rabbit IgG antibody was used to detect the primary antibody.
- Submitted by
- Invitrogen Antibodies (provider)
- Main image
- Experimental details
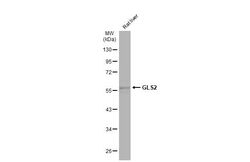
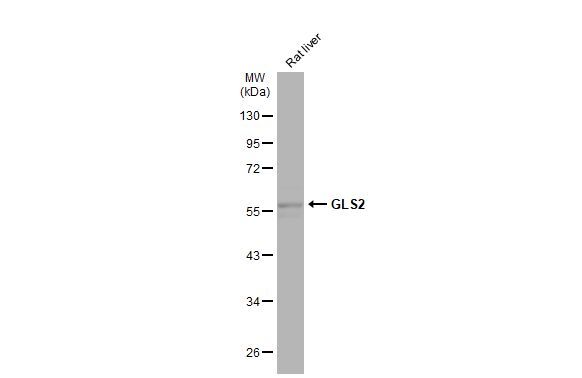
- Western Blot using GLS2 Polyclonal Antibody (Product # PA5-78475). Rat tissue extract (50 µg) was separated by 10% SDS-PAGE, and the membrane was blotted with GLS2 Polyclonal Antibody (Product # PA5-78475) diluted at 1:500. The HRP-conjugated anti-rabbit IgG antibody was used to detect the primary antibody.
- Submitted by
- Invitrogen Antibodies (provider)
- Main image
- Experimental details
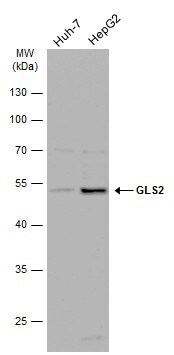
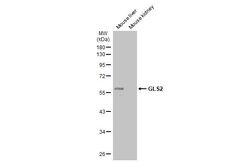
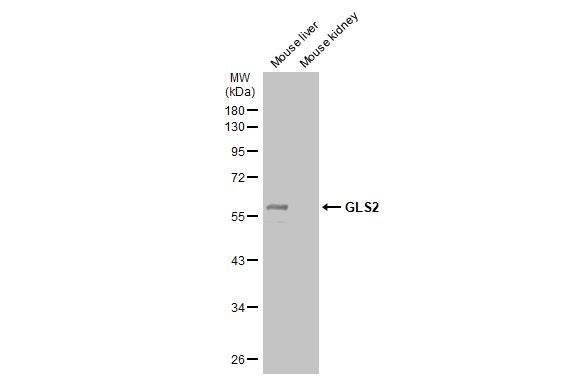
- Western Blot using GLS2 Polyclonal Antibody (Product # PA5-78475). Various tissue extracts (50 µg) were separated by 10% SDS-PAGE, and the membrane was blotted with GLS2 Polyclonal Antibody (Product # PA5-78475) diluted at 1:500. The HRP-conjugated anti-rabbit IgG antibody was used to detect the primary antibody.
Supportive validation
- Submitted by
- Invitrogen Antibodies (provider)
- Main image

- Experimental details
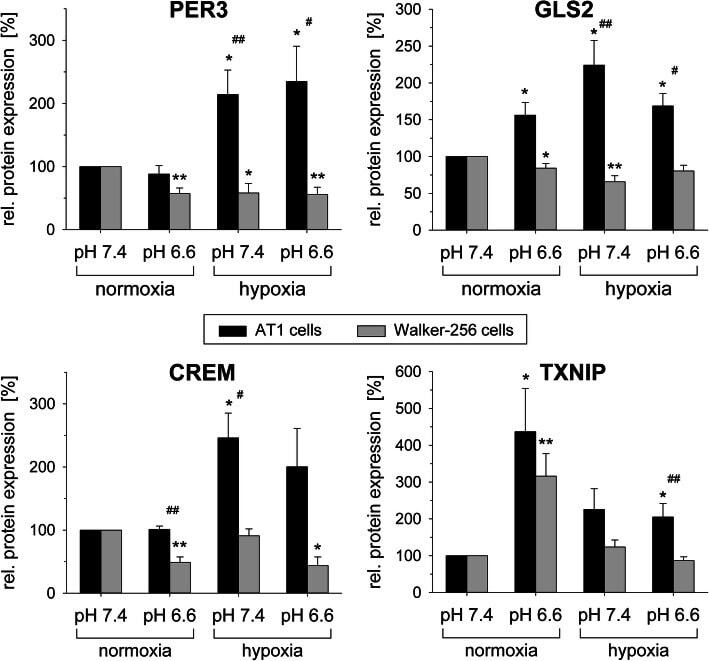
- Fig. 2 Change of protein levels of PER3, GLS2, CREM and TXNIP in AT1 prostate and Walker-256 mammary carcinoma cells after 24 h under acidotic (pH 6.6) and/or hypoxic (pO 2 = 1.5 mmHg) conditions. n = 4-12; (*) p < 0.05, (**) p < 0.01 vs. control; ( # ) p < 0.05, ( ## ) p < 0.01 AT1 vs. Walker-256 cells
- Submitted by
- Invitrogen Antibodies (provider)
- Main image
- Experimental details
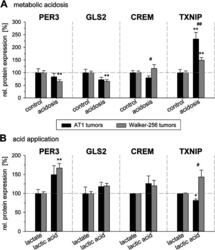
- Fig. 4 Protein levels of PER3, GLS2, CREM and TXNIP in AT1 prostate and Walker-256 mammary carcinoma tumors in vivo 24 h after ( a ) inducing metabolic acidosis by forcing glycolytic metabolism or ( b ) intratumoral injection of lactic acid. n = 4-18; (*) p < 0.05, (**) p < 0.01 vs. control; ( # ) p < 0.05, ( ## ) p < 0.01 AT1 vs. Walker-256 cells

- Submitted by
- Invitrogen Antibodies (provider)
- Main image

- Experimental details
- Figure 3 Cisplatin-resistant CRC cells exhibit elevated glutamine metabolism (A) Heatmap of differentially expressed genes from LoVo parental and CDDP R cells identified by RNA-seq. (B) MetaboAnalyst pathway enrichment analysis of metabolites in LoVo parental and CDDP R cells. (C) mRNA expression levels of glutamine metabolism enzymes and regulators were detected by qRT-PCR in LoVo parental and CDDP R cells. (D) Western blot results show protein expression of GLS1 and GLS2 in LoVo parental and CDDP R cells. (E and F) Glutamine uptake (E) and GLS activity (F) assays were performed in LoVo parental and CDDP R cells. (G) LoVo parental and CDDP R cells were cultured with regular medium or glutamine depletion medium, a clonogenic assay and (H) annexin V assay were performed. (I) LoVo CDDP R cells cultured with regular medium or glutamine depletion medium were treated with cisplatin at 10 and 20 muM for 48 h. (J) Cell viability and cell death were examined by a clonogenic assay and (H) annexin V assay. Columns include mean of three independent experiments; data are presented as mean +- SD. *p < 0.05, **p < 0.01, ***p < 0.001.