Explore
 Validate
 Learn
Learn Western blot
 Immunohistochemistry
Antibody data
- Antibody Data
- Antigen structure
- References [1]
- Comments [0]
- Validations
- Immunohistochemistry [3]
- Other assay [1]
Submit
Validation data
Reference
Comment
Report error
- Product number
- PA5-95207 - Provider product page

- Provider
- Invitrogen Antibodies
- Product name
- GluR1 Polyclonal Antibody
- Antibody type
- Polyclonal
- Antigen
- Recombinant full-length protein
- Description
- Human GRIA1 shares 98% amino acid (aa) sequence identity with both mouse and rat GRIA1. Reconstitute with 0.2 mL of distilled water to yield a concentration of 500 µg/mL. Positive Control - WB: Rat Brain Tissue, Mouse Brain Tissue. IHC: Mouse Brain tissue, Rat Brain tissue, Human Meningeoma tissue.|Store at -20°C for one year from date of receipt. After reconstitution, at 4°C for one month. It can also be aliquotted and stored frozen at -20°C for six months. Avoid repeated freeze-thaw cycles.
- Reactivity
- Human, Mouse, Rat
- Host
- Rabbit
- Isotype
- IgG
- Vial size
- 100 μg
- Concentration
- 500 μg/mL
- Storage
- -20°C
Submitted references Role of Satb1 and Satb2 Transcription Factors in the Glutamate Receptors Expression and Ca(2+) Signaling in the Cortical Neurons In Vitro.
Turovsky EA, Turovskaya MV, Fedotova EI, Babaev AA, Tarabykin VS, Varlamova EG
International journal of molecular sciences 2021 May 31;22(11)
International journal of molecular sciences 2021 May 31;22(11)
No comments: Submit comment
Supportive validation
- Submitted by
- Invitrogen Antibodies (provider)
- Main image
- Experimental details
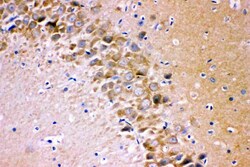
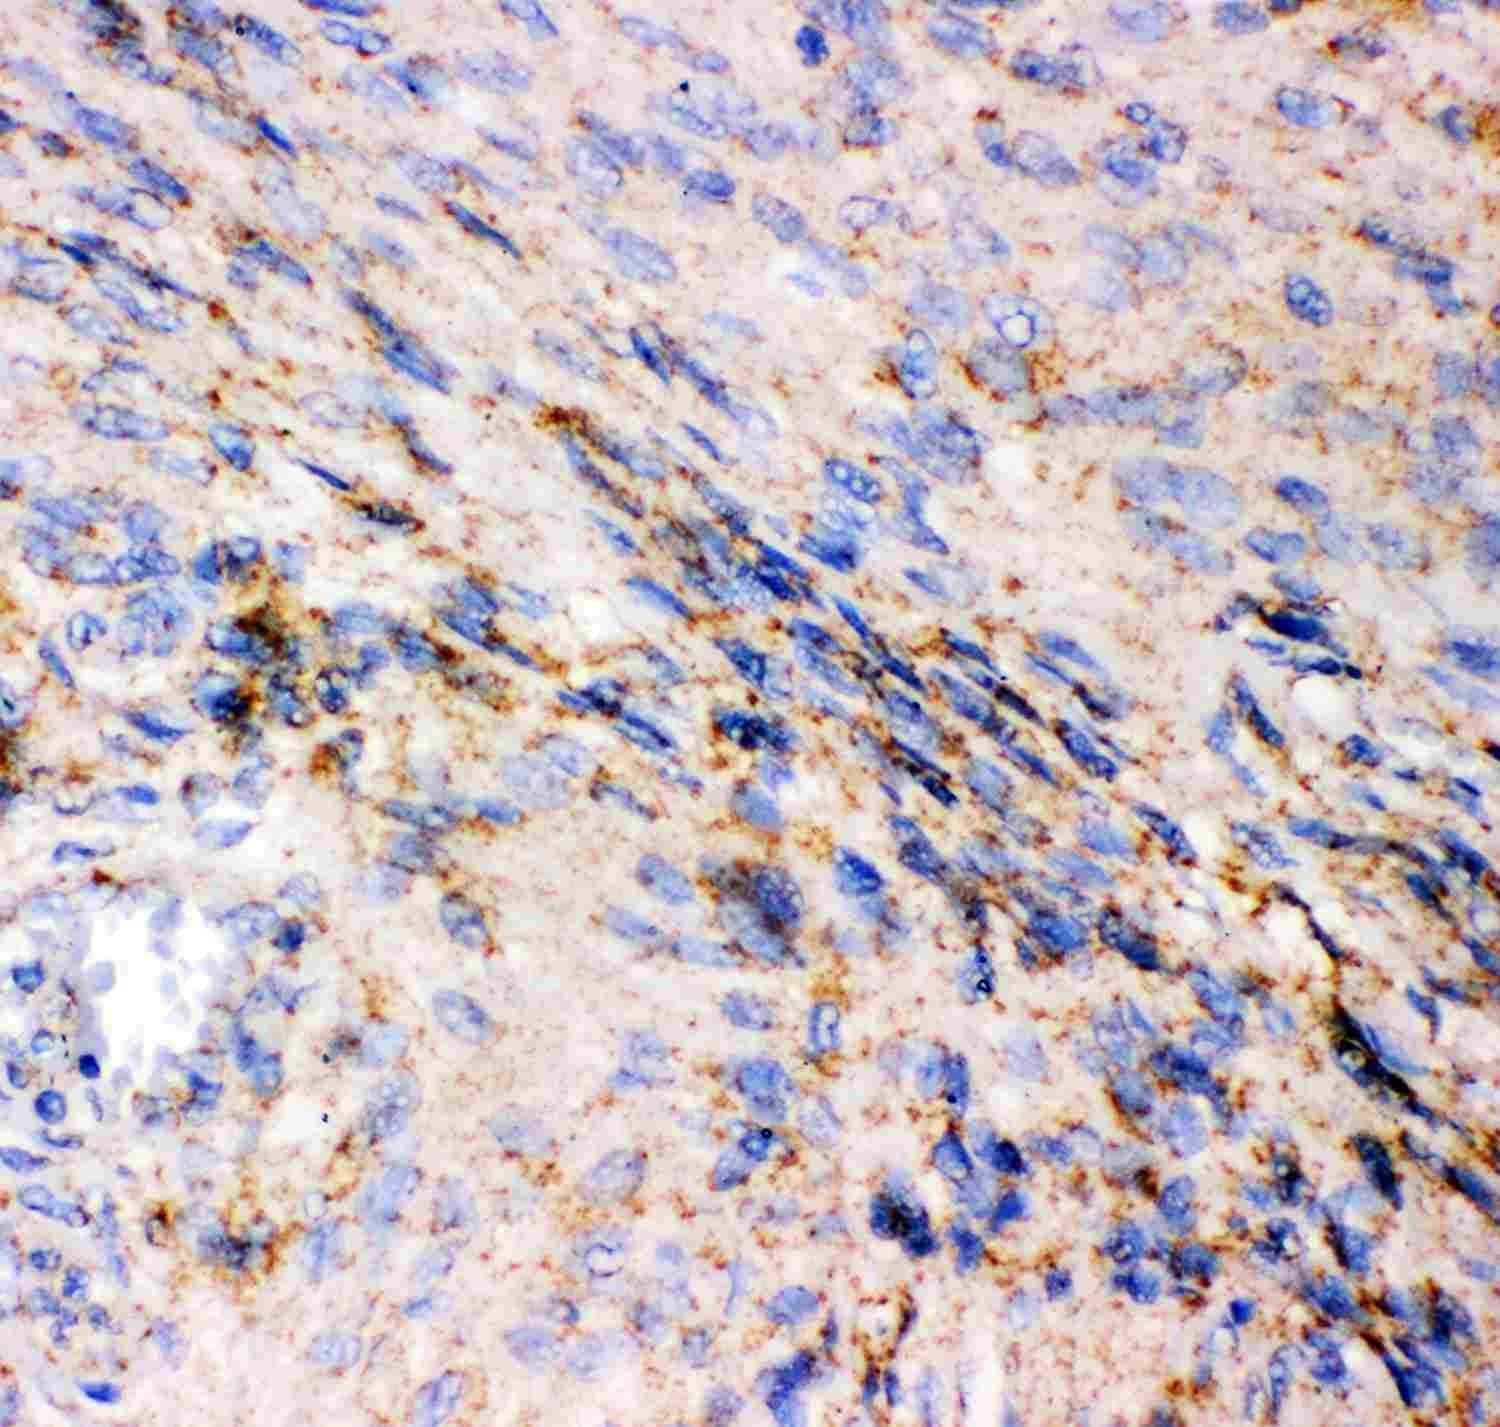
- Immunohistochemistry analysis of GluR1 in paraffin-embedded mouse brain tissue. Antigen retrieval was performed on the tissue using citrate buffer (pH 6, 20 min) and blocked with 10% goat serum. Samples were incubated with GluR1 polyclonal antibody (Product # PA5-95207) at a 1 µg/mL dilution, followed by biotinylated goat anti-rabbit IgG (30 min, 37°C), and developed with Strepavidin-Biotin-Complex and DAB.
- Submitted by
- Invitrogen Antibodies (provider)
- Main image
- Experimental details
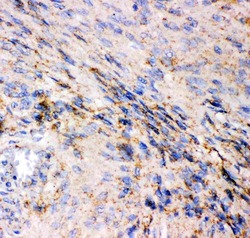
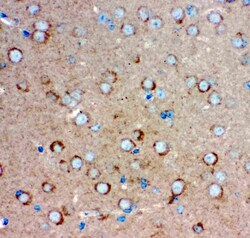
- Immunohistochemistry analysis of GluR1 in paraffin-embedded human meningioma tissue. Antigen retrieval was performed on the tissue using citrate buffer (pH 6, 20 min) and blocked with 10% goat serum. Samples were incubated with GluR1 polyclonal antibody (Product # PA5-95207) at a 1 µg/mL dilution, followed by biotinylated goat anti-rabbit IgG (30 min, 37°C), and developed with Strepavidin-Biotin-Complex and DAB.
- Submitted by
- Invitrogen Antibodies (provider)
- Main image
- Experimental details
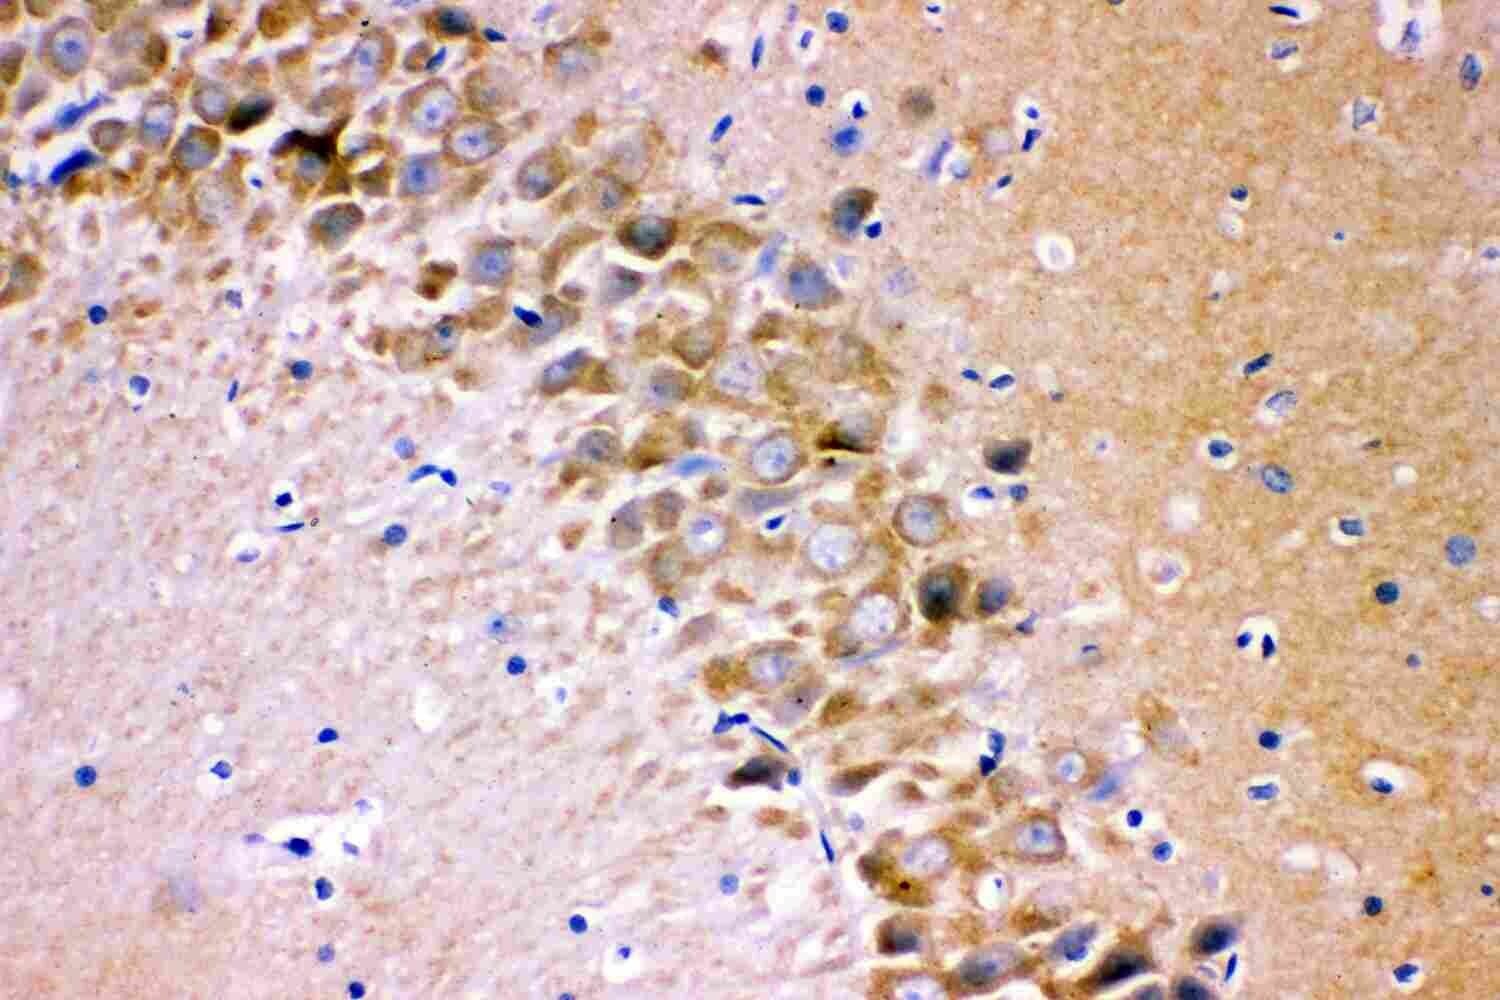
- Immunohistochemistry analysis of GluR1 in paraffin-embedded rat brain tissue. Antigen retrieval was performed on the tissue using citrate buffer (pH 6, 20 min) and blocked with 10% goat serum. Samples were incubated with GluR1 polyclonal antibody (Product # PA5-95207) at a 1 µg/mL dilution, followed by biotinylated goat anti-rabbit IgG (30 min, 37°C), and developed with Strepavidin-Biotin-Complex and DAB.

Supportive validation
- Submitted by
- Invitrogen Antibodies (provider)
- Main image
- Experimental details
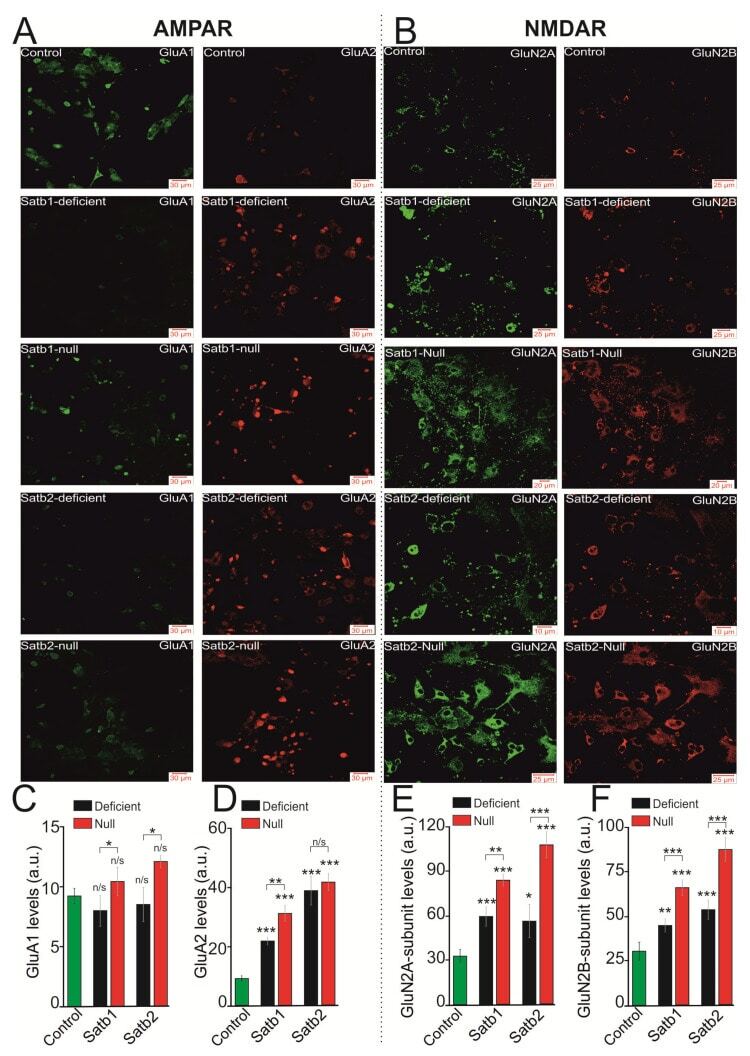
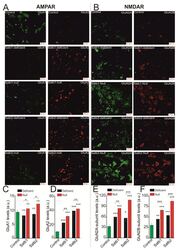
- Figure 3 Expression of subunits forming AMPAR (GluA1, GluA2) and NMDAR (GluN2A, GluN2B) in neurons of the cerebral cortex derived from Satb-deficient, Satb-, and control mice. ( A , B )--Immunostaining of GluA1 (green color), GluA2 (red color) subunits of AMPA receptors ( A ) and GluN2A (green color), GluN2B (red color) of NMDA receptors ( B ) of cortical neurons from control (Satb +/+ * Nex Cre/+ ), Satb-deficient (Satb fl/+ * Nex Cre/+ ) and Satb- (Satb2 fl/fl * Nex Cre/+ ) mice. ( C - F) --The effects of Satb- and Satb2-deletions on the level of GluA1 ( C ), GluA2 ( D ), GluN2A ( E ), and GluN2B ( F ) subunits. Intensity levels of surface-expressed receptor subunits were determined by confocal imaging. We analyzed individual neurons which had fluorescence of Alexa Fluor 633 (GluA1, green color), Alexa Fluor 488 (GluA2, red color) and Alexa Fluor-555 (GluN2B, red color), and Alexa Fluor-594 (GluN2A, green color). The quantitative data reflecting the level of subunits expression are presented as fluorescence intensity values in summary bar charts (mean +- SEM). The values were averaged by 300 +- 50 neurons for each column. Statistical significance was assessed using paired t-test. The results obtained after immunostaining well agree with the data of fluorescent Ca 2+ measurements presented in Figure 4 and Figure 5 . After Ca 2+ measurements, the cells were fixed and stained by the antibodies. We used the scans from three independent view fields for each experimental