Explore
 Validate
 Learn
Learn Western blot
 ELISA
ELISA Other assay
Antibody data
- Antibody Data
- Antigen structure
- References [1]
- Comments [0]
- Validations
- Other assay [1]
Submit
Validation data
Reference
Comment
Report error
- Product number
- PA5-95693 - Provider product page

- Provider
- Invitrogen Antibodies
- Product name
- RHCG Polyclonal Antibody
- Antibody type
- Polyclonal
- Antigen
- Recombinant full-length protein
- Description
- Immunogen sequence: SYHGDSQHRA AINTYCSLAA CVLTSVAISS ALHKKGKLDM VHIQNATLAG GVAVGTAAEM MLMPYGALII GFVCGIISTL GFVYLTPFLE SRLHIQDTCG INNLHGIPGI IGGIVGAVTA ASASLEVYGK EGLVHSFDFQ GFNGDWTART QGKFQIYGLL VTLAMALMGG IIVGLILRLP FWGQPSDENC FEDAVYWEMP EGNSTVYIPE DPTFKPSGPS VPSVPMVSPL PMASSVPLVP; Positive Samples: BxPC-3, DU145, 293T, Mouse kidney, Rat kidney; Cellular Location: Apical cell membrane, Multi-pass membrane protein
- Reactivity
- Human, Mouse, Rat
- Host
- Rabbit
- Isotype
- IgG
- Vial size
- 100 μL
- Concentration
- 0.72 mg/mL
- Storage
- -20°C, Avoid Freeze/Thaw Cycles
Submitted references Comprehensive Proteomic Profiling of Urinary Exosomes and Identification of Potential Non-invasive Early Biomarkers of Alzheimer's Disease in 5XFAD Mouse Model.
Song Z, Xu Y, Zhang L, Zhou L, Zhang Y, Han Y, Li X, Yu P, Qu Y, Zhao W, Qin C
Frontiers in genetics 2020;11:565479
Frontiers in genetics 2020;11:565479
No comments: Submit comment
Supportive validation
- Submitted by
- Invitrogen Antibodies (provider)
- Main image
- Experimental details
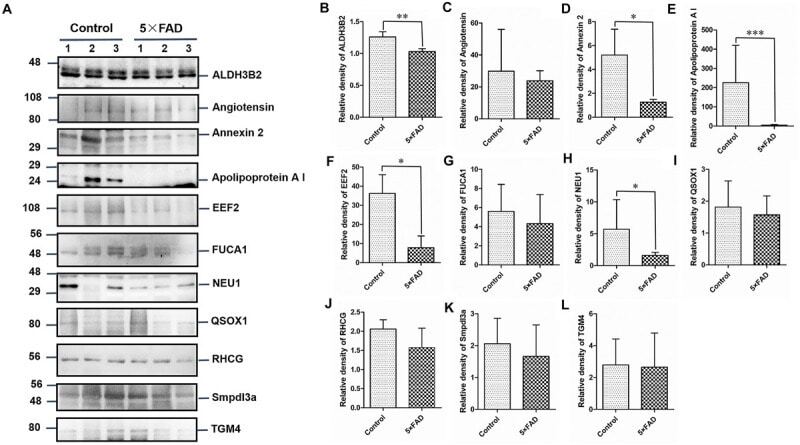
- FIGURE 7 Western blots (WB) and quantitative analysis of the other 11 differential proteins in the urinary exosomes isolated from control and 5XFAD mice. (A) Same aliquot of urinary exosomes isolated from three control samples and three 5XFAD mice samples. ALDH3B2, Angiotensin, Annexin 2, Apolipoprotein A I, EEF2, FUCA1, NEU1, QSOX1, RHCG, Smpdl3a, and TGM4 proteins were detected by WB in sequence. Representative blots of the tested proteins and the molecular weight of standard proteins were presented. (B-L) Quantitative analysis of each of the tested protein's relative fold change, respectively. All data are presented as mean +- SD in triplicate experiments; Student's t -test; * P < 0.05; ** P < 0.01.