 Explore
 Validate
 Learn
Learn Western blot
 Immunocytochemistry
Antibody data
- Antibody Data
- Antigen structure
- References [1]
- Comments [0]
- Validations
- Immunocytochemistry [3]
- Immunohistochemistry [1]
- Other assay [2]
Submit
Validation data
Reference
Comment
Report error
- Product number
- PA5-20904 - Provider product page

- Provider
- Invitrogen Antibodies
- Product name
- BCAS1 Polyclonal Antibody
- Antibody type
- Polyclonal
- Antigen
- Synthetic peptide
- Description
- A suggested positive control is human lung tissue lysate. PA5-20904 can be used with blocking peptide PEP-1018. Antibodies should not be exposed to prolonged high temperatures.
- Reactivity
- Human
- Host
- Rabbit
- Isotype
- IgG
- Vial size
- 100 μg
- Concentration
- 1 mg/mL
- Storage
- 4°C
Submitted references BCAS1-positive immature oligodendrocytes are affected by the α-synuclein-induced pathology of multiple system atrophy.
Kaji S, Maki T, Ueda J, Ishimoto T, Inoue Y, Yasuda K, Sawamura M, Hikawa R, Ayaki T, Yamakado H, Takahashi R
Acta neuropathologica communications 2020 Jul 29;8(1):120
Acta neuropathologica communications 2020 Jul 29;8(1):120
No comments: Submit comment
Supportive validation
- Submitted by
- Invitrogen Antibodies (provider)
- Main image
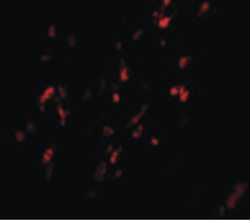
- Experimental details
- Immunofluorescent analysis of human breast carcinoma cells using a BCAS1 polyclonal antibody (Product # PA5-20904) at a 20 µg/mL dilution.
- Submitted by
- Invitrogen Antibodies (provider)
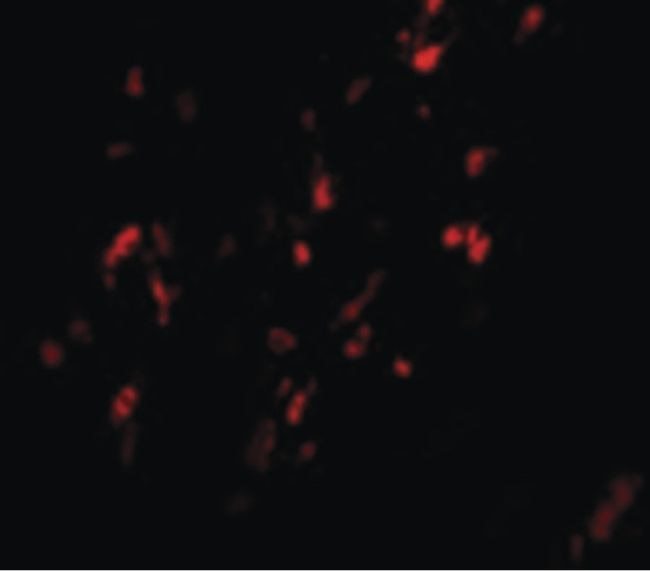
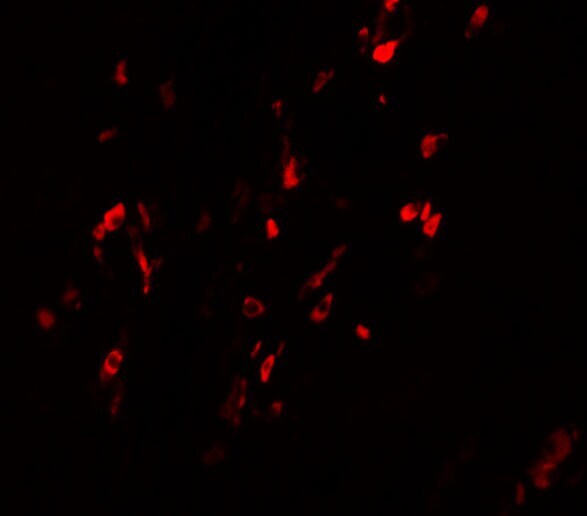
- Main image
- Experimental details
- Immunofluorescence of BCAS1 in Human Breast Carcinoma cells with BCAS1 Polyclonal Antibody (Product # PA5-20904) at 20 µg/mL.

- Submitted by
- Invitrogen Antibodies (provider)
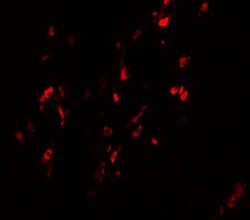
- Main image

- Experimental details
- Immunofluorescence of BCAS1 in Human Breast Carcinoma cells with BCAS1 Polyclonal Antibody (Product # PA5-20904) at 20 µg/mL.
Supportive validation
- Submitted by
- Invitrogen Antibodies (provider)
- Main image
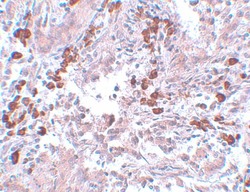
- Experimental details
- Immunohistochemistry of BCAS1 in human breast carcinoma with BCAS1 Polyclonal Antibody (Product # PA5-20904) at 5 µg/mL.

Supportive validation
- Submitted by
- Invitrogen Antibodies (provider)
- Main image
- Experimental details
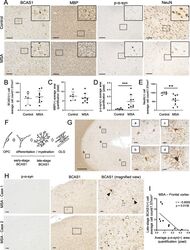
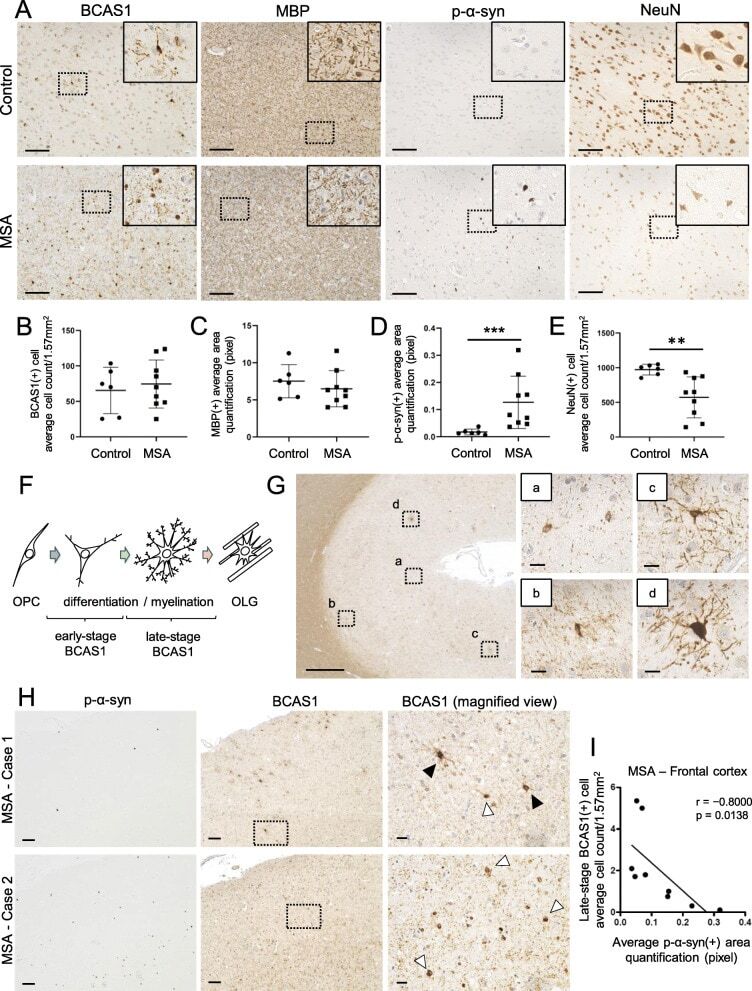
- Fig. 1 The differentiation of BCAS1(+) cells was affected by p-alpha-syn-immunoreactive inclusions in the frontal cortices of MSA brains. a Serial sections of brain tissues from the frontal cortices of an aged non-neurodegenerative disease control (upper) and an MSA patient (lower) which were immunostained with antibodies against BCAS1, MBP, p-alpha-syn, and NeuN. Scale bar = 100 mum. The regions marked by dotted squares are magnified in the right upper corners. The magnified images of BCAS1 staining show altered morphology of BCAS1(+) cells in the MSA case. Images of control and MSA cases are provided from case 21 and case 2 (Additional file 1 : Table S1), respectively. b , e Quantification of BCAS1(+) cell counts ( b ), MBP(+) cell counts ( c ), p-alpha-syn(+) area ( d ), and NeuN(+) cell counts ( e ) in control and MSA brains. Mean +- SEM; control, N = 6, MSA, N = 9; Mann-Whitney, p ** < 0.01, p *** < 0.001. f Illustration of oligodendroglial differentiation showing the morphological classification of early-stage and late-stage BCAS1(+) cells. g Immunostaining of an aged non-neurodegenerative disease control (case 21, Additional file 1 : Table S1) with the anti-BCAS1 antibody showing representative images of early-stage (a, b) and late-stage (c, d) BCAS1(+) cells in the frontal cortex. Scale bar = 500 mum (low-power field, left) and 20 mum (high-power field, right). (H) Immunostaining of the serial sections from the frontal cortices of two different MSA cases (cases 1 and
- Submitted by
- Invitrogen Antibodies (provider)
- Main image
- Experimental details
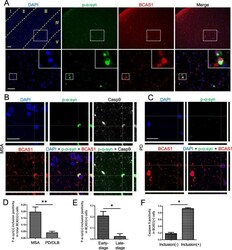
- Fig. 2 p-alpha-Syn-immunoreactive inclusions were present in the cytoplasm of BCAS1(+) cells in MSA brains. a Immunofluorescence staining of an MSA patient brain showing p-alpha-syn-immunoreactive inclusions in the deep layer of the frontal cortex (low-power field images, upper) and the presence of inclusions within the BCAS1(+) cells (high-power field images, lower). The borders between cortical layers were defined by NeuN and Kluver-Barrera (data not shown) staining and are indicated as yellow dotted lines for DAPI staining. The areas marked by white dotted lines in the upper images are magnified in the lower images, where further magnified images of inclusion-positive cells are displayed in the top right corners. Scale bars = 100 mum (upper) and 50 mum (lower). The images are provided from case 2 (Additional file 1 : Table S1). b Confocal images of BCAS1(+) cells in the frontal cortex of an MSA patient showing the cytoplasmic inclusions, which were immunoreactive to antibodies against p-alpha-syn and cleaved caspase-9. Scale bar = 20 mum. The images are provided from case 9 (Additional file 1 : Table S1). c Confocal images of BCAS1(+) cells in the frontal cortex of a PD patient showing no intracellular p-alpha-syn immunoreactivity. Scale bar = 20 mum. The images are provided from case 14 (Additional file 1 : Table S1). d The frequencies of p-alpha-syn-immunoreactive inclusions in the BCAS1(+) cells of MSA brains and PD/DLB brains (frontal cortex) were compared. PD/DLB, N =
