Explore
 Validate
 Learn
Learn Flow cytometry
Antibody data
- Antibody Data
- Antigen structure
- References [23]
- Comments [0]
- Validations
- Flow cytometry [1]
- Other assay [13]
Submit
Validation data
Reference
Comment
Report error
- Product number
- 25-0399-41 - Provider product page

- Provider
- Invitrogen Antibodies
- Product name
- CD39 Monoclonal Antibody (eBioA1 (A1)), PE-Cyanine7, eBioscience™
- Antibody type
- Monoclonal
- Antigen
- Other
- Description
- Description: The eBioA1 monoclonal antibody reacts with human CD39 also known as ectonucleoside triphosphate diphosphohydrolase 1 (ENTPD1) or NTPDase. CD39 is an integral membrane protein with two transmembrane domains and exists as a homotetramer. It is the most prominent ectoenzyme of the immune system. The function of CD39 is to effectively remove toxic extracellular ATP by converting it to ADP or AMP. CD39 is thought to work together with CD73 to hydrolyze ATP and has been well characterized on Langerhans cells. Expression of CD39 was originally identified on activated lymphocytes. Expression is also found on a subset of T cells, B cells and dendritic cells as well as weak staining on monocytes and granulocytes. Recently, CD39 and CD73 have been found on regulatory T cells (Treg). Expression of CD39 on Treg may facilitate their entry into inflamed areas where high levels of ATP are present. Expression of CD39 on Foxp3+CD4+ cells ranges from 25-45%. Applications Reported: This eBioA1 (A1) antibody has been reported for use in flow cytometric analysis. Applications Tested: This eBioA1 (A1) antibody has been pre-titrated and tested by flow cytometric analysis of normal human peripheral blood cells. This can be used at 5 µL (0.25 µg) per test. A test is defined as the amount (µg) of antibody that will stain a cell sample in a final volume of 100 µL. Cell number should be determined empirically but can range from 10^5 to 10^8 cells/test. Light sensitivity: This tandem dye is sensitive photo-induced oxidation. Please protect this vial and stained samples from light. Fixation: Samples can be stored in IC Fixation Buffer (Product # 00-8222) (100 µL cell sample + 100 µL IC Fixation Buffer) or 1-step Fix/Lyse Solution (Product # 00-5333) for up to 3 days in the dark at 4°C with minimal impact on brightness and FRET efficiency/compensation. Some generalizations regarding fluorophore performance after fixation can be made, but clone specific performance should be determined empirically. Excitation: 488-561 nm; Emission: 775 nm; Laser: Blue Laser, Green Laser, Yellow-Green Laser. Filtration: 0.2 µm post-manufacturing filtered.
- Reactivity
- Human
- Host
- Mouse
- Isotype
- IgG
- Antibody clone number
- eBioA1 (A1)
- Vial size
- 25 Tests
- Concentration
- 5 µL/Test
- Storage
- 4° C, store in dark, DO NOT FREEZE!
Submitted references Mesenchymal stem cells transfer mitochondria to allogeneic Tregs in an HLA-dependent manner improving their immunosuppressive activity.
Pinpointing the tumor-specific T cells via TCR clusters.
Neoadjuvant anti-OX40 (MEDI6469) therapy in patients with head and neck squamous cell carcinoma activates and expands antigen-specific tumor-infiltrating T cells.
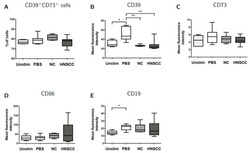
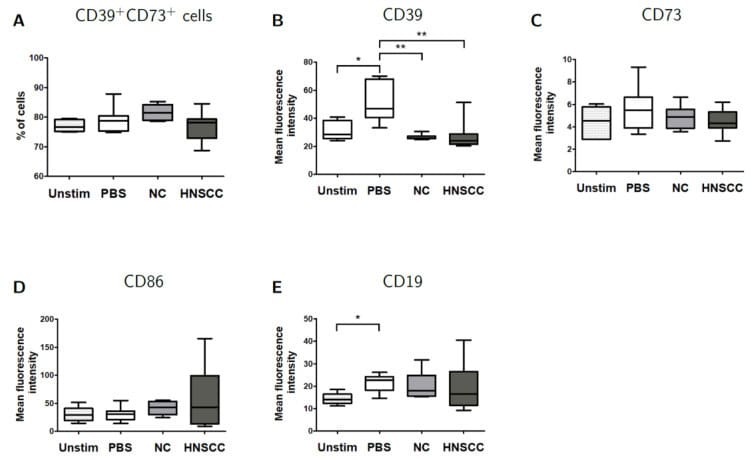
Circulating Exosomes Inhibit B Cell Proliferation and Activity.
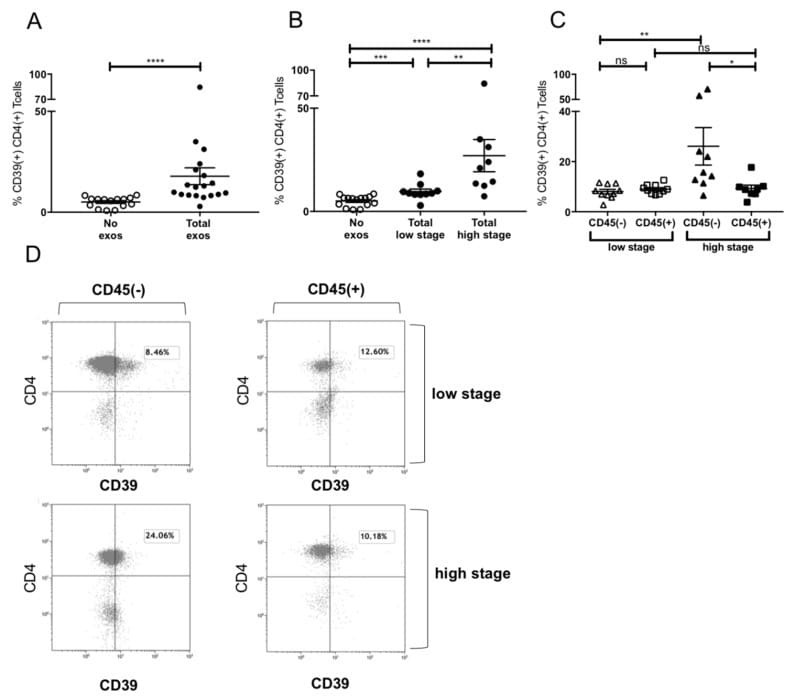
Immune Suppressive Effects of Plasma-Derived Exosome Populations in Head and Neck Cancer.
Molecular profiling of driver events in metastatic uveal melanoma.
Differential Dynamics of Regulatory T-Cell and Th17 Cell Balance in Mesenteric Lymph Nodes and Blood following Early Antiretroviral Initiation during Acute Simian Immunodeficiency Virus Infection.
Co-expression of CD39 and CD103 identifies tumor-reactive CD8 T cells in human solid tumors.
The influence of chemotherapy on adenosine-producing B cells in patients with head and neck squamous cell carcinoma.
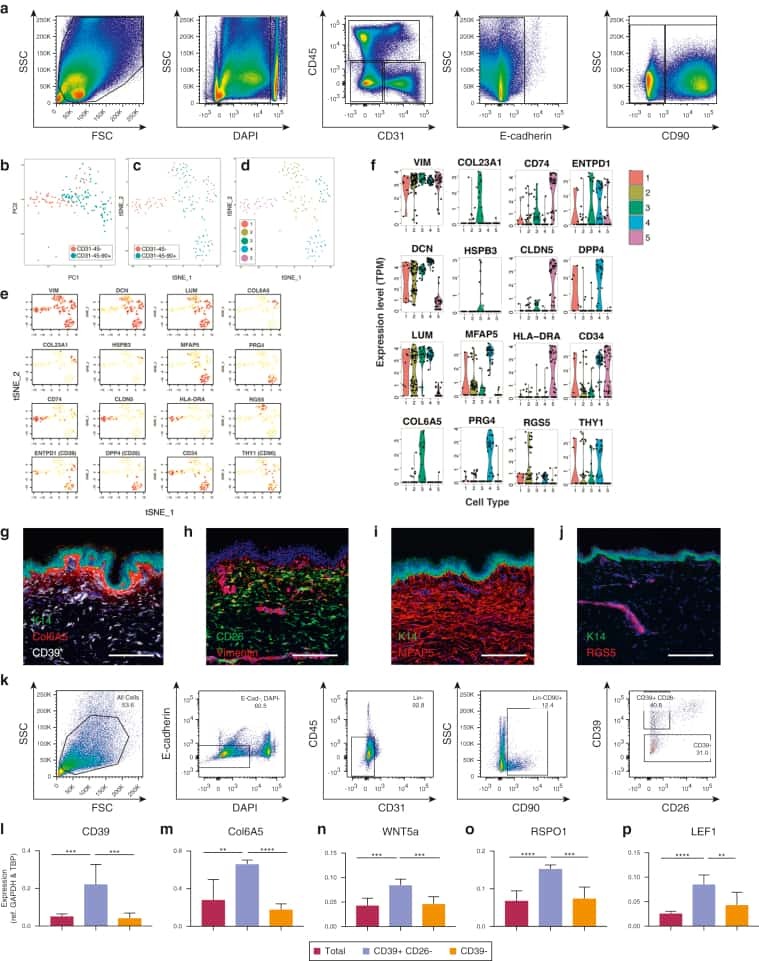
Spatial and Single-Cell Transcriptional Profiling Identifies Functionally Distinct Human Dermal Fibroblast Subpopulations.
Two separate effects contribute to regulatory T cell defect in systemic lupus erythematosus patients and their unaffected relatives.
Circulating gluten-specific FOXP3(+)CD39(+) regulatory T cells have impaired suppressive function in patients with celiac disease.
Impaired P2X1 Receptor-Mediated Adhesion in Eosinophils from Asthmatic Patients.
Tumor-derived exosomes regulate expression of immune function-related genes in human T cell subsets.
Correlation of low CD73 expression on synovial lymphocytes with reduced adenosine generation and higher disease severity in juvenile idiopathic arthritis.
PD-L1 Blockade Differentially Impacts Regulatory T Cells from HIV-Infected Individuals Depending on Plasma Viremia.
Interleukin-6 receptor blockade enhances CD39+ regulatory T cell development in rheumatoid arthritis and in experimental arthritis.
Galectin-9 and IL-21 mediate cross-regulation between Th17 and Treg cells during acute hepatitis C.
Ribavirin Does Not Impair the Suppressive Activity of Foxp3(+)CD4(+)CD25(+) Regulatory T Cells.
OMIP-006: phenotypic subset analysis of human T regulatory cells via polychromatic flow cytometry.
Bet v 1-specific T-cell receptor/forkhead box protein 3 transgenic T cells suppress Bet v 1-specific T-cell effector function in an activation-dependent manner.
Monitoring of antigen-specific CD8 T cells in patients with type 1 diabetes treated with antiCD3 monoclonal antibodies.
Immunohistochemical markers for quantitative studies of neurons and glia in human neocortex.
Piekarska K, Urban-Wójciuk Z, Kurkowiak M, Pelikant-Małecka I, Schumacher A, Sakowska J, Spodnik JH, Arcimowicz Ł, Zielińska H, Tymoniuk B, Renkielska A, Siebert J, Słomińska E, Trzonkowski P, Hupp T, Marek-Trzonkowska NM
Nature communications 2022 Feb 14;13(1):856
Nature communications 2022 Feb 14;13(1):856
Pinpointing the tumor-specific T cells via TCR clusters.
Goncharov MM, Bryushkova EA, Sharaev NI, Skatova VD, Baryshnikova AM, Sharonov GV, Karnaukhov V, Vakhitova MT, Samoylenko IV, Demidov LV, Lukyanov S, Chudakov DM, Serebrovskaya EO
eLife 2022 Apr 4;11
eLife 2022 Apr 4;11
Neoadjuvant anti-OX40 (MEDI6469) therapy in patients with head and neck squamous cell carcinoma activates and expands antigen-specific tumor-infiltrating T cells.
Duhen R, Ballesteros-Merino C, Frye AK, Tran E, Rajamanickam V, Chang SC, Koguchi Y, Bifulco CB, Bernard B, Leidner RS, Curti BD, Fox BA, Urba WJ, Bell RB, Weinberg AD
Nature communications 2021 Feb 16;12(1):1047
Nature communications 2021 Feb 16;12(1):1047
Circulating Exosomes Inhibit B Cell Proliferation and Activity.
Schroeder JC, Puntigam L, Hofmann L, Jeske SS, Beccard IJ, Doescher J, Laban S, Hoffmann TK, Brunner C, Theodoraki MN, Schuler PJ
Cancers 2020 Jul 29;12(8)
Cancers 2020 Jul 29;12(8)
Immune Suppressive Effects of Plasma-Derived Exosome Populations in Head and Neck Cancer.
Beccard IJ, Hofmann L, Schroeder JC, Ludwig S, Laban S, Brunner C, Lotfi R, Hoffmann TK, Jackson EK, Schuler PJ, Theodoraki MN
Cancers 2020 Jul 21;12(7)
Cancers 2020 Jul 21;12(7)
Molecular profiling of driver events in metastatic uveal melanoma.
Karlsson J, Nilsson LM, Mitra S, Alsén S, Shelke GV, Sah VR, Forsberg EMV, Stierner U, All-Eriksson C, Einarsdottir B, Jespersen H, Ny L, Lindnér P, Larsson E, Olofsson Bagge R, Nilsson JA
Nature communications 2020 Apr 20;11(1):1894
Nature communications 2020 Apr 20;11(1):1894
Differential Dynamics of Regulatory T-Cell and Th17 Cell Balance in Mesenteric Lymph Nodes and Blood following Early Antiretroviral Initiation during Acute Simian Immunodeficiency Virus Infection.
Yero A, Farnos O, Rabezanahary H, Racine G, Estaquier J, Jenabian MA
Journal of virology 2019 Oct 1;93(19)
Journal of virology 2019 Oct 1;93(19)
Co-expression of CD39 and CD103 identifies tumor-reactive CD8 T cells in human solid tumors.
Duhen T, Duhen R, Montler R, Moses J, Moudgil T, de Miranda NF, Goodall CP, Blair TC, Fox BA, McDermott JE, Chang SC, Grunkemeier G, Leidner R, Bell RB, Weinberg AD
Nature communications 2018 Jul 13;9(1):2724
Nature communications 2018 Jul 13;9(1):2724
The influence of chemotherapy on adenosine-producing B cells in patients with head and neck squamous cell carcinoma.
Ziebart A, Huber U, Jeske S, Laban S, Doescher J, Hoffmann TK, Brunner C, Jackson EK, Schuler PJ
Oncotarget 2018 Jan 19;9(5):5834-5847
Oncotarget 2018 Jan 19;9(5):5834-5847
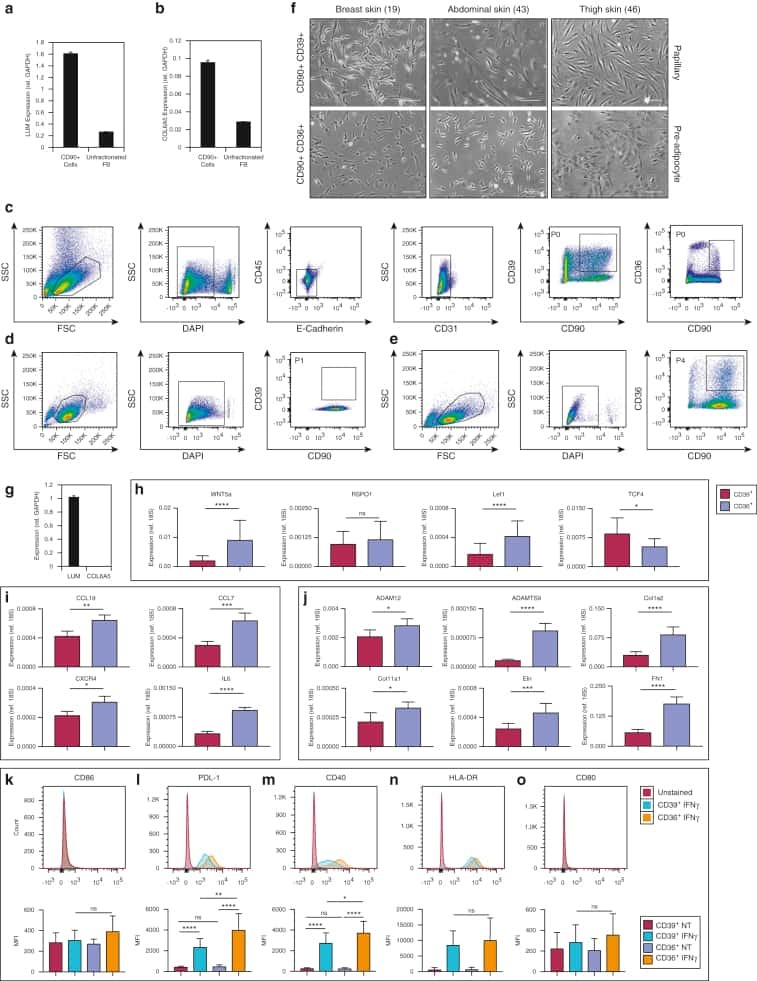
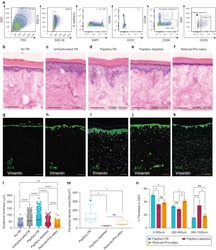
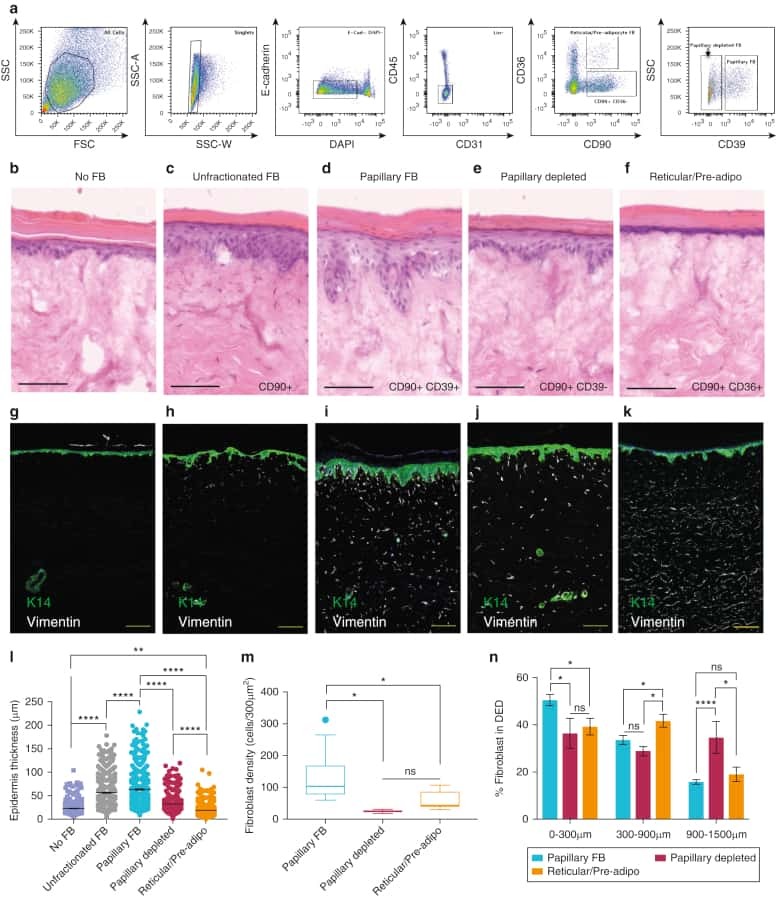
Spatial and Single-Cell Transcriptional Profiling Identifies Functionally Distinct Human Dermal Fibroblast Subpopulations.
Philippeos C, Telerman SB, Oulès B, Pisco AO, Shaw TJ, Elgueta R, Lombardi G, Driskell RR, Soldin M, Lynch MD, Watt FM
The Journal of investigative dermatology 2018 Apr;138(4):811-825
The Journal of investigative dermatology 2018 Apr;138(4):811-825
Two separate effects contribute to regulatory T cell defect in systemic lupus erythematosus patients and their unaffected relatives.
Costa N, Marques O, Godinho SI, Carvalho C, Leal B, Figueiredo AM, Vasconcelos C, Marinho A, Moraes-Fontes MF, Gomes da Costa A, Ponte C, Campanilho-Marques R, Cóias T, Martins AR, Viana JF, Lima M, Martins B, Fesel C
Clinical and experimental immunology 2017 Sep;189(3):318-330
Clinical and experimental immunology 2017 Sep;189(3):318-330
Circulating gluten-specific FOXP3(+)CD39(+) regulatory T cells have impaired suppressive function in patients with celiac disease.
Cook L, Munier CML, Seddiki N, van Bockel D, Ontiveros N, Hardy MY, Gillies JK, Levings MK, Reid HH, Petersen J, Rossjohn J, Anderson RP, Zaunders JJ, Tye-Din JA, Kelleher AD
The Journal of allergy and clinical immunology 2017 Dec;140(6):1592-1603.e8
The Journal of allergy and clinical immunology 2017 Dec;140(6):1592-1603.e8
Impaired P2X1 Receptor-Mediated Adhesion in Eosinophils from Asthmatic Patients.
Wright A, Mahaut-Smith M, Symon F, Sylvius N, Ran S, Bafadhel M, Muessel M, Bradding P, Wardlaw A, Vial C
Journal of immunology (Baltimore, Md. : 1950) 2016 Jun 15;196(12):4877-84
Journal of immunology (Baltimore, Md. : 1950) 2016 Jun 15;196(12):4877-84
Tumor-derived exosomes regulate expression of immune function-related genes in human T cell subsets.
Muller L, Mitsuhashi M, Simms P, Gooding WE, Whiteside TL
Scientific reports 2016 Feb 4;6:20254
Scientific reports 2016 Feb 4;6:20254
Correlation of low CD73 expression on synovial lymphocytes with reduced adenosine generation and higher disease severity in juvenile idiopathic arthritis.
Botta Gordon-Smith S, Ursu S, Eaton S, Moncrieffe H, Wedderburn LR
Arthritis & rheumatology (Hoboken, N.J.) 2015 Feb;67(2):545-54
Arthritis & rheumatology (Hoboken, N.J.) 2015 Feb;67(2):545-54
PD-L1 Blockade Differentially Impacts Regulatory T Cells from HIV-Infected Individuals Depending on Plasma Viremia.
Peligero C, Argilaguet J, Güerri-Fernandez R, Torres B, Ligero C, Colomer P, Plana M, Knobel H, García F, Meyerhans A
PLoS pathogens 2015 Dec;11(12):e1005270
PLoS pathogens 2015 Dec;11(12):e1005270
Interleukin-6 receptor blockade enhances CD39+ regulatory T cell development in rheumatoid arthritis and in experimental arthritis.
Thiolat A, Semerano L, Pers YM, Biton J, Lemeiter D, Portales P, Quentin J, Jorgensen C, Decker P, Boissier MC, Louis-Plence P, Bessis N
Arthritis & rheumatology (Hoboken, N.J.) 2014 Feb;66(2):273-83
Arthritis & rheumatology (Hoboken, N.J.) 2014 Feb;66(2):273-83
Galectin-9 and IL-21 mediate cross-regulation between Th17 and Treg cells during acute hepatitis C.
Kared H, Fabre T, Bédard N, Bruneau J, Shoukry NH
PLoS pathogens 2013;9(6):e1003422
PLoS pathogens 2013;9(6):e1003422
Ribavirin Does Not Impair the Suppressive Activity of Foxp3(+)CD4(+)CD25(+) Regulatory T Cells.
Lee J, Choi YS, Shin EC
Immune network 2013 Feb;13(1):25-9
Immune network 2013 Feb;13(1):25-9
OMIP-006: phenotypic subset analysis of human T regulatory cells via polychromatic flow cytometry.
Murdoch DM, Staats JS, Weinhold KJ
Cytometry. Part A : the journal of the International Society for Analytical Cytology 2012 Apr;81(4):281-3
Cytometry. Part A : the journal of the International Society for Analytical Cytology 2012 Apr;81(4):281-3
Bet v 1-specific T-cell receptor/forkhead box protein 3 transgenic T cells suppress Bet v 1-specific T-cell effector function in an activation-dependent manner.
Schmetterer KG, Haiderer D, Leb-Reichl VM, Neunkirchner A, Jahn-Schmid B, Küng HJ, Schuch K, Steinberger P, Bohle B, Pickl WF
The Journal of allergy and clinical immunology 2011 Jan;127(1):238-45, 245.e1-3
The Journal of allergy and clinical immunology 2011 Jan;127(1):238-45, 245.e1-3
Monitoring of antigen-specific CD8 T cells in patients with type 1 diabetes treated with antiCD3 monoclonal antibodies.
Cernea S, Herold KC
Clinical immunology (Orlando, Fla.) 2010 Feb;134(2):121-9
Clinical immunology (Orlando, Fla.) 2010 Feb;134(2):121-9
Immunohistochemical markers for quantitative studies of neurons and glia in human neocortex.
Lyck L, Dalmau I, Chemnitz J, Finsen B, Schrøder HD
The journal of histochemistry and cytochemistry : official journal of the Histochemistry Society 2008 Mar;56(3):201-21
The journal of histochemistry and cytochemistry : official journal of the Histochemistry Society 2008 Mar;56(3):201-21
No comments: Submit comment
Supportive validation
- Submitted by
- Invitrogen Antibodies (provider)
- Main image
- Experimental details
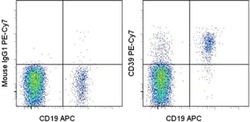
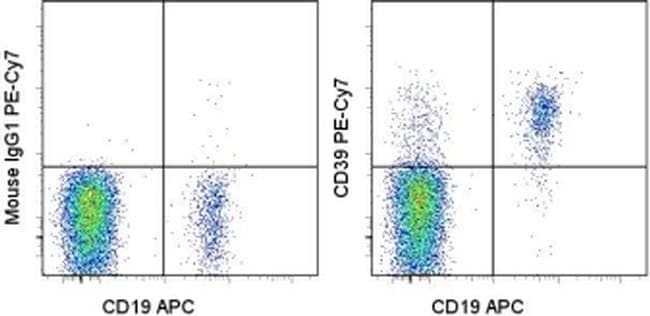
- Staining of normal human peripheral blood cells with Anti-Human CD19 APC (Product # 17-0199-42) and Mouse IgG1 K Isotype Control PE-Cyanine7 (Product # 25-4714-80) (left) or Anti-Human CD39 PE-Cyanine7 (right). Cells in the lymphocyte gate were used for analysis.
Supportive validation
- Submitted by
- Invitrogen Antibodies (provider)
- Main image
- Experimental details
- NULL
- Submitted by
- Invitrogen Antibodies (provider)
- Main image
- Experimental details
- NULL

- Submitted by
- Invitrogen Antibodies (provider)
- Main image
- Experimental details
- NULL
- Submitted by
- Invitrogen Antibodies (provider)
- Main image
- Experimental details
- NULL
- Submitted by
- Invitrogen Antibodies (provider)
- Main image
- Experimental details
- NULL
- Submitted by
- Invitrogen Antibodies (provider)
- Main image

- Experimental details
- NULL
- Submitted by
- Invitrogen Antibodies (provider)
- Main image

- Experimental details
- Figure 5 Induction of CD39+ T reg differentiation by plasma-derived exosomes. ( A ) Expression of CD39 after incubation with total exosome fraction of patients of all stages ( B ) Expression of CD39 after incubation with total exosomes of low stage vs. high stage patients. ( C ) Expression of CD39 after incubation with CD45(-) and CD45(+) exosomes of low stage and high stage patients. Note that only incubation with CD45(-) exosomes showed significant stage-dependent differences. ; n = 18. p values were determined with Mann-Whitney test, with * p < 0.05, ** p < 0.005, **** p < 0.0001. Bars represent standard error of mean (SEM). ( D ) Representative flow cytometry plots depicting CD39 expression of CD4+ T cells after incubation with CD45(-) (left) or CD45(+) (right) exosomes of UICC low stage (top) or high stage (bottom) patients.
- Submitted by
- Invitrogen Antibodies (provider)
- Main image
- Experimental details
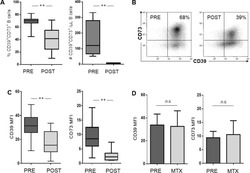
- Figure 5 B cells were harvested after 2 days of co-culture with either NC or HNSCC exosomes or PBS and stained for FACS analysis. ( A ) Frequency of CD39 + CD73 + regulatory B cells. ( B ) The expression of CD39 on B cells was reduced after co-culture with NC or HNSCC exosomes. ( C ) Expression of CD73 on B cells. ( D ) Expression of CD86 on B cells. ( E ) The expression of CD19 on B cells was increased by stimulation with CD40L and IL-4. **: p < 0.01; *: p < 0.05, n = 8 (HNSCC), n = 6 (NC), n = 5 (Unstim). Unstim = Unstimulated B cells, NC = no cancer (exosomes from blood plasma of healthy volunteers), HNSCC, exosomes from blood plasma of HNSCC patients.
- Submitted by
- Invitrogen Antibodies (provider)
- Main image
- Experimental details
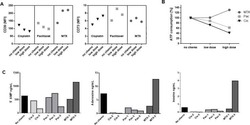
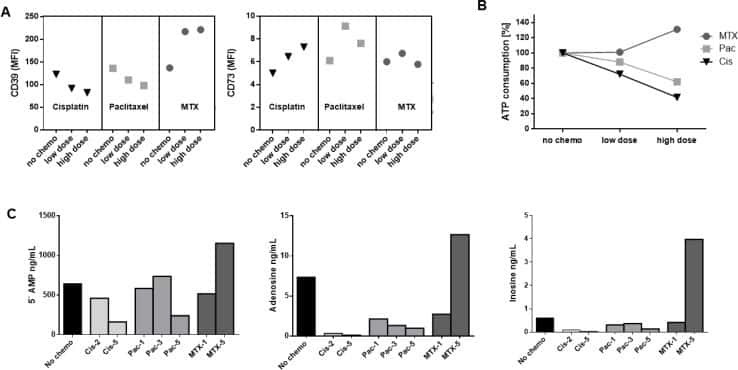
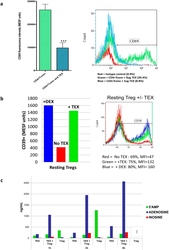
- Figure 7 Effects of TEX on protein expression and functions of T cells. In ( a ) down-regulation of CD69 protein expression on the surface of responder CD4 + Tconv after co-incubation with TEX. Activated CD4 + Tconv were co-incubated with TEX (10 ug protein) produced by the PCI-13 cells or with PBS for 12 h. The CD69 expression levels on CD4 + Tconv were then determined by flow cytometry (MFI) and were converted into MESF units based on calibration curves established with fluorescent calibration beads. The bar graphs show data (mean values +- SD) from 3 independent experiments performed with CD4 + Tconv obtained from different normal donors. The asterisks indicate p values at p < 0.0005. In ( b ) changes in expression levels of CD39 protein on the surface of resting CD4 + CD39 + Treg co-incubated with TEX produced by the PCI-13 cell line or DEX. The exosomes were used at the concentration of 10 ng protein/ assay. Exogenous ATP was added as described in Methods. Flow cytometry ( right ) shows up-regulation of MFI for CD39 in a representative experiment, and the bar graph summarizes results of three experiments performed with Treg obtained from different donors. In ( c ), Production levels of 5' AMP, adenosine and inosine by resting CD4 + CD39 + Treg co-incubated with TEX produced by the PCI-13 cell line. The data are from one of two experiments performed in the presence of exogenous ATP. The analyte levels were measured by mass spectrometry as described in Methods.

- Submitted by
- Invitrogen Antibodies (provider)
- Main image
- Experimental details
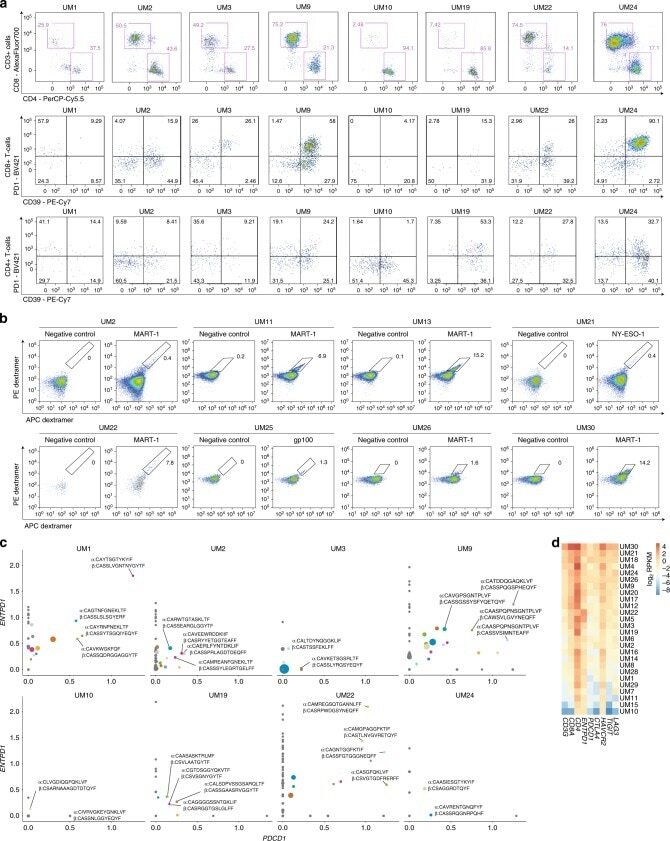
- Fig. 4 Analysis of tumor-infiltrating lymphocytes. a Proportions of CD8 + and CD4 + T cells from biopsy material, and proportions of these that were positive for PD-1 and CD39. Sample UM22 was derived from a patient that has previously been treated with chemotherapy, possibly affecting TIL proportions in this sample. b Assessment of T-cell reactivity against MART-1, gp100 and NY-ESO-1 in yTIL cultures. Proportions found to be reactive are indicated. Samples tested were those with the HLA-A*02:01 genotype, as this genotype is known to present MART-1 and gp100. Samples with this genotype (Supplementary Data 7 ) that are not shown were also tested and found to be negative. c Analysis of relative levels of PDCD1 (PD-1) and ENTPD1 (CD39) expression among different CD8 + T-cell clonotypes, determined by single-cell RNA-seq of yTILs. Clonotypes with one pair of alpha and beta chain were included, and the ones with greatest expression of both markers are highlighted. Point sizes are proportional to clonotype frequency. Gray color indicates clones that were negative for either PDCD1 or ENTPD1 , whereas other colors indicate different clonotypes that correspond to those in Supplementary Fig. 7e . d Expression of T-cell markers and checkpoint receptors in bulk RNA-seq data from biopsies (batch-corrected log 2 RPKM normalized values). yTILs young TILs, TILs isolated and expanded from a biopsy with a low dose of IL-2.
- Submitted by
- Invitrogen Antibodies (provider)
- Main image
- Experimental details
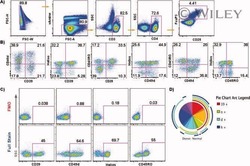
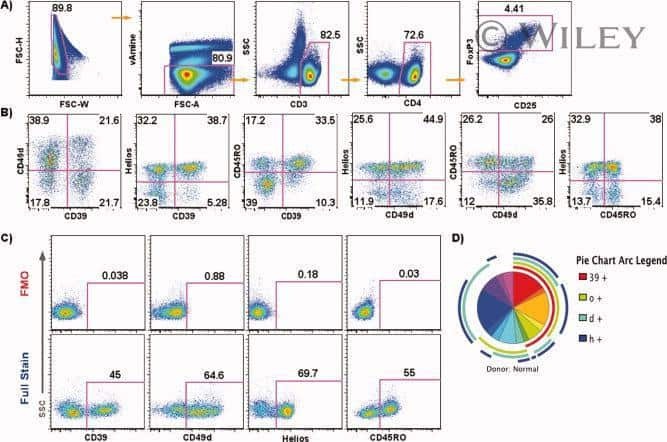
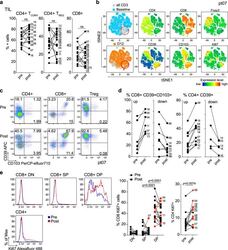
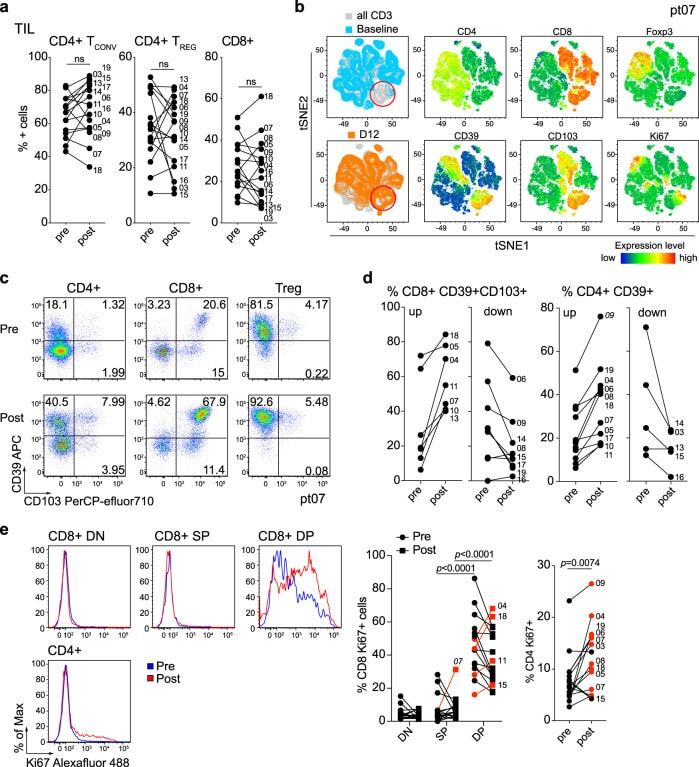
- Fig. 2 Changes in TIL composition after OX40 administration. TIL from a pretreatment biopsy and a surgical specimen after OX40 therapy were assessed for lymphocyte composition and activation markers. The gating strategy is outlined in Supplementary Fig. 3 . a Percentages of CD4+ Tconv cells, CD4+ Treg cells, and CD8+ T cells in each patient before and after OX40 administration, N = 17 patients. b tSNE analysis of the pre and post specimens from patient HNOX07, gated on CD3+ cells. Blue represents the baseline sample, orange the day of surgery sample and gray is the concatenated file. The red circle indicates the population of cells expressing both CD103 and CD39. tSNE analysis was performed on N = 4 patients, one representative patient is shown here, two more patients are shown in Supplementary Fig. 4 . c Flow cytometric analysis of the expression of CD103 and CD39 in CD4+ Tconv cells, CD8+ cells, and CD4+ Treg cells in one immune-responding head and neck squamous cell carcinoma (HNSCC) patient pre- and post OX40 therapy. d Summary of the flow cytometric analysis in (c), left panel depicts CD8+ CD103+ CD39+ T cells and the right panel depicts CD4+ CD39+ T cells; patients with an increase are shown on the left, patients with a decrease are on the right. e Expression of Ki-67 was assessed among memory CD4+ TIL and CD8+ TIL subsets (DN, SP, and DP) in biopsy (pre) and DOS (post) tissue ( N = 17 patients). Blue histograms indicate pre, red indicate post tissues. The left graph sh
- Submitted by
- Invitrogen Antibodies (provider)
- Main image
- Experimental details
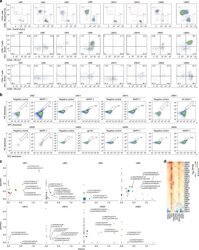
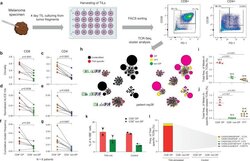
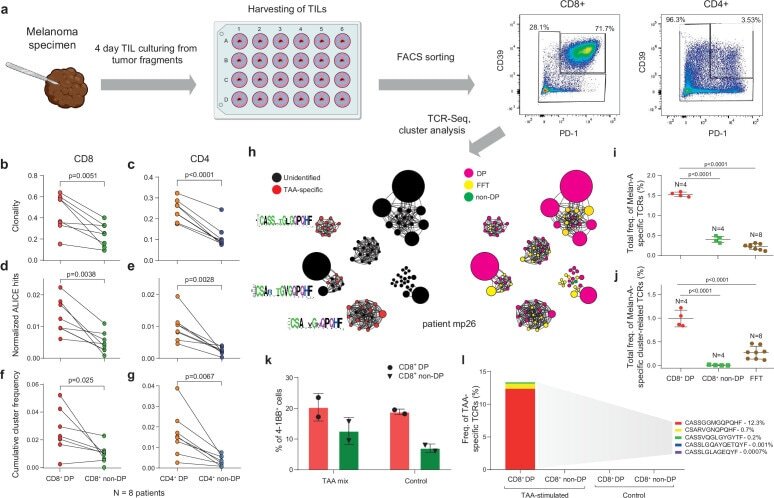
- Figure 2. T cell receptor (TCR) clusters in CD39 + PD1 + tumor-infiltrating lymphocytes (TILs). ( a ) The experimental workflow. ( b-g ) TCRbeta repertoire analysis for CD8 + ( b, d, f ) and CD4 + ( c, e, g ) double-positive (DP) and non-DP TIL subsets sorted from metastatic lymph nodes of eight melanoma patients. Panels show repertoire clonality calculated as [1 - Normalized Shannon-Wiener index] ( b, c ), normalized counts ( d, e ), and cumulative frequency of cluster-related clonotypes, that is, total weight of all clusters as a proportion of TCRbeta repertoire ( f, g ). Paired t-test. ( h ) TCRbeta clusters identified in repertoires obtained from fresh-frozen tumor (FFT) samples, and sorted CD8 + DP and non-DP TILs for HLA-A*02 patient mp26. VDJdb-matched TAA-specific clusters are colored in red. ( i , j ) Cumulative frequency of ( i ) VDJdb-matched TAA-specific clonotypes and ( j ) VDJdb-matched TAA-specific cluster-related clonotypes within CD8 + DP, CD8 + non-DP, and FFT TCRbeta repertoires of patient mp26. One-way ANOVA, Bonferroni multiple comparisons correction. ( k , l ) Proportion of CD137 + cells among CD8 + T cells ( k ) and proportion of VDJdb-matched TAA-specific clonotypes in sorted CD137 + CD8 + T cells ( l ) in DP and non-DP TILs from patient mp26 that were cultured and re-stimulated with TAA-loaded or control dendritic cells. Figure 2--figure supplement 1. ( a ) Fluorescence-activated cell sorting (FACS) gating for sorting of CD8 + and CD4 + CD39 + PD-1 +
- Submitted by
- Invitrogen Antibodies (provider)
- Main image
- Experimental details
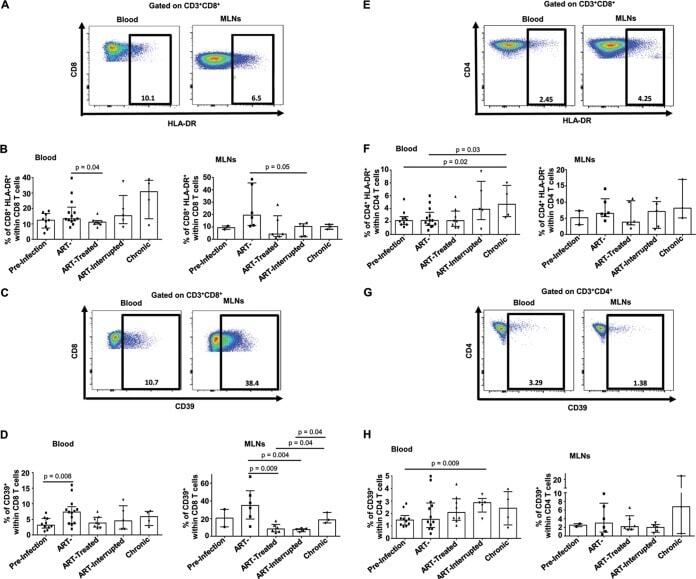
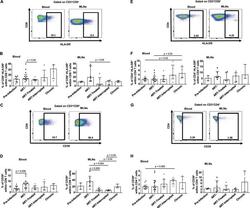
- FIG 2 Effect of early ARV initiation on immune activation. (A and E) Gating strategy used in flow cytometry to define HLA-DR + CD8 and CD4 T cells in both whole blood and MLNs. (B and F) Percentages of activated HLA-DR + CD8 and CD4 T cells among total CD8 and CD4 T cells in whole blood and MLNs. (C and G) Gating strategy used in flow cytometry to define CD39 + CD8 and CD4 T cells in both whole blood and MLNs. (D and H) Percentages of activated CD39 + CD8 and CD4 T cells among total CD8 and CD4 T cells in whole blood and MLNs.