Explore
 Validate
 Learn
Learn Western blot
 Immunocytochemistry
Antibody data
- Antibody Data
- Antigen structure
- References [7]
- Comments [0]
- Validations
- Immunocytochemistry [4]
- Immunohistochemistry [1]
- Flow cytometry [1]
- Other assay [7]
Submit
Validation data
Reference
Comment
Report error
- Product number
- PA5-49431 - Provider product page

- Provider
- Invitrogen Antibodies
- Product name
- Nkx2.5 Polyclonal Antibody
- Antibody type
- Polyclonal
- Antigen
- Synthetic peptide
- Reactivity
- Human, Mouse
- Host
- Rabbit
- Isotype
- IgG
- Vial size
- 200 μL
- Concentration
- 0.48 mg/mL
- Storage
- Store at 4°C short term. For long term storage, store at -20°C, avoiding freeze/thaw cycles.
Submitted references In situ differentiation of human-induced pluripotent stem cells into functional cardiomyocytes on a coaxial PCL-gelatin nanofibrous scaffold.
Human Cardiac Progenitor Cells Enhance Exosome Release and Promote Angiogenesis Under Physoxia.
Activating transcription factor 3 coordinates differentiation of cardiac and hematopoietic progenitors by regulating glucose metabolism.
Fetal Hypoxia Impacts on Proliferation and Differentiation of Sca-1(+) Cardiac Progenitor Cells and Maturation of Cardiomyocytes: A Role of MicroRNA-210.
Single cell RNA-seq and ATAC-seq analysis of cardiac progenitor cell transition states and lineage settlement.
Intercalated cushion cells within the cardiac outflow tract are derived from the myocardial troponin T type 2 (Tnnt2) Cre lineage.
The pro-inflammatory signalling regulator Stat4 promotes vasculogenesis of great vessels derived from endothelial precursors.
Sridharan D, Palaniappan A, Blackstone BN, Dougherty JA, Kumar N, Seshagiri PB, Sayed N, Powell HM, Khan M
Materials science & engineering. C, Materials for biological applications 2021 Jan;118:111354
Materials science & engineering. C, Materials for biological applications 2021 Jan;118:111354
Human Cardiac Progenitor Cells Enhance Exosome Release and Promote Angiogenesis Under Physoxia.
Dougherty JA, Patel N, Kumar N, Rao SG, Angelos MG, Singh H, Cai C, Khan M
Frontiers in cell and developmental biology 2020;8:130
Frontiers in cell and developmental biology 2020;8:130
Activating transcription factor 3 coordinates differentiation of cardiac and hematopoietic progenitors by regulating glucose metabolism.
Yin HM, Yan LF, Liu Q, Peng Z, Zhang CY, Xia Y, Su D, Gu AH, Zhou Y
Science advances 2020 May;6(19):eaay9466
Science advances 2020 May;6(19):eaay9466
Fetal Hypoxia Impacts on Proliferation and Differentiation of Sca-1(+) Cardiac Progenitor Cells and Maturation of Cardiomyocytes: A Role of MicroRNA-210.
Meng X, Zhang P, Zhang L
Genes 2020 Mar 20;11(3)
Genes 2020 Mar 20;11(3)
Single cell RNA-seq and ATAC-seq analysis of cardiac progenitor cell transition states and lineage settlement.
Jia G, Preussner J, Chen X, Guenther S, Yuan X, Yekelchyk M, Kuenne C, Looso M, Zhou Y, Teichmann S, Braun T
Nature communications 2018 Nov 19;9(1):4877
Nature communications 2018 Nov 19;9(1):4877
Intercalated cushion cells within the cardiac outflow tract are derived from the myocardial troponin T type 2 (Tnnt2) Cre lineage.
Mifflin JJ, Dupuis LE, Alcala NE, Russell LG, Kern CB
Developmental dynamics : an official publication of the American Association of Anatomists 2018 Aug;247(8):1005-1017
Developmental dynamics : an official publication of the American Association of Anatomists 2018 Aug;247(8):1005-1017
The pro-inflammatory signalling regulator Stat4 promotes vasculogenesis of great vessels derived from endothelial precursors.
Meng ZZ, Liu W, Xia Y, Yin HM, Zhang CY, Su D, Yan LF, Gu AH, Zhou Y
Nature communications 2017 Mar 3;8:14640
Nature communications 2017 Mar 3;8:14640
No comments: Submit comment
Supportive validation
- Submitted by
- Invitrogen Antibodies (provider)
- Main image
- Experimental details
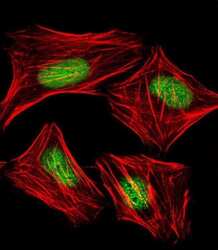
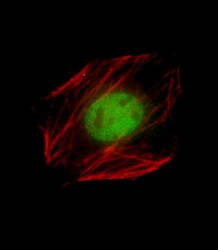
- Immunofluorecent analysis of Mouse Nkx2-5 in human cervical epithelial adenocarcinoma HeLa cells. Cells were fixed, permeabilized and stained with Mouse Nkx2-5 polyclonal antibody (Product # PA5-49431) at a 1:25 dilution, followed by Dylight® 488-conjugated goat rabbit IgG secondary antibody at 1:200 dilution (green). Cytoplasmic actin is detected with Dylight® 554 Phalloidin at 1:100 dilution (red). The nuclear counter stain is DAPI (blue).
- Submitted by
- Invitrogen Antibodies (provider)
- Main image

- Experimental details
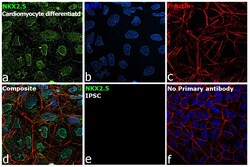
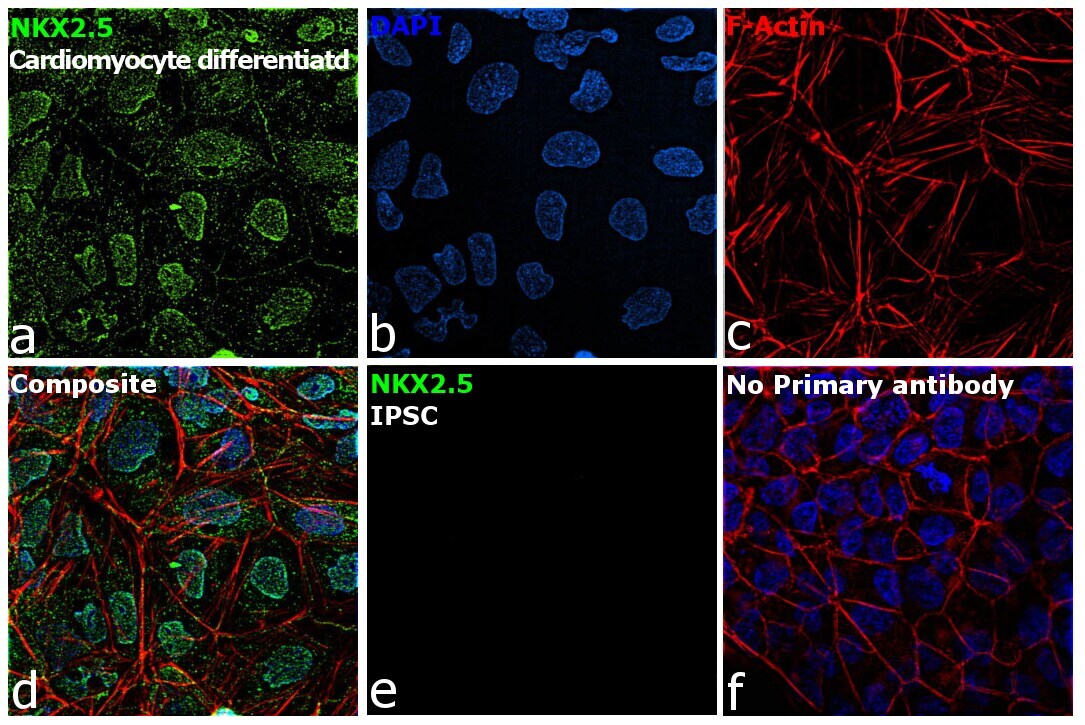
- Immunofluorescence analysis of Homeobox protein Nkx-2.5 was performed using 70% confluent log phase cardiomyocytes differentiated from iPSC cells. The cells were fixed with 4% paraformaldehyde for 10 minutes, permeabilized with 0.1% Triton™ X-100 for 15 minutes, and blocked with 2% BSA for 45 minutes at room temperature. The cells were labeled with Nkx2.5 Polyclonal Antibody (Product # PA5-49431) at 1:100 dilution in 0.1% BSA, incubated at 4 degree celsius overnight and then labeled with Goat anti-Rabbit IgG (H+L) Superclonal™ Recombinant Secondary Antibody, Alexa Fluor® 488 conjugate (Product # A27034), (1:2000 dilution), for 45 minutes at room temperature (Panel a: Green). Nuclei (Panel b: blue) were stained with ProLong™ Diamond Antifade Mountant with DAPI (Product # P36962). F-actin (Panel c: Red) was stained with Rhodamine Phalloidin (Product # R415, 1:300 dilution). Panel d represents the merged image showing nuclear localization. Panel e represents iPSCs. Panel f represents control cells with no primary antibody to assess background. The images were captured at 60X magnification.

- Submitted by
- Invitrogen Antibodies (provider)
- Main image
- Experimental details
- Immunofluorescence analysis of Homeobox protein Nkx-2.5 was performed using 70% confluent log phase cardiomyocytes differentiated from iPSC cells. The cells were fixed with 4% paraformaldehyde for 10 minutes, permeabilized with 0.1% Triton™ X-100 for 15 minutes, and blocked with 2% BSA for 45 minutes at room temperature. The cells were labeled with Nkx2.5 Polyclonal Antibody (Product # PA5-49431) at 1:100 dilution in 0.1% BSA, incubated at 4 degree celsius overnight and then labeled with Goat anti-Rabbit IgG (Heavy Chain) Superclonal™ Recombinant Secondary Antibody, Alexa Fluor® 488 conjugate (Product # A27034), (1:2000 dilution), for 45 minutes at room temperature (Panel a: Green). Nuclei (Panel b: blue) were stained with ProLong™ Diamond Antifade Mountant with DAPI (Product # P36962). F-actin (Panel c: Red) was stained with Rhodamine Phalloidin (Product # R415, 1:300 dilution). Panel d represents the merged image showing nuclear localization. Panel e represents iPSCs. Panel f represents control cells with no primary antibody to assess background. The images were captured at 60X magnification.
- Submitted by
- Invitrogen Antibodies (provider)
- Main image
- Experimental details
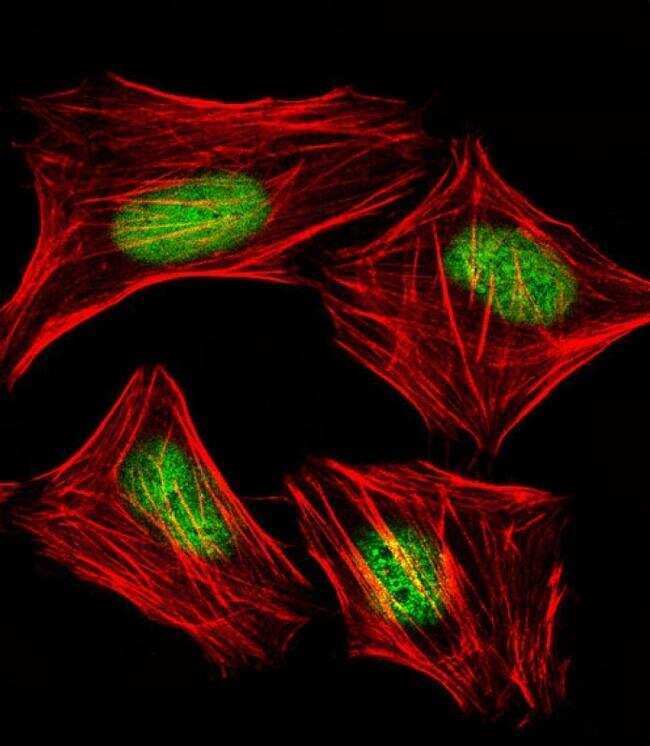
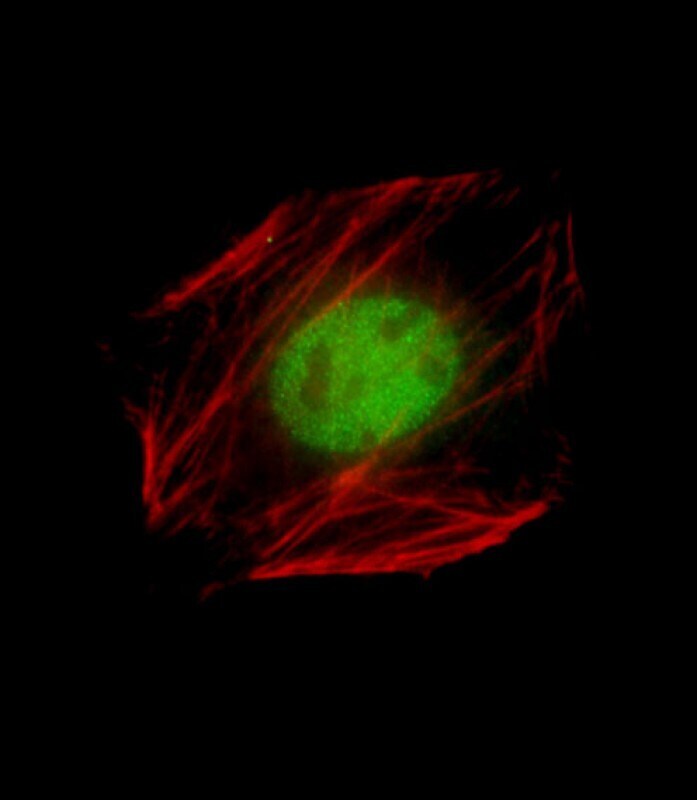
- Immunocytochemistry analysis of Nkx2.5 in C2C12 cells. Samples were incubated with Nkx2.5 polyclonal antibody (Product # PA5-49431) using a dilution of 1:25 followed by Dylight® 488-conjugated goat anti-Rabbit IgG at a dilution of 1:200 (green). Cells were 4% paraformaldehyde-fixed, 0. 1% Triton X-100 permeabilized. Immunofluorescence image showing Nucleus staining on C2C12 cell line. Cytoplasmic actin is detected with Dylight® 554 Phalloidin (red). The nuclear counter stain is DAPI (blue).
Supportive validation
- Submitted by
- Invitrogen Antibodies (provider)
- Main image

- Experimental details
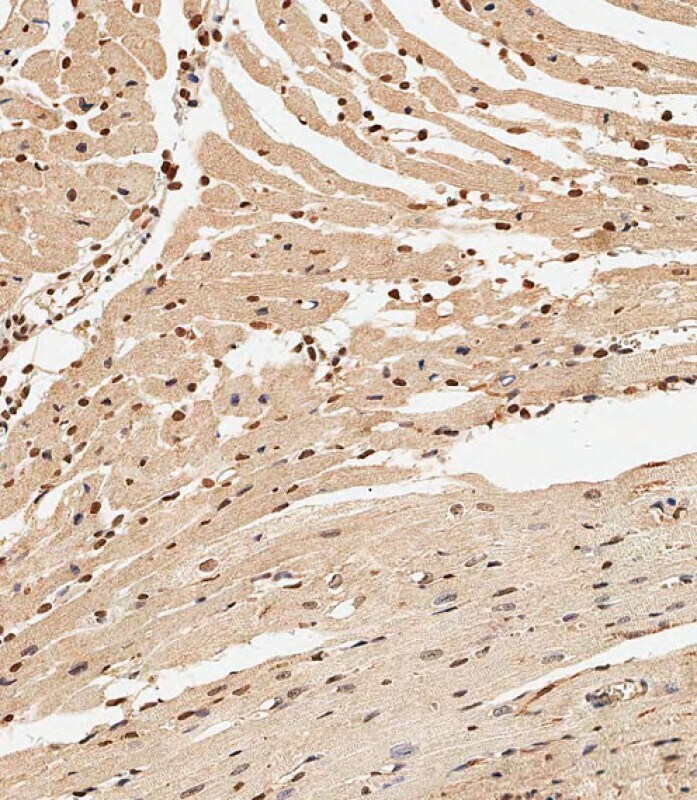
- Immunohistochemistry analysis of Nkx2.5 in paraffin-embedded Mouse heart tissue. Samples were incubated with Nkx2.5 polyclonal antibody (Product # PA5-49431) using a dilution of 1:500 for 1 hour at room temperature followed by an undiluted biotinylated CRF Anti-Polyvalent HRP Polymer antibody. Tissue was fixed with formaldehyde at room temperature, antigen retrieval was by heat mediation with a EDTA buffer (pH 9.0).
Supportive validation
- Submitted by
- Invitrogen Antibodies (provider)
- Main image
- Experimental details
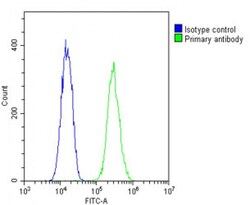
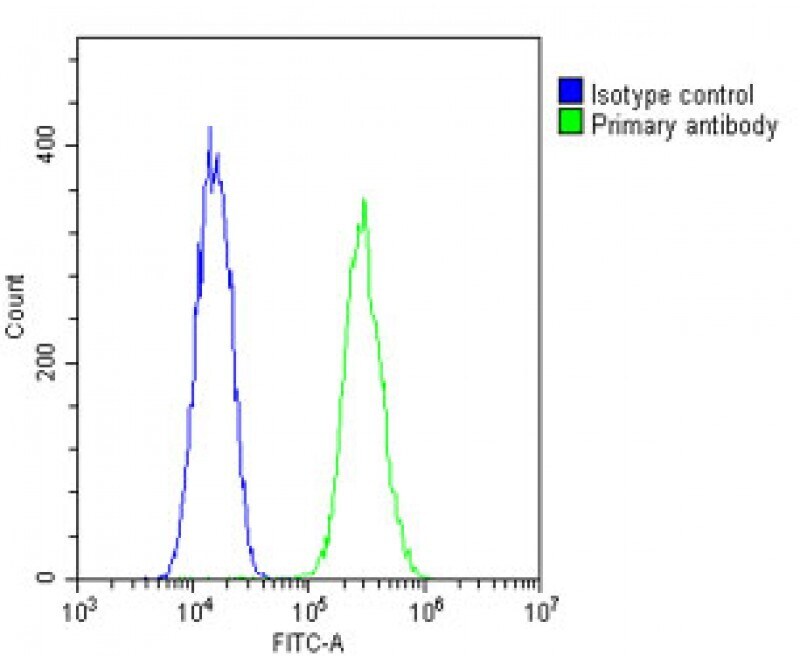
- Flow cytometry of (overlay histogram) of Nkx2.5 in C2C12 cells (green line). Samples were incubated with Nkx2.5 polyclonal antibody (Product # PA5-49431) using a dilution of 1:25 dilution for 60 min at 37°C followed by Goat-Anti-Rabbit IgG, DyLight® 488 Conjugated Highly Cross-Adsorbed at 1:200 dilution for 40 min at Room temperature. The cells were fixed with 2% paraformaldehyde and then permeabilized with 90% methanol for 10 min. The cells were then incubated in 2% bovine serum albumin to block non-specific protein-protein interactions followed by the primary antibody. Isotype control antibody (blue line) was rabbit IgG1 (1 μg/1x10^6 cells) used under the same conditions. Acquisition of >10, 000 events was performed.
Supportive validation
- Submitted by
- Invitrogen Antibodies (provider)
- Main image
- Experimental details
- NULL
- Submitted by
- Invitrogen Antibodies (provider)
- Main image
- Experimental details
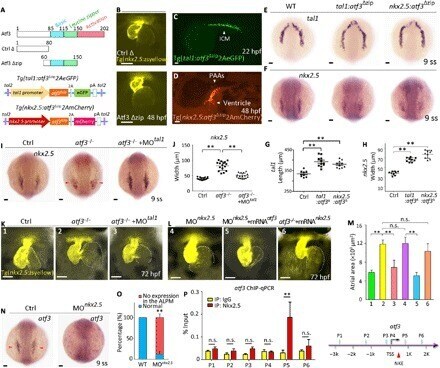
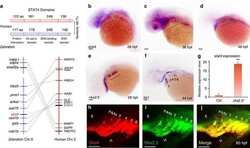
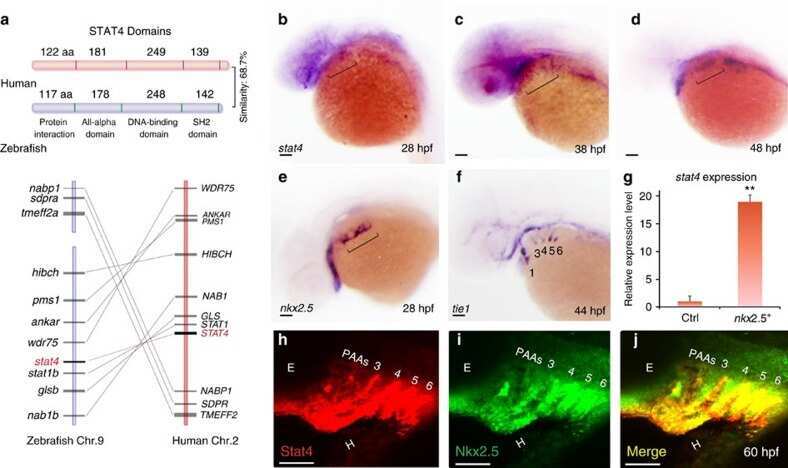
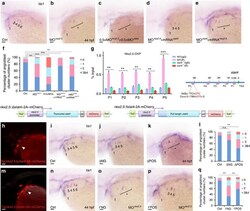
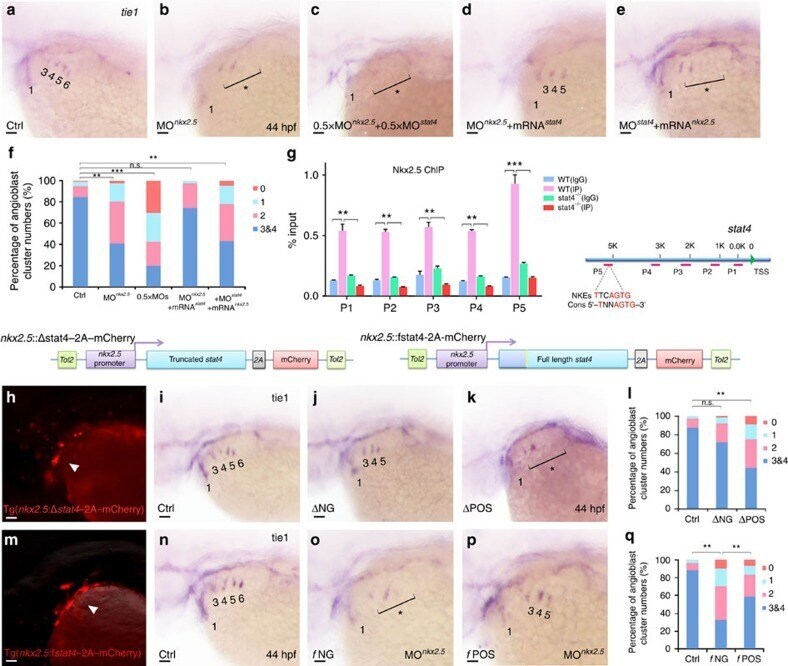
- Figure 6 Cell-autonomous requirement of Stat4 downstream of Nkx2.5. ( a - e ) In situ hybridization analysis of tie1 transcripts in the control ( a ), nkx2.5 morphant embryos ( b ), embryos with half doses of nkx2.5 and stat4 morpholinos ( c ), nkx2.5 morphants with stat4 mRNA ( d ) and stat4 morphants with nkx2.5 mRNA ( e ). ( f ) Proportional quantification of embryos with defective angioblastic cords, Kruskal-Wallis test with the Dunn's multiple comparison test, ** P =30 per each group. ( g ) The ChIP analysis with anti-Nkx2.5 antibody for the promoter regions of stat4 in the wild-type and stat4 mutants at 44 hpf across six experimental replicates ( n =30 embryos/replicate in each group, Kruskal-Wallis test with the Dunn's multiple comparison test, ** P
- Submitted by
- Invitrogen Antibodies (provider)
- Main image
- Experimental details
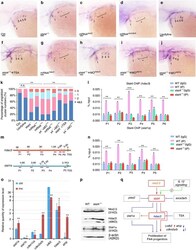
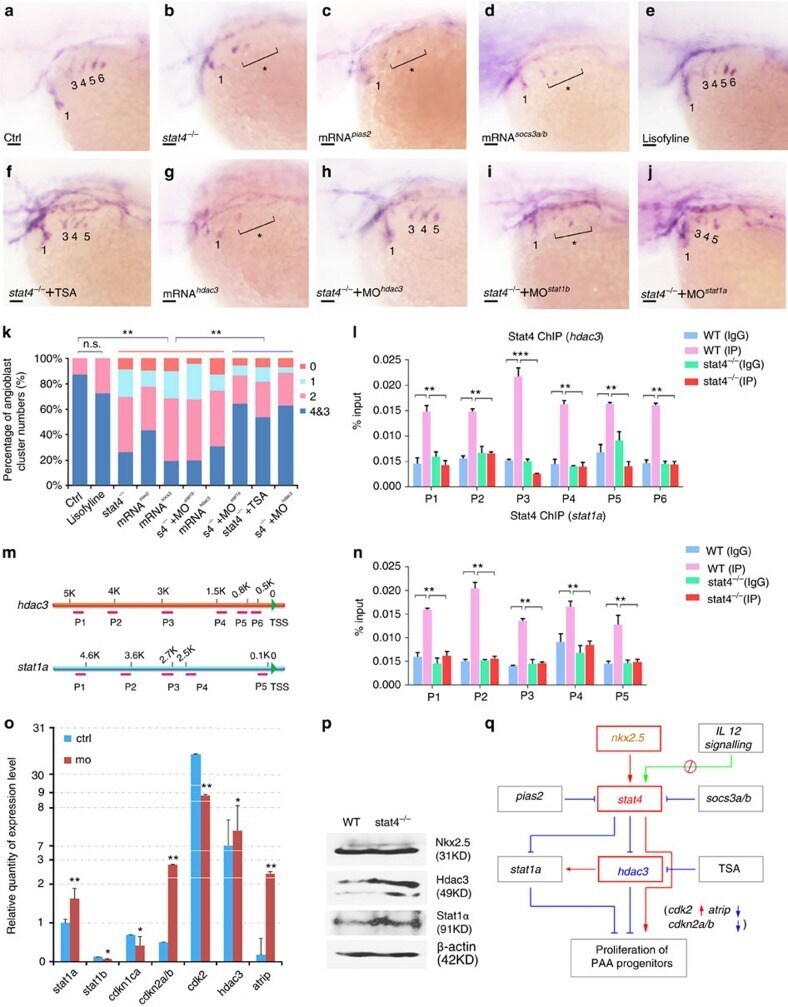
- Figure 7 stat4 promoted the PAA angioblast programme by suppressing stat1a and hdac3. ( a - k ) In situ hybridization analysis of tie1 transcripts in the control ( a ), stat4 mutants ( b ), embryos with 50 ng mul -1 pias2 mRNA injection ( c ), embryos with 50 ng mul -1 socs3a and socs3b mRNAs injection ( d ), embryos treated with 85 muM lisofylline ( e ), stat4 mutants with 0.2 muM TSA treatment ( f ), embryos with 50 ng mul -1 hdac3 mRNA injection ( g ), stat4 mutants with 4 ng mul -1 hdac3 morpholino ( h ), stat4 mutants with 4 ng mul -1 stat1b morpholino ( i ), stat4 mutants with 4 ng mul -1 stat1a morpholino ( j ) at 44 hpf. Scale bars, 50 mum. ( k ) Proportional quantification of indicated tie1 + expressing cords number ( s4 -/- : stat4 mutants), Kruskal-Wallis test with the Dunn's multiple comparison test, ** P 0.05, n >=30 embryos per each group. ( l - n ) The ChIP analysis with anti-Stat4 antibody for the promoter regions of hdac3 and stat1a in the wild-type control and stat4 mutants at 44 hpf across six experimental replicates ( n =30 embryos/replicate in each group, analysis of variance (ANOVA) test with multiple comparison post-hoc test, ** P
- Submitted by
- Invitrogen Antibodies (provider)
- Main image
- Experimental details
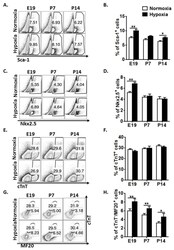
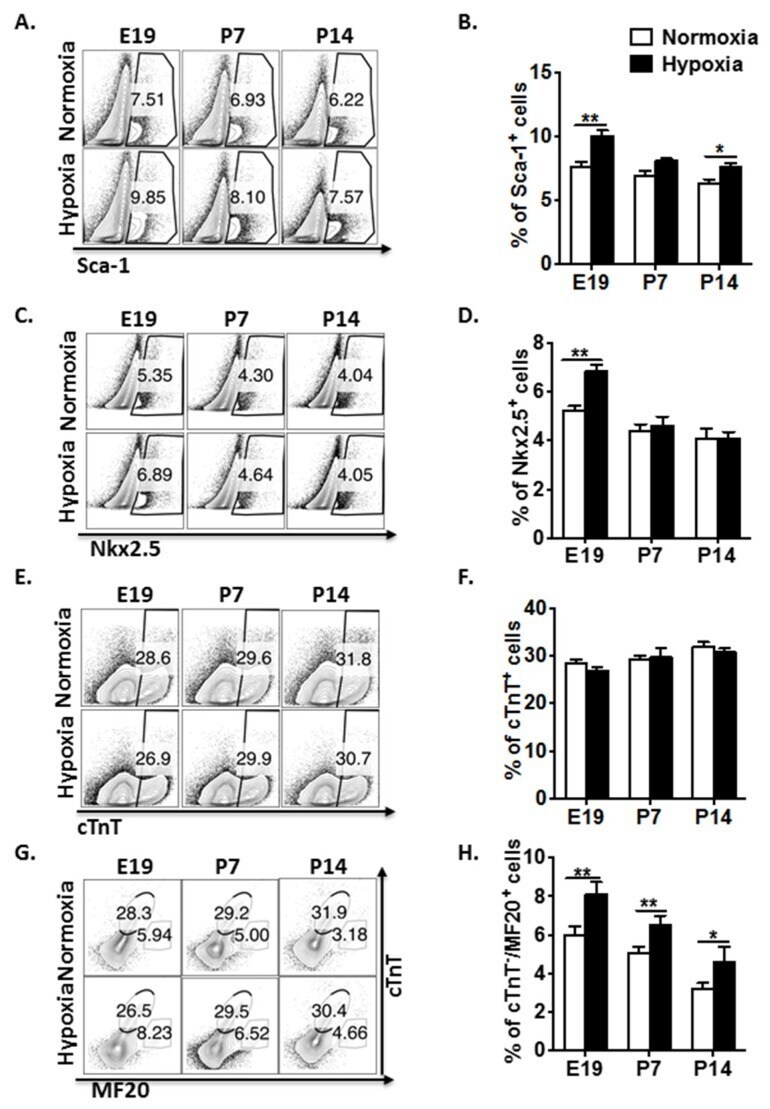
- Figure 1 Hypoxia regulates cardiac progenitor cell (CPC) proliferation and restrains cardiomyocyte maturation in mouse fetal and postnatal hearts. ( A ) Representative flow plots showing the surface Sca-1 staining of cardiac cells after depletion of cardiomyocytes. ( B ) Quantification of the flow plots presented in (A). Data are presented as the mean +- SEM (n = 4). ( C ) Representative flow plots showing the intracellular Nkx2.5 staining of cardiac cells after depletion of cardiomyocytes. ( D ) Quantification of the flow plots presented in (C). Data are presented as the mean +- SEM (n = 4). ( E ) Representative flow plots showing the intracellular cTnT staining of cardiac cells. ( F ) Quantification of the flow plots presented in (E). Data are presented as the mean +- SEM (n = 4). ( G ) Representative flow plots showing the intracellular cTnT and MF20 staining of cardiac cells. ( H ) Quantification of the flow plots presented in (G). Data are presented as the mean +- SEM (n = 4). * p
- Submitted by
- Invitrogen Antibodies (provider)
- Main image
- Experimental details
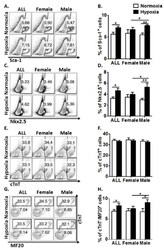
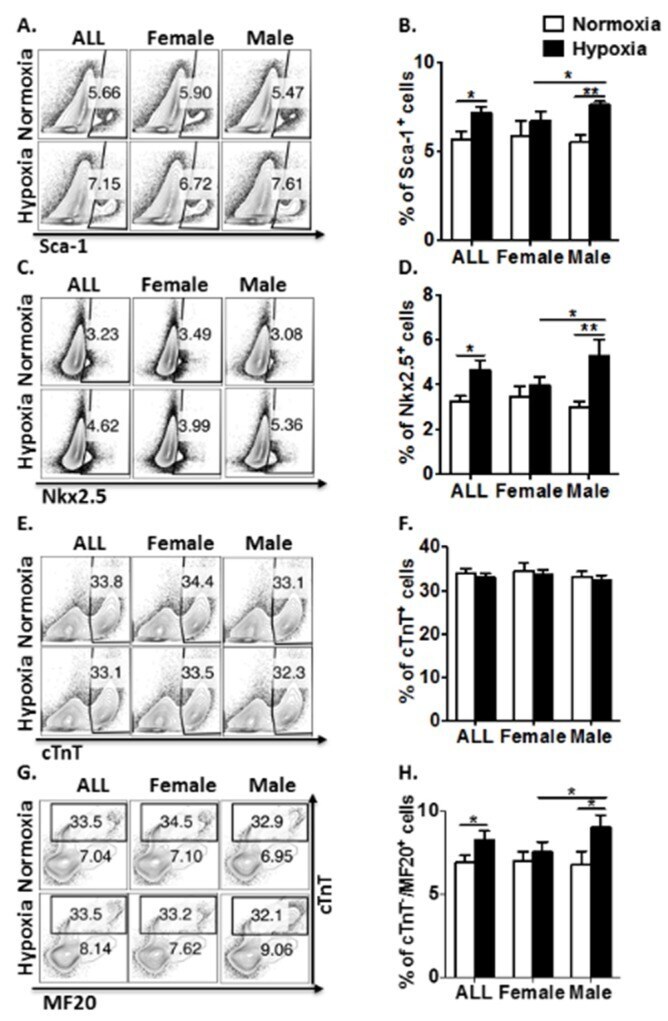
- Figure 2 Prenatal hypoxia regulates CPC proliferation and restrains cardiomyocyte maturation in four-week-old offspring with a gender-related difference. ( A ) Representative flow plots showing the surface Sca-1 staining of cardiac cells after depletion of cardiomyocytes. ( B ) Quantification of the flow plots presented in (A). Data are presented as the mean +- SEM (n = 4). ( C ) Representative flow plots showing the intracellular Nkx2.5 staining of cardiac cells after depletion of cardiomyocytes. ( D ) Quantification of the flow plots presented in (C). Data are presented as the mean +- SEM (n = 4). ( E ) Representative flow plots showing the intracellular cTnT staining of cardiac cells. ( F ) Quantification of the flow plots presented in (E). Data are presented as the mean +- SEM (n = 4). ( G ) Representative flow plots showing the intracellular cTnT and MF20 staining of cardiac cells. ( H ) Quantification of the flow plots presented in ( G ). Data are presented as the mean +- SEM (n = 4). * p
- Submitted by
- Invitrogen Antibodies (provider)
- Main image
- Experimental details
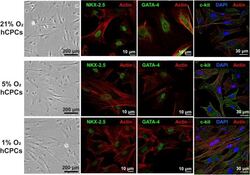
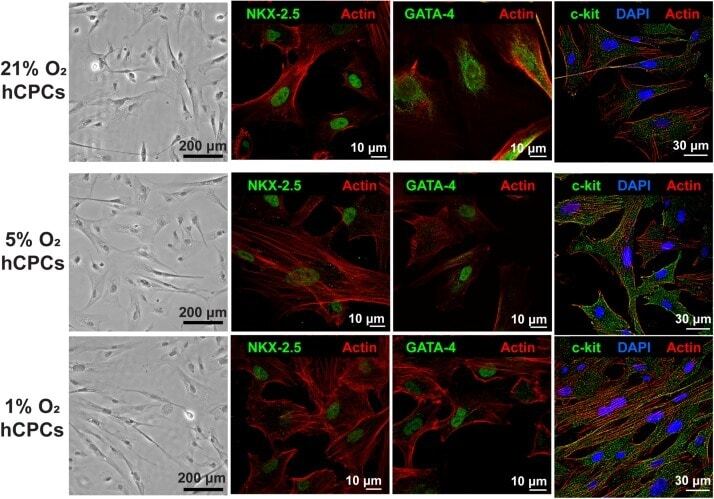
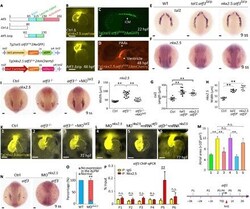
- FIGURE 1 hCPCs morphology and cardiac gene expression under normoxic and hypoxic microenvironments. Human CPCs were cultured under 21, 5, and 1% O 2 for 48 h. DIC imaging shows the typical morphology of cells, which is unchanged under hypoxia. Immunofluorescent staining for cardiac lineage markers NKX-2.5 (green, nuclear), GATA-4 (green, nuclear), and c-kit (green) showed their expression was maintained under all oxygen conditions. Nuclei are stained blue and F-actin is stained red.
- Submitted by
- Invitrogen Antibodies (provider)
- Main image
- Experimental details
- Fig. 4 atf3 autonomously regulated differentiation and mediated the interaction between nkx2.5 and tal1. ( A ) Top: Schematic diagram showing a control fraction of atf3 (Ctrl Delta) and a truncated form of atf3 bereft of the C-terminal activation domain (Atf3 Deltazip) acting as a DN inhibitor, based on previous reports. Bottom: tol2 -mediated transgenesis of tal1 and nkx2.5 promoting atf3 ^zip -eGFP and mCherry expression, respectively. ( B ) Morphological analysis of the embryonic heart in Tg(nkx2.5:ZsYellow) embryos with control atf3 mRNA injection and Tg(nkx2.5:ZsYellow) embryos with atf3 zip mRNA injection at 48 hpf ( n = 30 per group). ( C ) Expression pattern of fluorescence in ICM of the Tg(scl:atf3 ^zip -eGFP) stable line at 22 hpf ( n = 30). ( D ) Expression pattern of fluorescence in the ventricle and PAAs of the Tg(nkx2.5:atf3 ^zip -mCherry) stable line at 48 hpf ( n = 30). ( E ) Expression patterns of tal1 in WT, Tg(tal1: atf3 ^zip 2AeGFP) , and Tg(nkx2.5: atf3 ^zip 2AmCherry) embryos at 9 ss ( n >= 30 per group). ( F ) Expression patterns of nkx2.5 in WT, Tg(tal1: atf3 ^zip 2AeGFP) , and Tg(nkx2.5: atf3 ^zip 2AmCherry) embryos at 9 ss ( n >= 30 per group). ( G ) Statistical analysis of the length of the expression pattern of tal1 in (E) ( n >= 9 for each group), using the Kruskal-Wallis test. Error bars indicated SD. ** P < 0.01. ( H ) Statistical analysis of the width of the expression region of nkx2.5 in (F) ( n >= 9 per group), using the unpaired two-tailed S