Explore
 Validate
 Learn
LearnMA5-26290
antibody from Invitrogen Antibodies
Targeting: PLAAT3
AdPLA, H-REV107-1, HRASLS3, HREV107, HREV107-3, MGC118754., PLA2G16, PLAAT-3
 Western blot
Antibody data
- Antibody Data
- Antigen structure
- References [1]
- Comments [0]
- Validations
- Western blot [1]
- Immunocytochemistry [2]
- Immunohistochemistry [11]
- Other assay [3]
Submit
Validation data
Reference
Comment
Report error
- Product number
- MA5-26290 - Provider product page

- Provider
- Invitrogen Antibodies
- Product name
- HRASLS3 Monoclonal Antibody (OTI1A5)
- Antibody type
- Monoclonal
- Antigen
- Recombinant full-length protein
- Reactivity
- Human
- Host
- Mouse
- Isotype
- IgG
- Antibody clone number
- OTI1A5
- Vial size
- 100 μL
- Concentration
- 1 mg/mL
- Storage
- -20°C, Avoid Freeze/Thaw Cycles
Submitted references PLA2G16 is a mutant p53/KLF5 transcriptional target and promotes glycolysis of pancreatic cancer.
Xia W, Bai H, Deng Y, Yang Y
Journal of cellular and molecular medicine 2020 Nov;24(21):12642-12655
Journal of cellular and molecular medicine 2020 Nov;24(21):12642-12655
No comments: Submit comment
Supportive validation
- Submitted by
- Invitrogen Antibodies (provider)
- Main image

- Experimental details
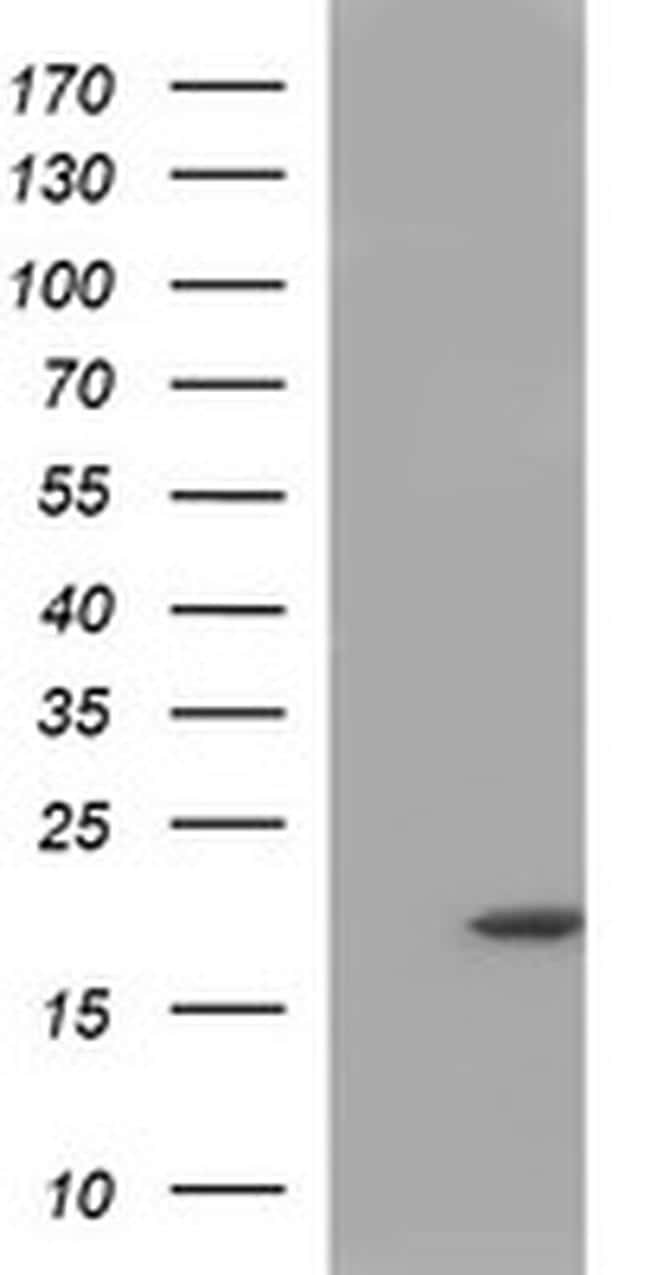
- Western blot analysis of PLA2G16 in HEK293T cells in untransfected (Left lane) and transfected (Right lane) samples using 5 µg per lane. The samples were separated by SDS-PAGE and probed with PLA2G16 (Product # MA5-26290) monoclonal antibody.
Supportive validation
- Submitted by
- Invitrogen Antibodies (provider)
- Main image

- Experimental details
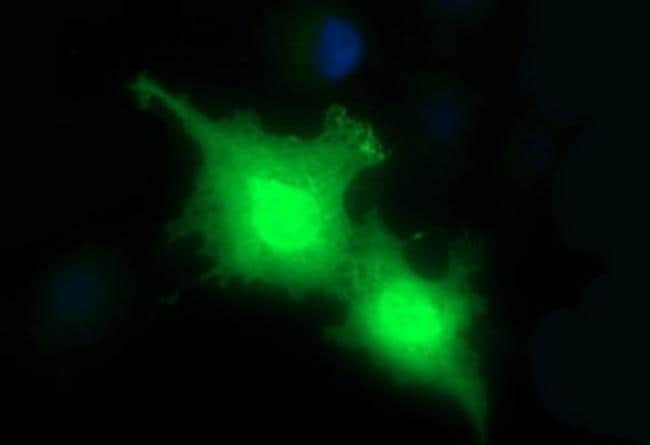
- Immunofluorescent analysis of PLA2G16 in COS7 cells. Cells were transfected with a plasmid overexpressing PLA2G16 and probed with a PLA2G16 monoclonal antibody (Product # MA5-26290).

- Submitted by
- Invitrogen Antibodies (provider)
- Main image

- Experimental details
- Immunofluorescent analysis of PLA2G16 in COS7 cells. Cells were transfected with a plasmid overexpressing PLA2G16 and probed with a PLA2G16 monoclonal antibody (Product # MA5-26290).
Supportive validation
- Submitted by
- Invitrogen Antibodies (provider)
- Main image

- Experimental details
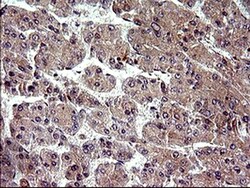
- Immunohistochemistry was performed on paraffin-embedded human liver tissue. To expose target proteins, 10mM citric buffer, pH6.0, 120°C for 3min was used. Following antigen retrieval, tissues were probed with a PLA2G16 monoclonal antibody (Product # MA5-26290).

- Submitted by
- Invitrogen Antibodies (provider)
- Main image
- Experimental details
- Immunohistochemistry was performed on paraffin-embedded carcinoma of human liver tissue. To expose target proteins, 10mM citric buffer, pH6.0, 120°C for 3min was used. Following antigen retrieval, tissues were probed with a PLA2G16 monoclonal antibody (Product # MA5-26290).

- Submitted by
- Invitrogen Antibodies (provider)
- Main image
- Experimental details
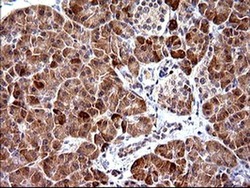
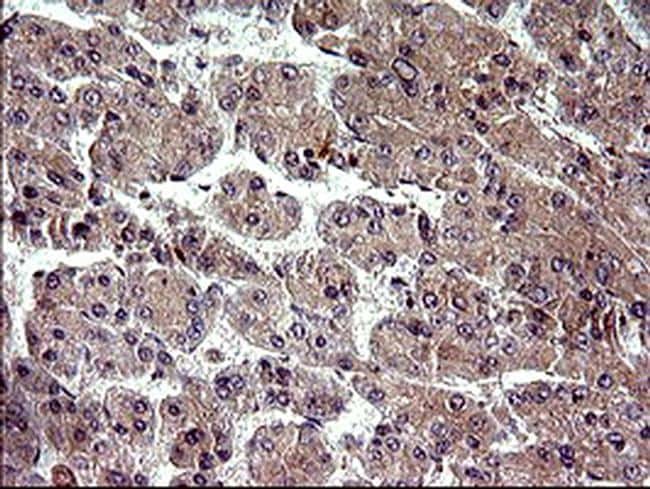
- Immunohistochemistry was performed on paraffin-embedded human pancreas tissue. To expose target proteins, 10mM citric buffer, pH6.0, 120°C for 3min was used. Following antigen retrieval, tissues were probed with a PLA2G16 monoclonal antibody (Product # MA5-26290).

- Submitted by
- Invitrogen Antibodies (provider)
- Main image
- Experimental details
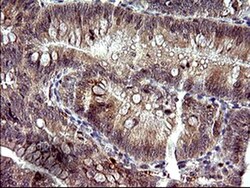
- Immunohistochemistry was performed on paraffin-embedded carcinoma of human pancreas tissue. To expose target proteins, 10mM citric buffer, pH6.0, 120°C for 3min was used. Following antigen retrieval, tissues were probed with a PLA2G16 monoclonal antibody (Product # MA5-26290).
- Submitted by
- Invitrogen Antibodies (provider)
- Main image

- Experimental details
- Immunohistochemistry was performed on paraffin-embedded human prostate tissue. To expose target proteins, 10mM citric buffer, pH6.0, 120°C for 3min was used. Following antigen retrieval, tissues were probed with a PLA2G16 monoclonal antibody (Product # MA5-26290).
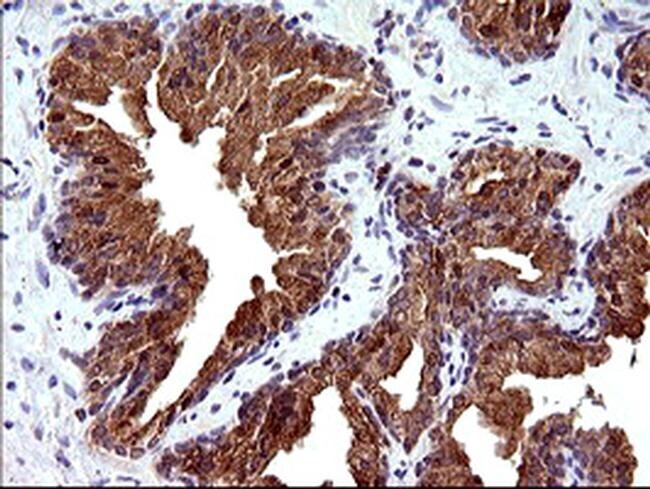
- Submitted by
- Invitrogen Antibodies (provider)
- Main image
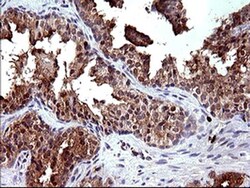
- Experimental details
- Immunohistochemistry was performed on paraffin-embedded carcinoma of human prostate tissue. To expose target proteins, 10mM citric buffer, pH6.0, 120°C for 3min was used. Following antigen retrieval, tissues were probed with a PLA2G16 monoclonal antibody (Product # MA5-26290).
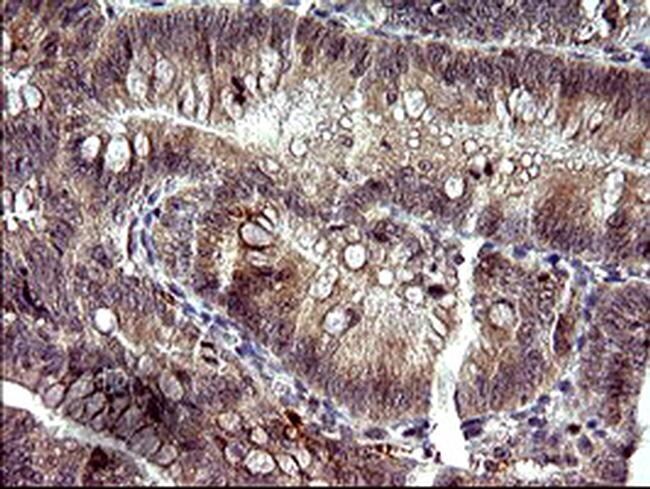
- Submitted by
- Invitrogen Antibodies (provider)
- Main image

- Experimental details
- Immunohistochemistry was performed on paraffin-embedded carcinoma of human pancreas tissue. To expose target proteins, 10mM citric buffer, pH6.0, 120°C for 3min was used. Following antigen retrieval, tissues were probed with a PLA2G16 monoclonal antibody (Product # MA5-26290).

- Submitted by
- Invitrogen Antibodies (provider)
- Main image

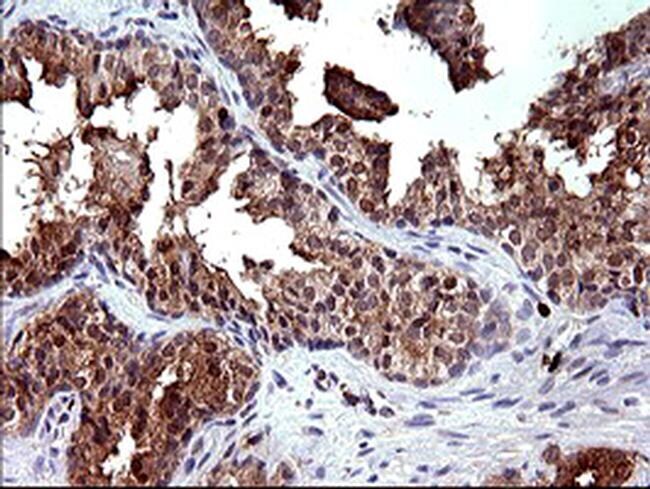
- Experimental details
- Immunohistochemistry was performed on paraffin-embedded human prostate tissue. To expose target proteins, 10mM citric buffer, pH6.0, 120°C for 3min was used. Following antigen retrieval, tissues were probed with a PLA2G16 monoclonal antibody (Product # MA5-26290).

- Submitted by
- Invitrogen Antibodies (provider)
- Main image

- Experimental details
- Immunohistochemistry was performed on paraffin-embedded carcinoma of human prostate tissue. To expose target proteins, 10mM citric buffer, pH6.0, 120°C for 3min was used. Following antigen retrieval, tissues were probed with a PLA2G16 monoclonal antibody (Product # MA5-26290).

- Submitted by
- Invitrogen Antibodies (provider)
- Main image

- Experimental details
- Immunohistochemistry was performed on paraffin-embedded human liver tissue. To expose target proteins, 10mM citric buffer, pH6.0, 120°C for 3min was used. Following antigen retrieval, tissues were probed with a PLA2G16 monoclonal antibody (Product # MA5-26290).
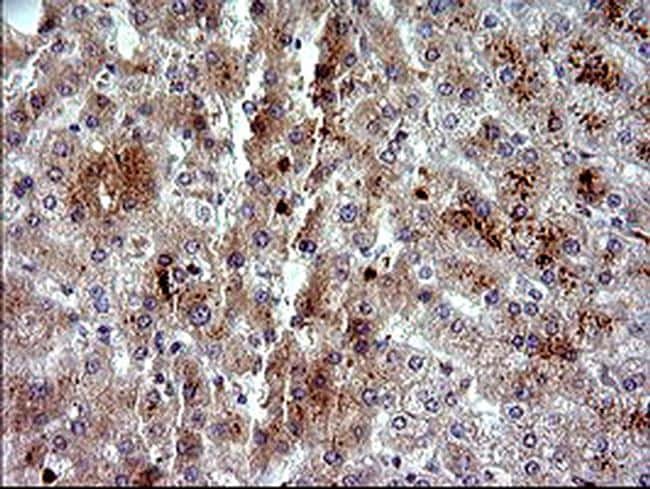
- Submitted by
- Invitrogen Antibodies (provider)
- Main image

- Experimental details
- Immunohistochemistry was performed on paraffin-embedded carcinoma of human liver tissue. To expose target proteins, 10mM citric buffer, pH6.0, 120°C for 3min was used. Following antigen retrieval, tissues were probed with a PLA2G16 monoclonal antibody (Product # MA5-26290).
Supportive validation
- Submitted by
- Invitrogen Antibodies (provider)
- Main image
- Experimental details
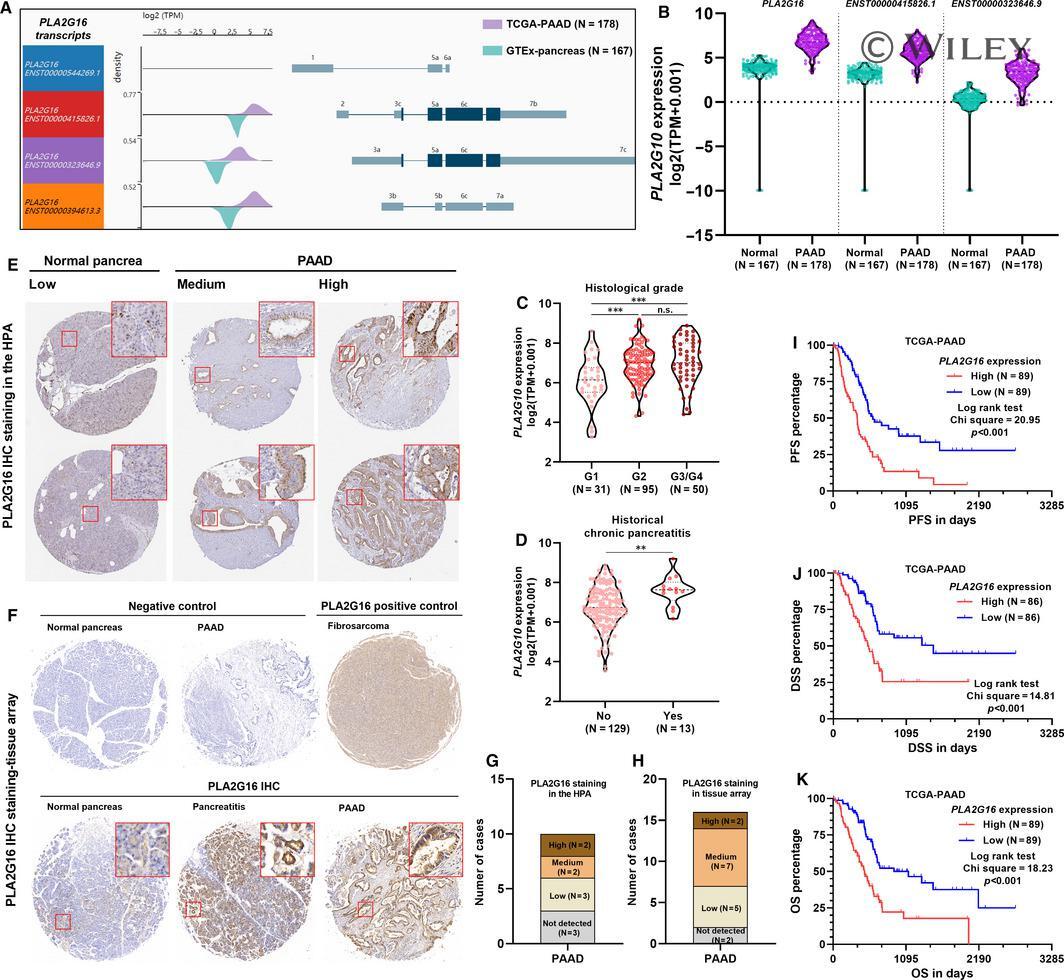
- 1 FIGURE Aberrant PLA2G16 expression was associated with unfavourable survival of pancreatic adenocarcinoma (PAAD). A and B, Schematic diagram (A) and violin chart (B) showing the exonic and intronic structure of PLA2G16 transcripts and the expression of the protein-coding transcripts in primary PAAD cases in The Cancer Genome Atlas (TCGA) and normal pancreas in GTEx. C and D, Comparison of PLA2G16 mRNA expression in different grades of PAAD (C) and between the cases with or without historical chronic pancreatitis (D) in TCGA. E, Representative images of IHC staining of PLA2G16 in normal pancreas and PAAD tissues. Image credit: Human Protein Atlas, from https://www.proteinatlas.org/ENSG00000176485-PLA2G16/tissue/pancreas and https://www.proteinatlas.org/ENSG00000176485-PLA2G16/pathology/pancreatic+cancer#ihc . F, Representative images of IHC staining of PLA2G16 in normal pancreas, pancreatitis and PAAD in human tissue array. PBS was used as negative control. Fibrosarcoma tissue was used as positive control. G and H, Summary of PLA2G16 protein expression score of 10 PAAD cases examined in the Human Protein Atlas (G) and 16 PAAD cases in the tissue array (H). I-K, K-M survival analysis of progression-free survival (PFS) (I), disease-specific survival (DSS) (J) and overall survival (OS) (K) in PAAD cases extracted from TCGA Pan-Cancer, by median PLA2G16 expression separation
- Submitted by
- Invitrogen Antibodies (provider)
- Main image
- Experimental details
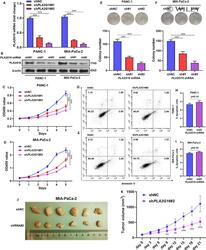
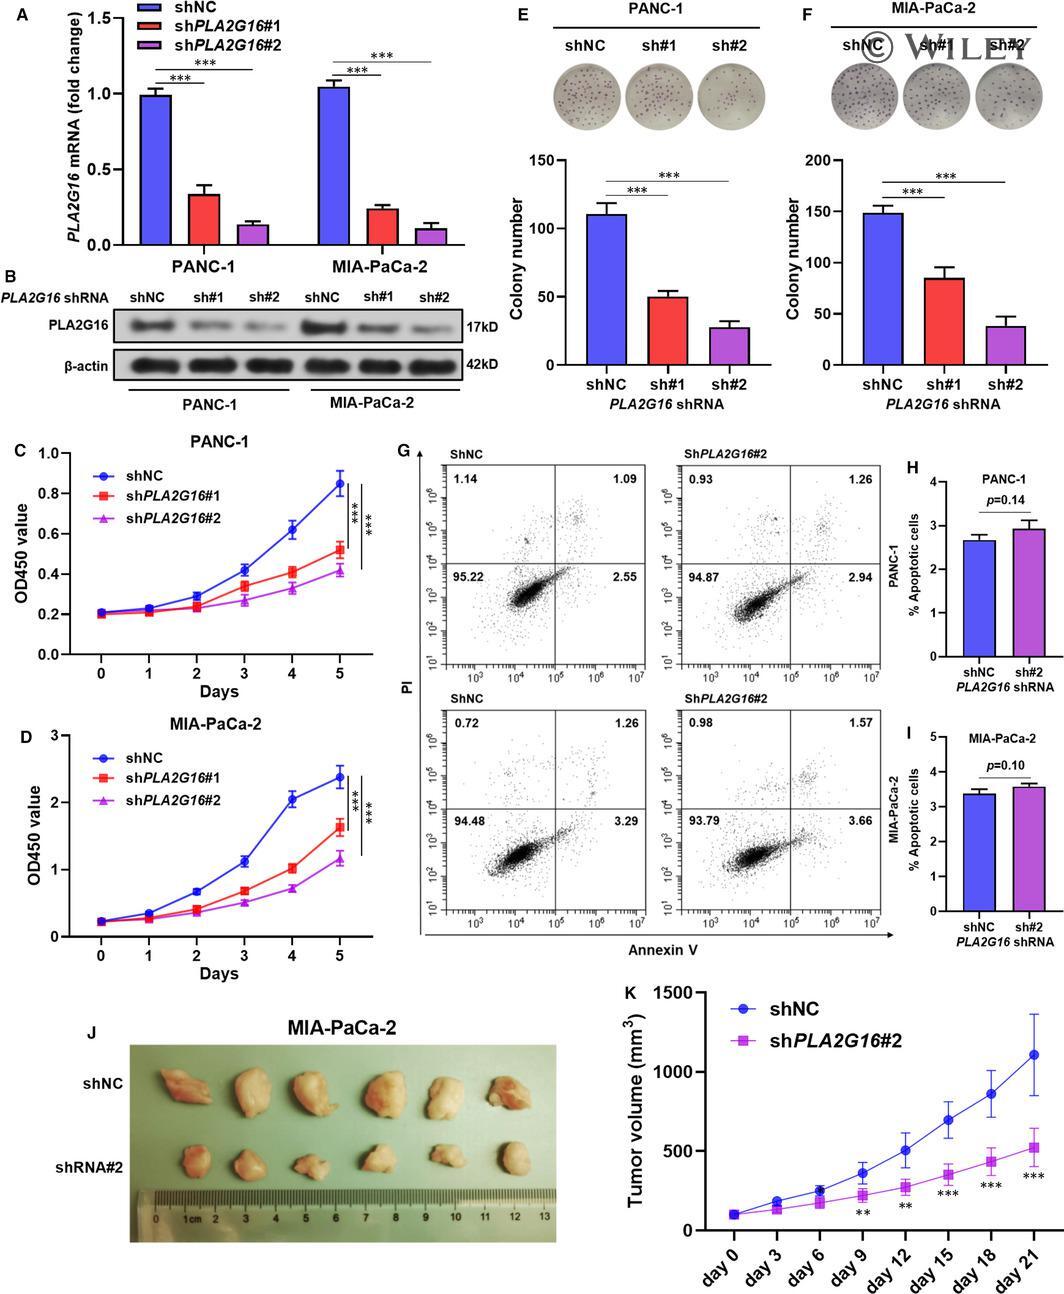
- 2 FIGURE PLA2G16 enhances pancreatic cell growth in vitro and in vivo. A and B, quantitative real-time PCR (qRT-PCR) (A) and Western blot (B) analysis of PLA2G16 expression in PANC-1 and MIA-PaCa-2 cells 48 h (qRT-PCR)/72 h (Western blot) after lentiviral-mediated PLA2G16 knockdown. C and D, cell count kit assay of the proliferation of PANC-1 (C) and MIA-PaCa-2 (D) cells with or without PLA2G16 knockdown. E and F, Representative image (up) and quantification (down) of colony formation of PANC-1 (E) and MIA-PaCa-2 (F) cells with or without PLA2G16 knockdown. G-I, Representative image (G) and quantification (H, I) of flow cytometric analysis of apoptotic PANC-1 and MIA-PaCa-2 cells 48 h after lentiviral-mediated PLA2G16 knockdown. J and K, Representative images (J) of xenograft tumour developed by MIA-PaCa-2 cells with or without PLA2G16 knockdown and the corresponding tumour growth curve (K)
- Submitted by
- Invitrogen Antibodies (provider)
- Main image

- Experimental details
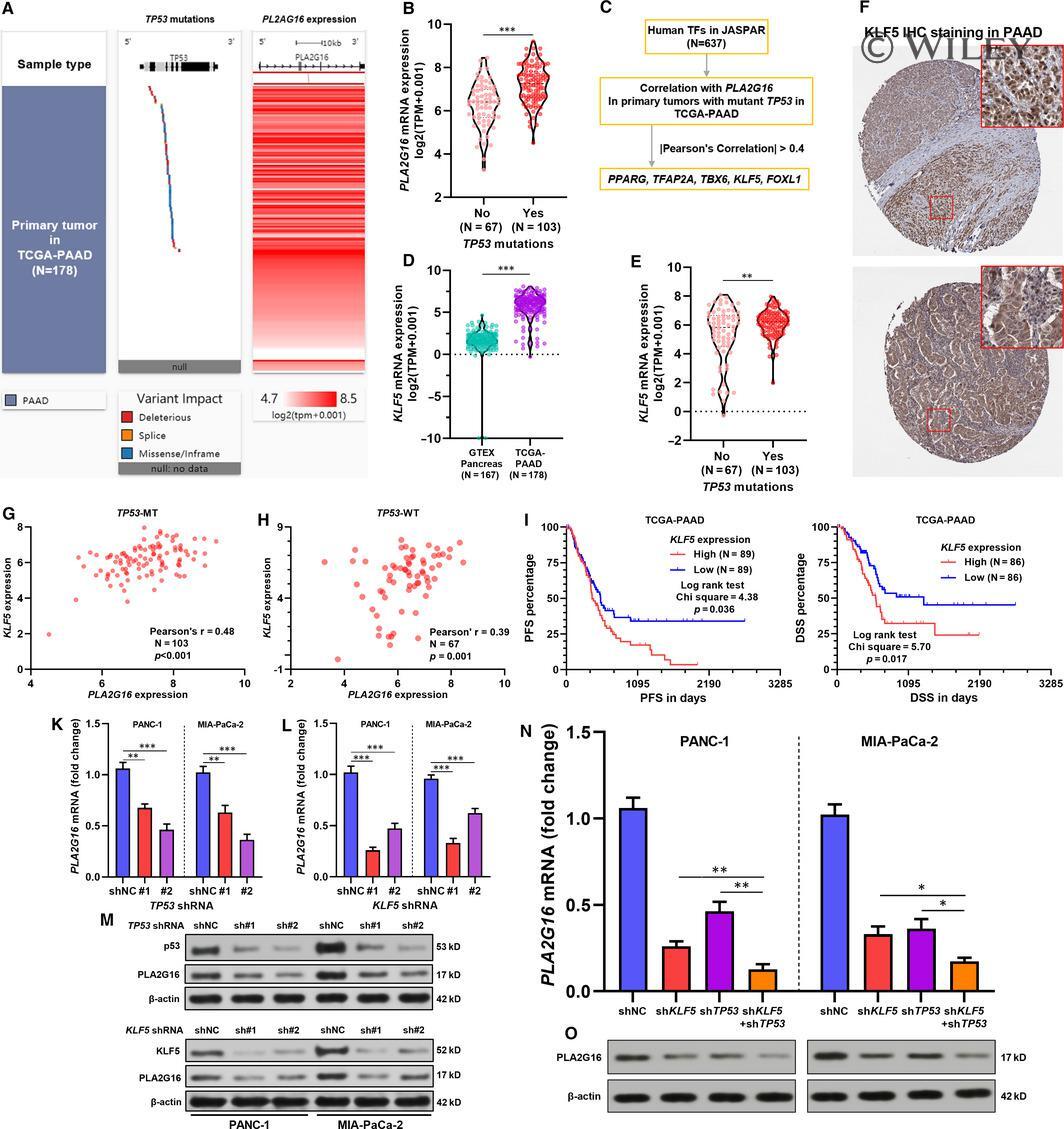
- 4 FIGURE Both mutant p53 and KLF5 increase PLA2G16 expression in pancreatic cancer. A, A heatmap showing TP53 mutation and PLA2G16 expression in pancreatic adenocarcinoma (PAAD) cases in The Cancer Genome Atlas (TCGA). B, A violin plot chart comparing PLA2G16 expression between PAAD cases with or without TP53 mutations. C, Flow chart showing the screening process to identify PLA2G16 correlated TFs in TP53 mutant PAAD cases. D and E, Comparison of KLF5 mRNA expression between normal pancreas in GTEx and PAAD in TCGA (D) and between PAAD cases with or without TP53 mutations (E). F, Representative images of KLF5 protein expression in PAAD tissue. Image credit: Human Protein Atlas, from: https://www.proteinatlas.org/ENSG00000102554-KLF5/pathology/pancreatic+cancer . G and H, Plot charts showing the correlation between PLA2G16 and KLF5 mRNA expression in TP53 mutant (G) and TP53 wild-type (H) PAAD cases. I and J, K-M survival analysis of PFS (I) and DSS (J) in PAAD cases in TCGA Pan-Cancer, by median KLF5 expression separation. K and L, Quantitative real-time PCR (qRT-PCR) analysis of PLA2G16 mRNA expression in PANC-1 and MIA-PaCa-2 cells 48 h after lentiviral-mediated TP53 (K) or KLF5 (L) inhibition. M, Western blot analysis of p53, KLF5 and PLA2G16 protein expression 72 h after lentiviral-mediated TP53 (up) or KLF5 (down) inhibition. N and O, qRT-PCR (M) and Western blot assay (O) of PLA2G16 expression in PANC-1 and MIA-PaCa-2 cells with TP53 and KLF5 inhibition (sh TP53 #2 and