Explore
 Validate
 Learn
Learn Immunocytochemistry
Antibody data
- Antibody Data
- Antigen structure
- References [1]
- Comments [0]
- Validations
- Immunocytochemistry [1]
- Immunohistochemistry [6]
- Other assay [2]
Submit
Validation data
Reference
Comment
Report error
- Product number
- PA5-82743 - Provider product page

- Provider
- Invitrogen Antibodies
- Product name
- Fibrillin 1 Polyclonal Antibody
- Antibody type
- Polyclonal
- Antigen
- Recombinant protein fragment
- Description
- Immunogen sequence: DVRPGYCYTA LTNGRCSNQL PQSITKMQCC CDAGRCWSPG VTVAPEMCPI RATEDFNKLC SVPMVIPGRP EYPPPPLGPI PPVLPVPPGF PPGPQIPVPR PPVEYLYPSR EPPRVLPVNV TDYCQLVRYL CQNGRCIPTP GSCRCEC
- Reactivity
- Human
- Host
- Rabbit
- Isotype
- IgG
- Vial size
- 100 μL
- Concentration
- 0.10 mg/mL
- Storage
- Store at 4°C short term. For long term storage, store at -20°C, avoiding freeze/thaw cycles.
Submitted references FBXO2 Promotes Proliferation of Endometrial Cancer by Ubiquitin-Mediated Degradation of FBN1 in the Regulation of the Cell Cycle and the Autophagy Pathway.
Che X, Jian F, Wang Y, Zhang J, Shen J, Cheng Q, Wang X, Jia N, Feng W
Frontiers in cell and developmental biology 2020;8:843
Frontiers in cell and developmental biology 2020;8:843
No comments: Submit comment
Supportive validation
- Submitted by
- Invitrogen Antibodies (provider)
- Main image
- Experimental details
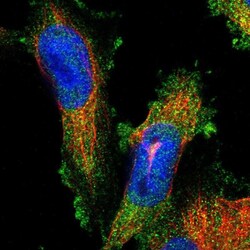
- Immunofluorecent analysis of Fibrillin 1 in human cell line U-251 MG using Fibrillin 1 Polyclonal Antibody (Product # PA5-82743). Staining shows localization to cytosol.

Supportive validation
- Submitted by
- Invitrogen Antibodies (provider)
- Main image

- Experimental details
- Immunohistochemical analysis of Fibrillin 1 in human cervix, uterine using Fibrillin 1 Polyclonal Antibody (Product # PA5-82743) shows moderate extracellular space positivity.
- Submitted by
- Invitrogen Antibodies (provider)
- Main image

- Experimental details
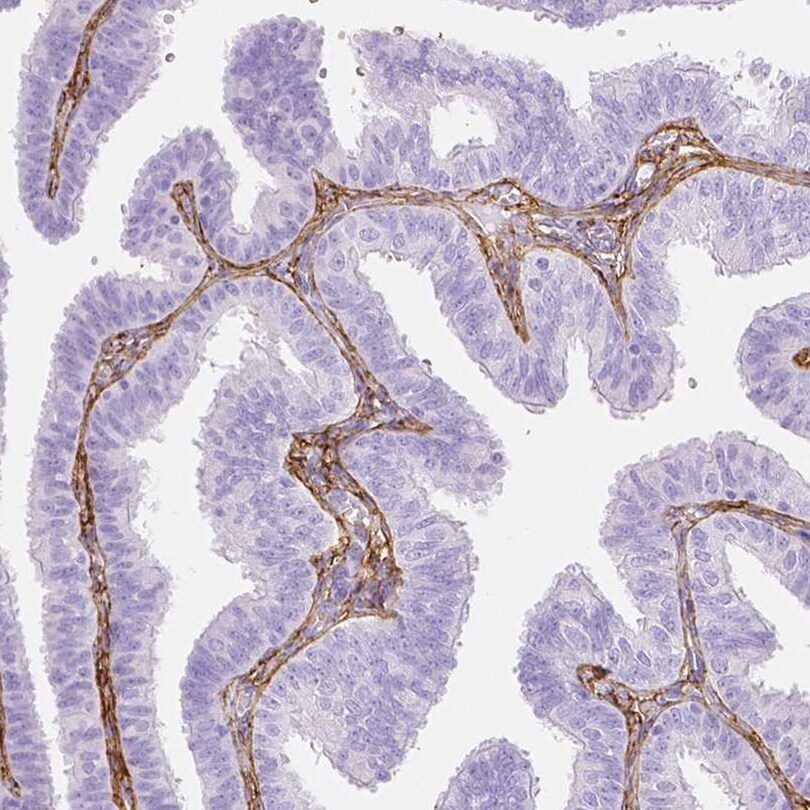
- Immunohistochemical analysis of Fibrillin 1 in human fallopian tube using Fibrillin 1 Polyclonal Antibody (Product # PA5-82743) shows strong positivity in extracellular matrix.
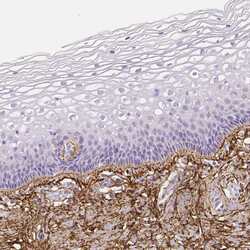
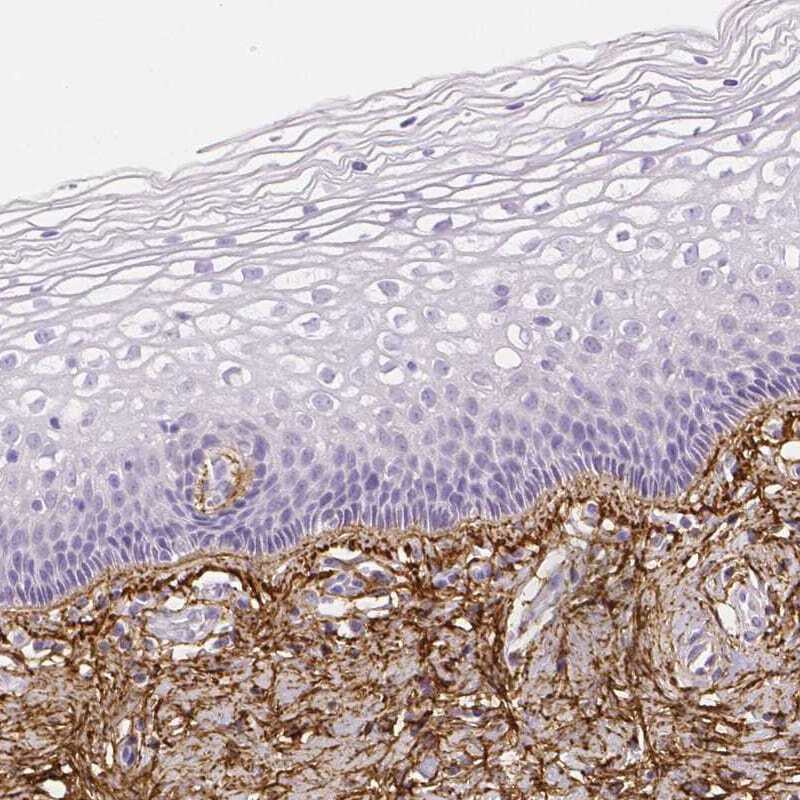
- Submitted by
- Invitrogen Antibodies (provider)
- Main image
- Experimental details
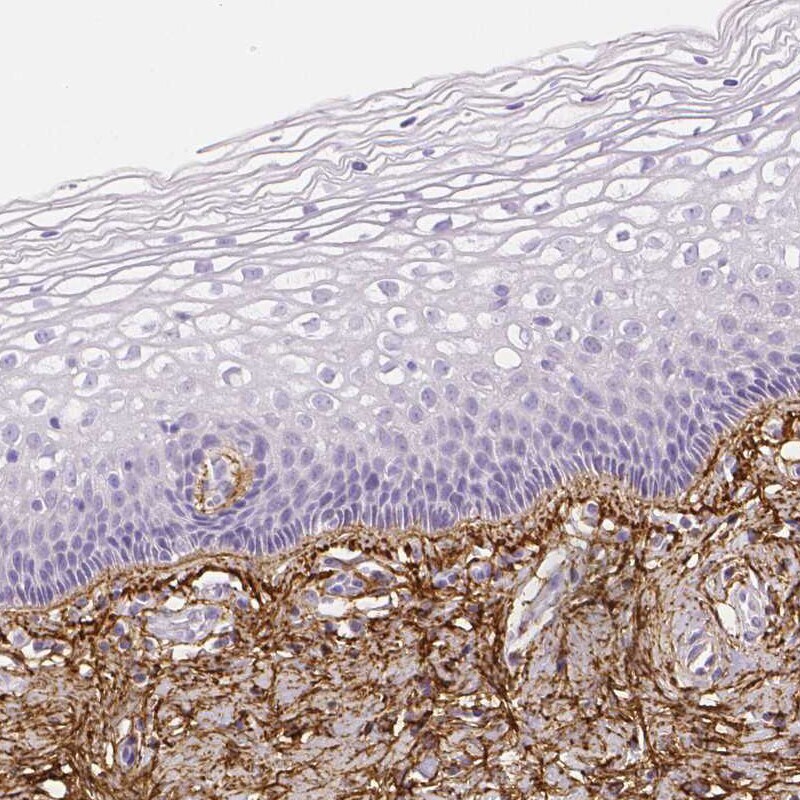
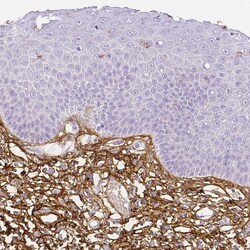
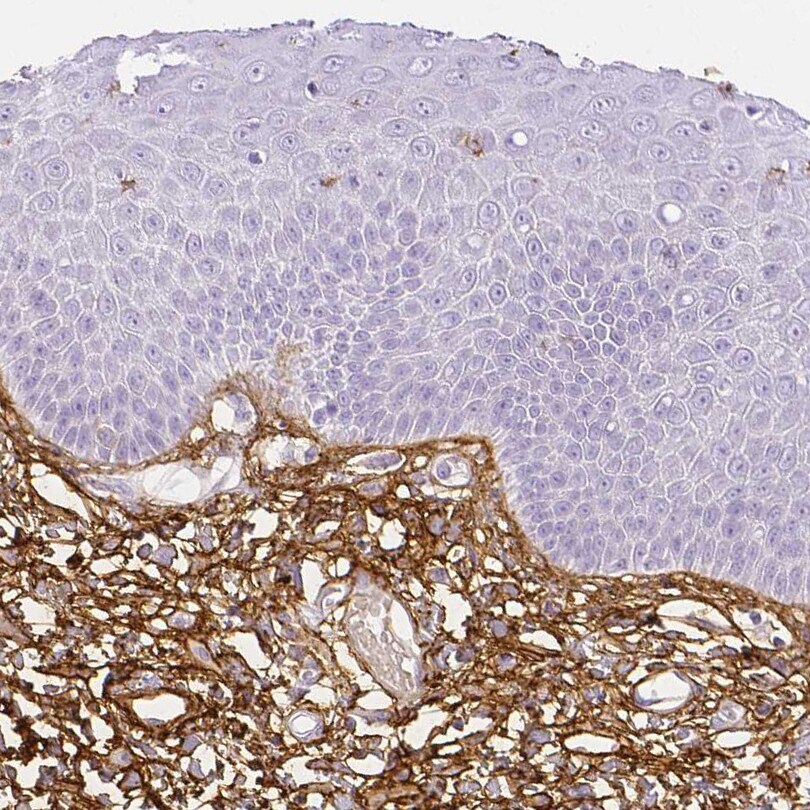
- Immunohistochemical analysis of Fibrillin 1 in human skin using Fibrillin 1 Polyclonal Antibody (Product # PA5-82743) shows strong positivity in extracellular matrix.
- Submitted by
- Invitrogen Antibodies (provider)
- Main image
- Experimental details
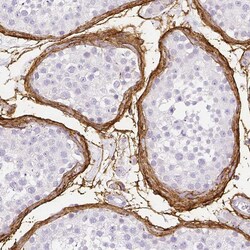
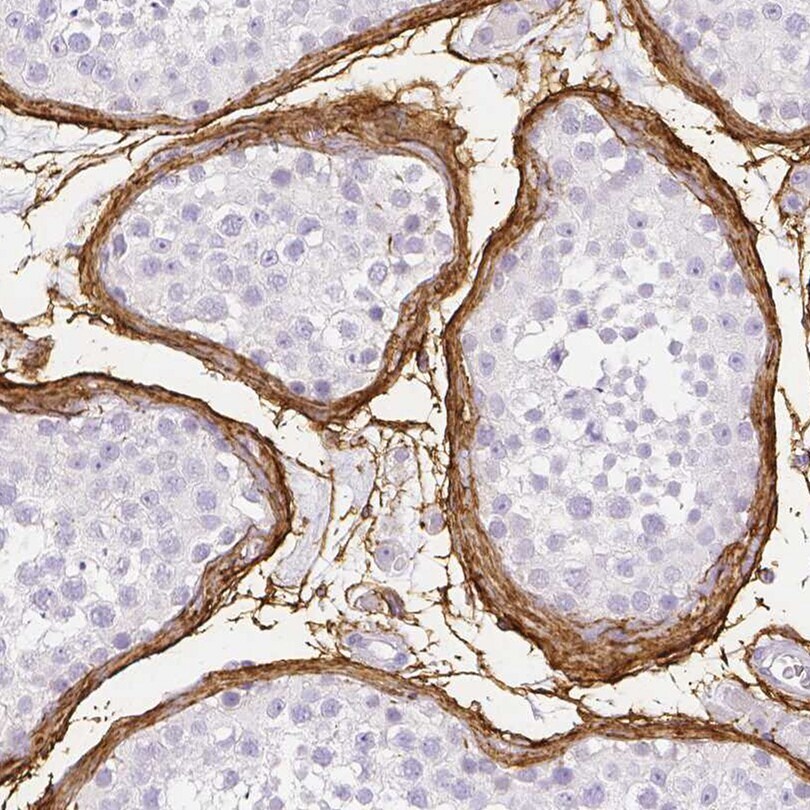
- Immunohistochemical analysis of Fibrillin 1 in human testis using Fibrillin 1 Polyclonal Antibody (Product # PA5-82743) shows positivity in extracellular matrix.
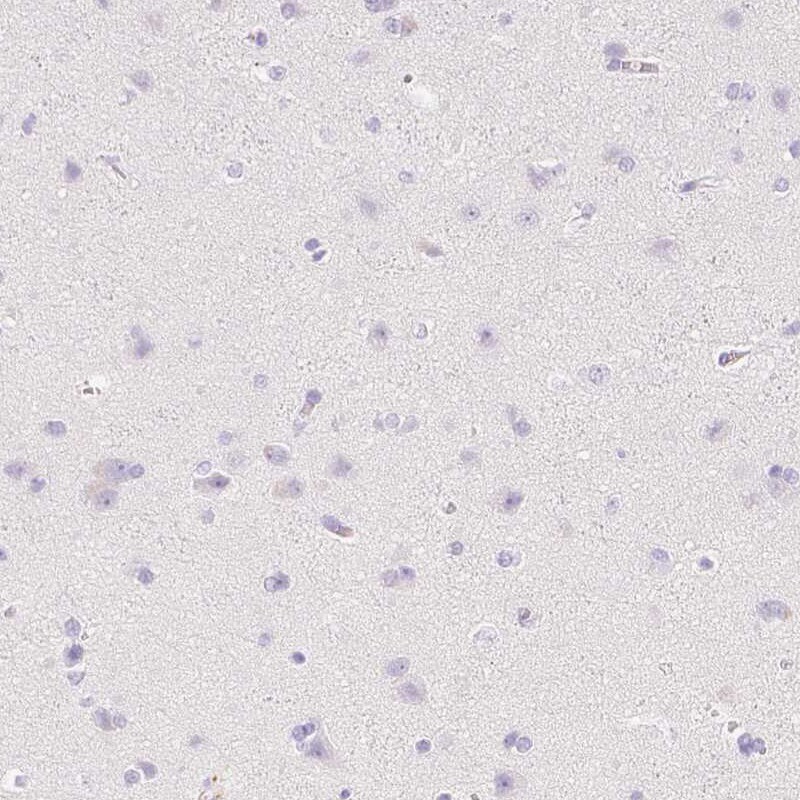
- Submitted by
- Invitrogen Antibodies (provider)
- Main image
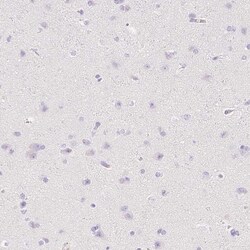
- Experimental details
- Immunohistochemical analysis of Fibrillin 1 in human cerebral cortex using Fibrillin 1 Polyclonal Antibody (Product # PA5-82743) shows no positivity as expected.
- Submitted by
- Invitrogen Antibodies (provider)
- Main image
- Experimental details
- Immunohistochemical analysis of Fibrillin 1 in human cervix, uterine using Fibrillin 1 Polyclonal Antibody (Product # PA5-82743) shows moderate extracellular space positivity.
Supportive validation
- Submitted by
- Invitrogen Antibodies (provider)
- Main image
- Experimental details
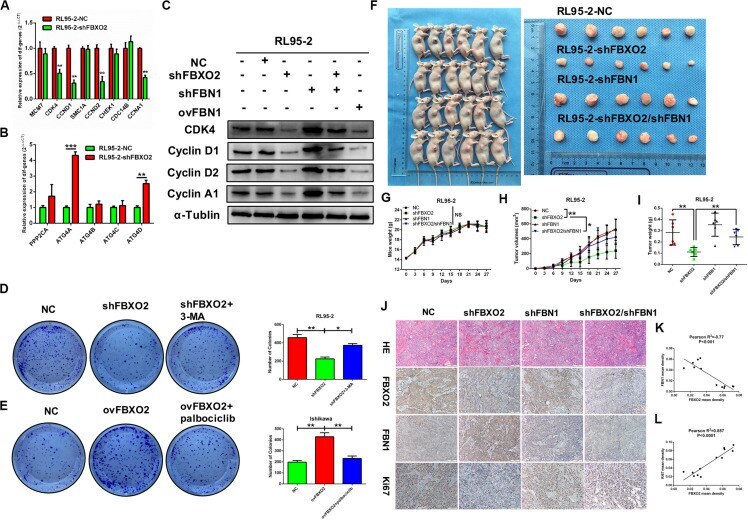
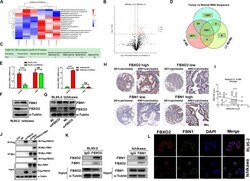
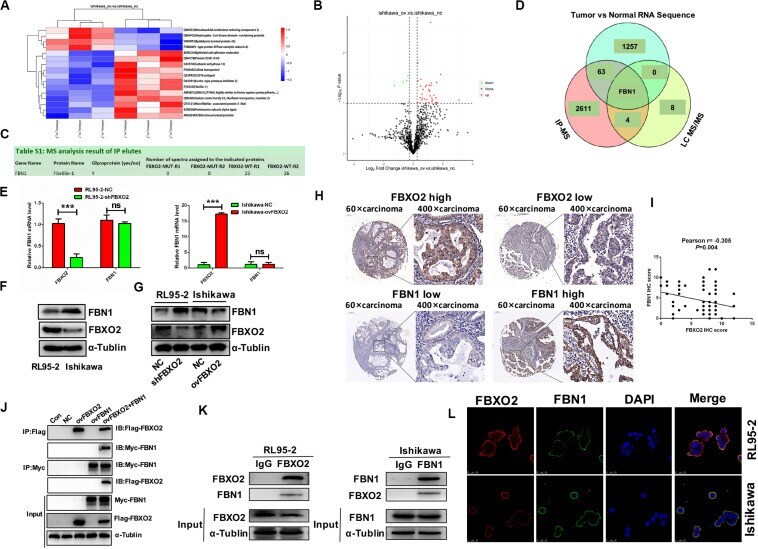
- FIGURE 3 FBN1 identified as a novel substrate for FBXO2. (A,B) Cluster analysis and volcano plot of the differential proteins regulated by FBXO2 ubiquitination based on the LC MS/MS data. (C) FBN1 protein was directly bound to FBXO2 protein. (D) The intersection of IP-MS, LC MS/MS, and our RNA sequencing data. (E) FBN1 mRNA expression measured by RT-PCR in RL95-2-shFBXO2 and Ishikawa-ovFBXO2 cells compared with their parental cells ( P > 0.05). *** P < 0.001, t -test. (F) Endogenous FBXO2 and FBN1 protein levels in RL95-2 and Ishikawa cells. (G) FBN1 protein levels as measured by western blot analysis in shFBXO2-RL95-2 cells and Ishikawa-ovFBXO2 cells compared with their parental cells. (H) Immunohistochemical staining of FBXO2 and FBN1 in 90 EC samples and paired para-carcinoma samples. Left four photographs: FBXO2 was highly expressed in carcinoma tissues (upper panel), while FBN1 showed low expression in the same patient (lower panel). Right four photographs: FBXO2 showed low expression in carcinoma tissues (upper) while FBN1 was highly expressed in the same patient (lower). Original magnification, x60 and x400; scale bar: 200 and 50 mum, respectively. (I) Inverse correlation between FBXO2 and FBN1 staining, Pearson r = -0.305, P = 0.004. (J) Exogenous FBXO2 and FBN1 proteins interacted with each other in HEK-293T cells. HEK-293T cells were transfected with Flag-FBXO2, Myc-FBN1, and co-transfected with Flag-FBXO2 and Myc-FBN1 for 48 h, respectively. After treatment with 20
- Submitted by
- Invitrogen Antibodies (provider)
- Main image
- Experimental details
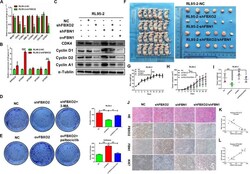
- FIGURE 7 (A-L) Verification of differential genes associated with the cell cycle and autophagy signaling pathways. (A) mRNA levels of MCM7, CDK4, CCND1, SMAC1A, CCND2, CHEK1, CDC14B, and CCNA1 in RL95-2-NC and RL95-2-shFBXO2 groups. CDK4, CCND1, CCND2, and CCNA1 were significantly down-regulated in the RL95-2-shFBXO2 group compared with RL95-2-NC group. Data are presented as mean +- SD, ** P < 0.01, t -test. (B) mRNA levels of PPP2CA, ATG4A, ATG4B, ATG4C, and ATG4D in the RL95-2-NC and RL95-2-shFBXO2 groups. ATG4A and ATG4D were significantly up-regulated in the RL95-2-shFBXO2 group compared with the RL95-2-NC group. Data are presented as mean +- SD, ** P < 0.01, *** P < 0.001, t -test. (C) Protein levels of CDK4, CyclinD1, CyclinD2, and CyclinA1 in RL95-2-NC, RL95-2-shFBXO2, RL95-2-shFBN1, RL95-2-shFBXO2/shFBN1, and RL95-2-ovFBN1 cells. Knockdown of FBXO2 and overexpression of FBN1 revealed the same tendency in decreasing protein levels of CDK4, CyclinD1, CyclinD2, and CyclinA1 compared with the RL95-2-NC group. Knockdown of both FBXO2 and FBN1 showed increased protein levels of CDK4, CyclinD1, CyclinD2, and CyclinA1 compared with the RL95-2-shFBXO2 group. alpha-Tublin was used as a loading control. (D) The autophagy-specific inhibitor 3-MA (2 mM) reversed the effects of FBXO2 on the RL95-2 cells proliferation. Data are presented as mean +- SD, * P < 0.05, ** P < 0.01, one-way ANOVA. (E) The CDK4/6 inhibitor palbociclib (2 muM) reversed the effects of FBXO2 on the Ishikawa c