Explore
 Validate
 Learn
LearnPA5-53814
antibody from Invitrogen Antibodies
Targeting: SEPTIN2
DIFF6, hNedd5, KIAA0158, NEDD5, Pnutl3, SEPT2
 Western blot
 Immunocytochemistry
Antibody data
- Antibody Data
- Antigen structure
- References [1]
- Comments [0]
- Validations
- Immunocytochemistry [2]
- Immunohistochemistry [4]
- Other assay [5]
Submit
Validation data
Reference
Comment
Report error
- Product number
- PA5-53814 - Provider product page

- Provider
- Invitrogen Antibodies
- Product name
- Septin 2 Polyclonal Antibody
- Antibody type
- Polyclonal
- Antigen
- Recombinant protein fragment
- Description
- Immunogen sequence: WGVVEVENPE HNDFLKLRTM LITHMQDLQE VTQDLHYENF RSERLKRGGR KVENEDMNKD QILLEKEAEL RRMQEMIARM QAQMQMQMQG GDGDGGALGH Highest antigen sequence identity to the following orthologs: Mouse - 97%, Rat - 96%.
- Reactivity
- Human, Mouse, Rat
- Host
- Rabbit
- Isotype
- IgG
- Vial size
- 100 μL
- Concentration
- 0.1 mg/mL
- Storage
- Store at 4°C short term. For long term storage, store at -20°C, avoiding freeze/thaw cycles.
Submitted references Contribution of septins to human platelet structure and function.
Kim OV, Litvinov RI, Mordakhanova ER, Bi E, Vagin O, Weisel JW
iScience 2022 Jul 15;25(7):104654
iScience 2022 Jul 15;25(7):104654
No comments: Submit comment
Supportive validation
- Submitted by
- Invitrogen Antibodies (provider)
- Main image
- Experimental details
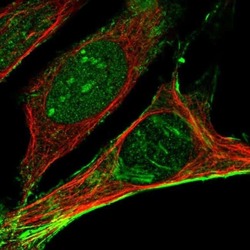
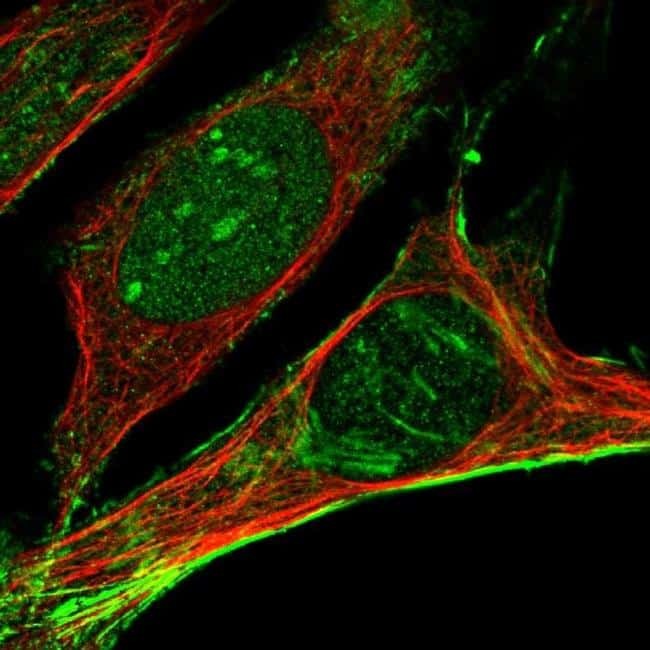
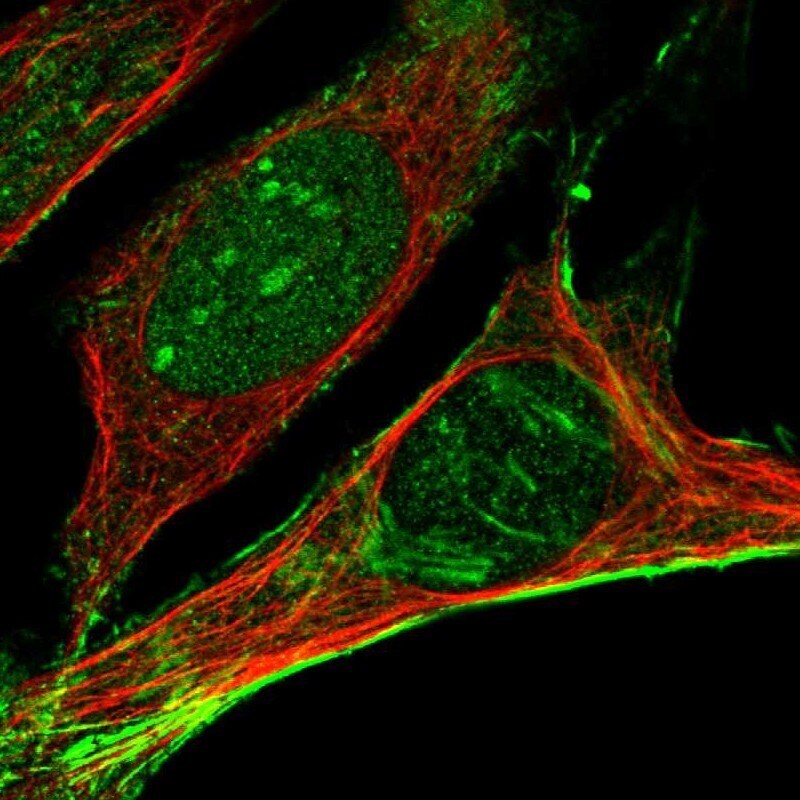
- Immunofluorescent staining of Septin 2 in human cell line U-2 OS shows positivity in nucleus, nucleoli & actin filaments. Samples were probed using a Septin 2 Polyclonal Antibody (Product # PA5-53814).
- Submitted by
- Invitrogen Antibodies (provider)
- Main image

- Experimental details
- Immunofluorecent analysis of Septin 2 in human cell line U-2 OS using Septin 2 Polyclonal Antibody (Product # PA5-53814). Staining shows localization to nucleus, nucleoli and actin filaments.
Supportive validation
- Submitted by
- Invitrogen Antibodies (provider)
- Main image
- Experimental details
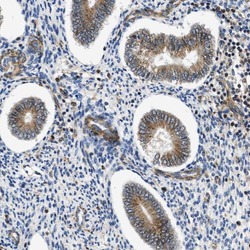
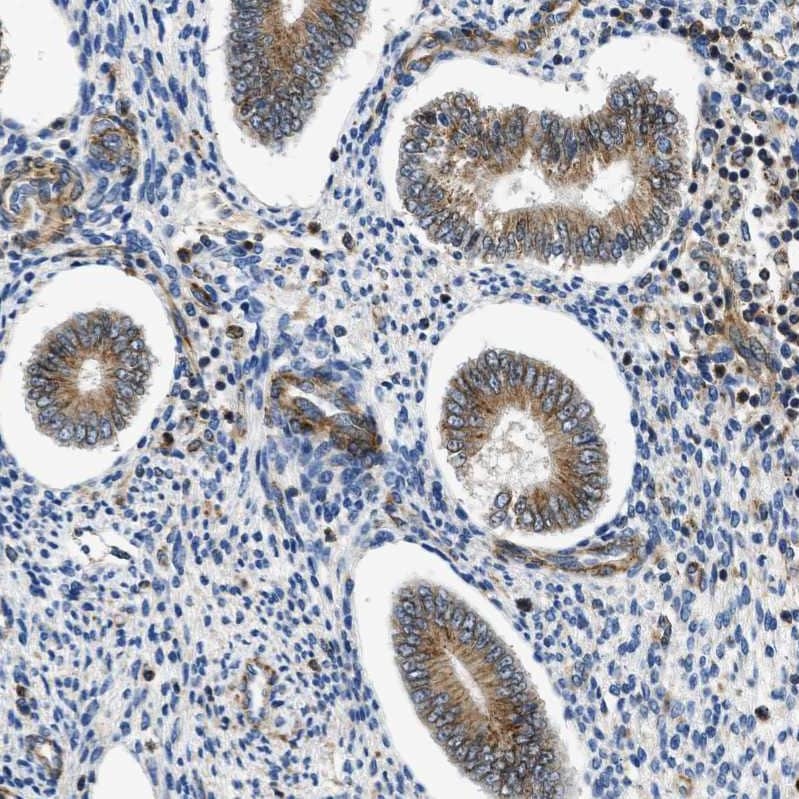
- Immunohistochemical analysis of Septin 2 in human endometrium using Septin 2 Polyclonal Antibody (Product # PA5-53814) shows moderate cytoplasmic positivity in glandular cells.
- Submitted by
- Invitrogen Antibodies (provider)
- Main image
- Experimental details
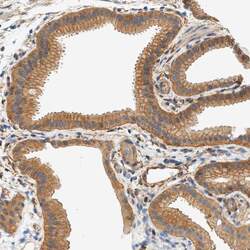
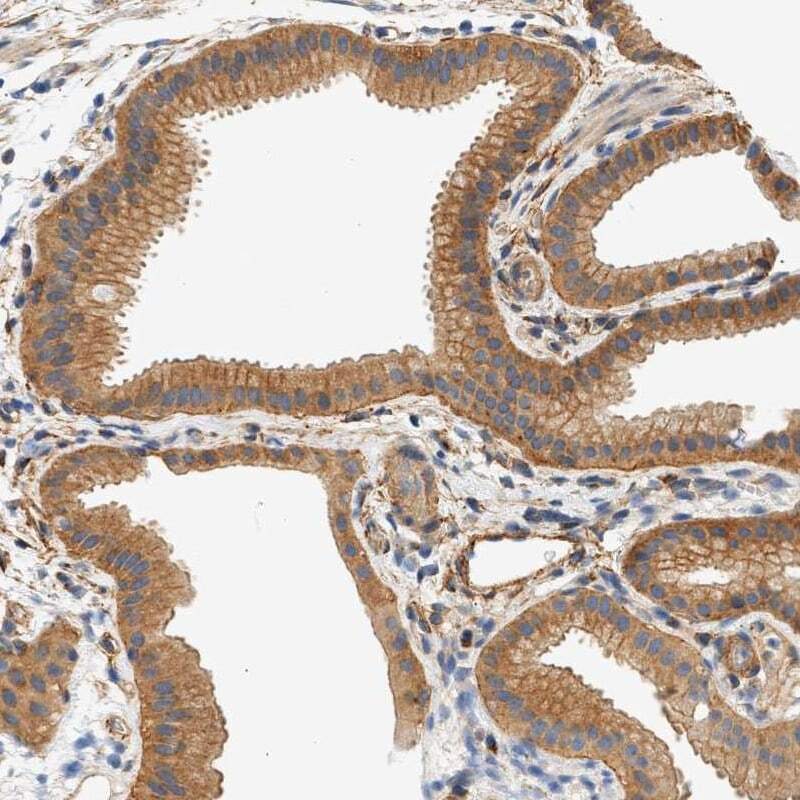
- Immunohistochemical staining of Septin 2 in human gallbladder using a Septin 2 Polyclonal Antibody (Product # PA5-53814) shows moderate cytoplasmic positivity in glandular cells.
- Submitted by
- Invitrogen Antibodies (provider)
- Main image
- Experimental details
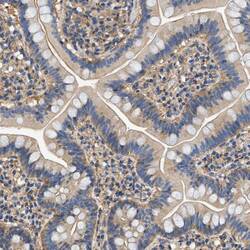
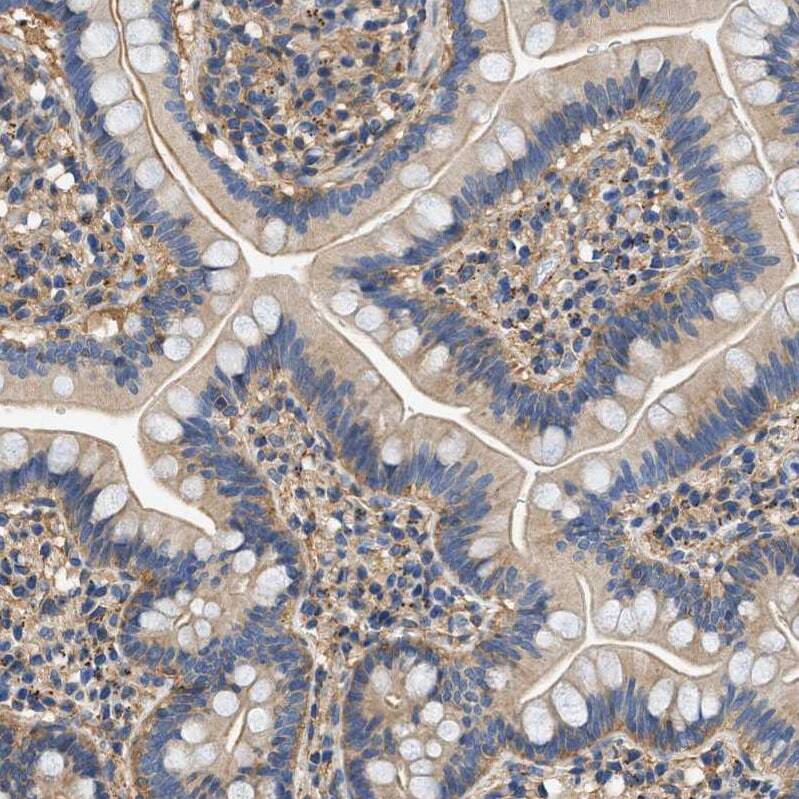
- Immunohistochemical analysis of Septin 2 in human small intestine using Septin 2 Polyclonal Antibody (Product # PA5-53814) shows weak cytoplasmic positivity in glandular cells.
- Submitted by
- Invitrogen Antibodies (provider)
- Main image
- Experimental details
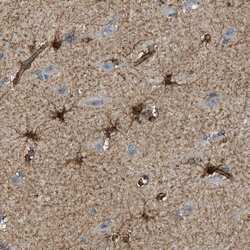
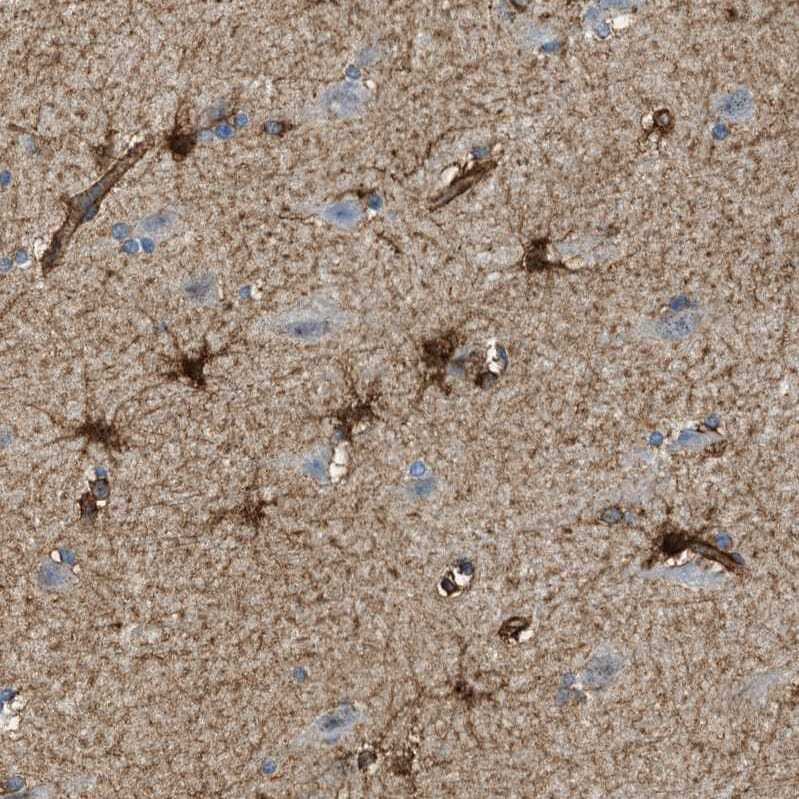
- Immunohistochemical analysis of Septin 2 in human cerebral cortex using Septin 2 Polyclonal Antibody (Product # PA5-53814) shows strong cytoplasmic positivity in glial cells.
Supportive validation
- Submitted by
- Invitrogen Antibodies (provider)
- Main image
- Experimental details
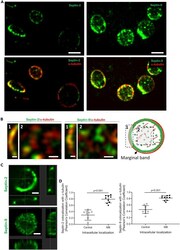
- Differential distribution of Septin-2 and Septin-9 within resting platelets and their colocalization with microtubules (A) Confocal microscopy of unstimulated platelets immunostained for Septin-2, Septin-9, and alpha-tubulin. Septin-2 forms a ring-like circular structure strongly co-localized with the microtubule marginal band. Septin-9 is located both in the central part and cell periphery where it is co-localized with alpha-tubulin. Scale bar = 1 mum. The images are the projections of optical z stack slices. (B) Zoomed-in views of co-stained Septin-2/alpha-tubulin and Septin-9/alpha-tubulin (B left) at the platelet peripheral marginal band (MB, ""1"") and central compartment (Central, ""2"") regions, schematically illustrated in (B right). (C) Spatial distributions of Septin-2 and Septin-9 in a single platelet shown in orthogonal cross-sections of a reconstructed 3D image. Scale bar = 0.6 mum. (D) Quantification of the degree of colocalization between Septin-2 and alpha-tubulin and Septin-9 and alpha-tubulin for the platelet peripheral marginal band and the central part, schematically illustrated in (B). The fluorescence correlation between Septin-2, Septin-9 and alpha-tubulin shown as Pearson's correlation coefficient (PCC) (D). The results are presented as a median and IQR; significance tested by the Wilcoxon matched-pairs signed rank test.

- Submitted by
- Invitrogen Antibodies (provider)
- Main image
- Experimental details
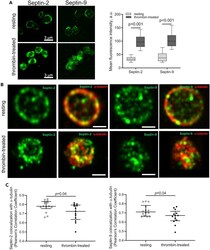
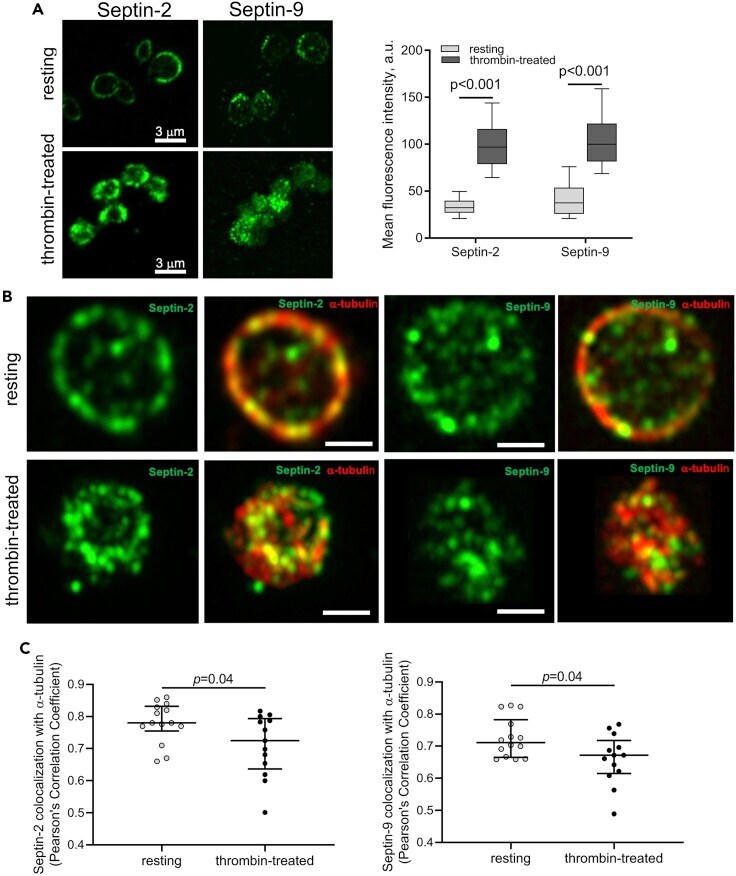
- Redistribution of Septin-2 and Septin-9 in platelets upon thrombin-induced activation (A, left) Confocal microscopy of platelets stained for Septin-2 and Septin-9 in resting and thrombin-treated platelets. Scale bar = 3 mum. (A, right) Mean fluorescence intensity of a whole cell for Septin-2 (n = 110) and Septin-9 (n = 110) measured at the identical settings of a confocal fluorescent microscope, computed as the mean intensity value of all the non-background signal. A two-tailed Mann-Whitney U test. (B) Distributions of Septin-2, Septin-9 and alpha-tubulin in a platelet before (top row) and after (bottom row) treatment of platelets with thrombin. Scale bar = 1 mum. Projections of optical z stack slices. (C) Changes in colocalization between Septin-2 and tubulin in resting and thrombin-activated platelets. Quantification of colocalization between Septin-2, Septin-9 and alpha-tubulin based on the fluorescence intensity correlation analysis and presented in terms of Pearson correlation coefficients (PCC). The results are presented as a median and IQR. Significance tested by the Mann-Whitney U-test.
- Submitted by
- Invitrogen Antibodies (provider)
- Main image
- Experimental details
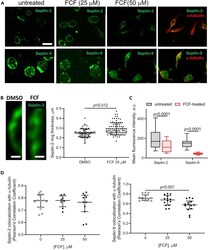
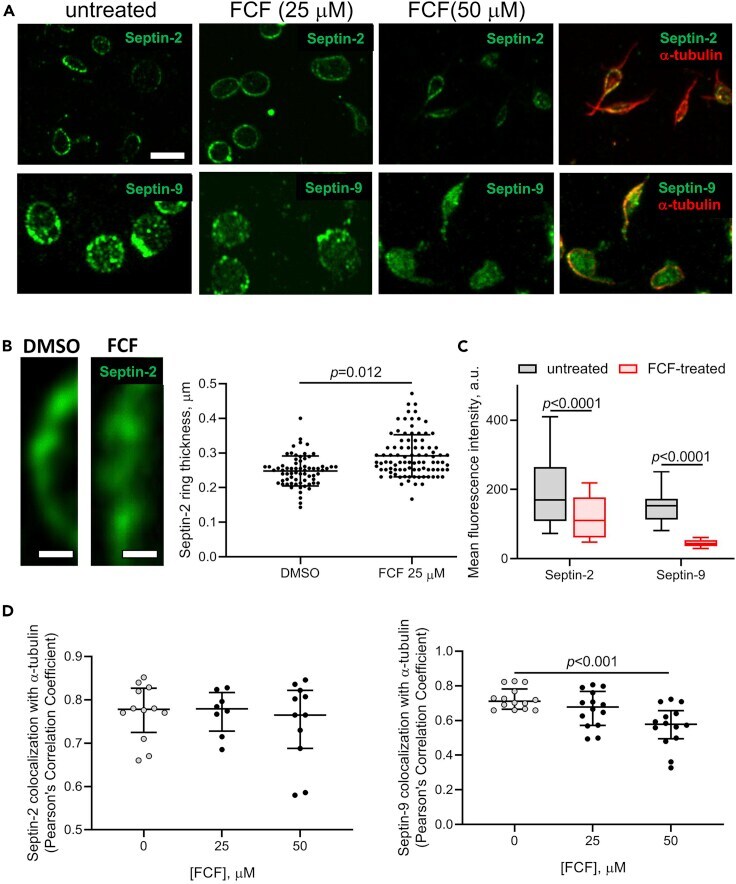
- Structural rearrangements of Septin-2 and Septin-9 in resting platelets induced by FCF, the inhibitor of septin dynamics (A) Representative immunofluorescence images of Septin-2, Septin-9 and alpha-tubulin in DMSO-treated (control) and FCF-treated resting platelets showing dose-dependent intraplatelet structural alterations by FCF. Scale bar = 3 mum. Projections of optical z stack slices. (B) FCF-induced changes in the thickness of Septin-2-ring-like circular structures: (left) a segment of the Septin-2 ring in the absence and presence of FCF; (right) quantification of the Septin-2 ring thickness in untreated and FCF-treated platelets (n > 70, Mean +- SD). Scale bar = 0.4 mum. Significance tested by the two-tailed Mann-Whitney U test. (C) Mean fluorescence intensity of Septin-2 and Septin-9 in the absence (n = 110 cells) and presence (n = 110) of 50 muM FCF measured at the identical settings of a confocal fluorescent microscope. The results are presented as a median and IQR. Significance tested by the Mann-Whitney. (D) FCF-induced changes in the correlation of fluorescence intensity (Pearson) between Septin-2 and alpha-tubulin (D, left) and Septin-9 and alpha-tubulin (D, right), showing reduction of the spatial overlap between septins and alpha-tubulin in the presence of FCF. Data are presented as a median and IQR. Significance tested by the Kruskal-Wallis test with post hoc Dunn's correction for multiple comparisons. Data in (C and D) are presented as a median and IQR.
- Submitted by
- Invitrogen Antibodies (provider)
- Main image
- Experimental details
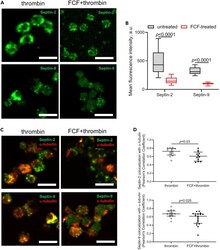
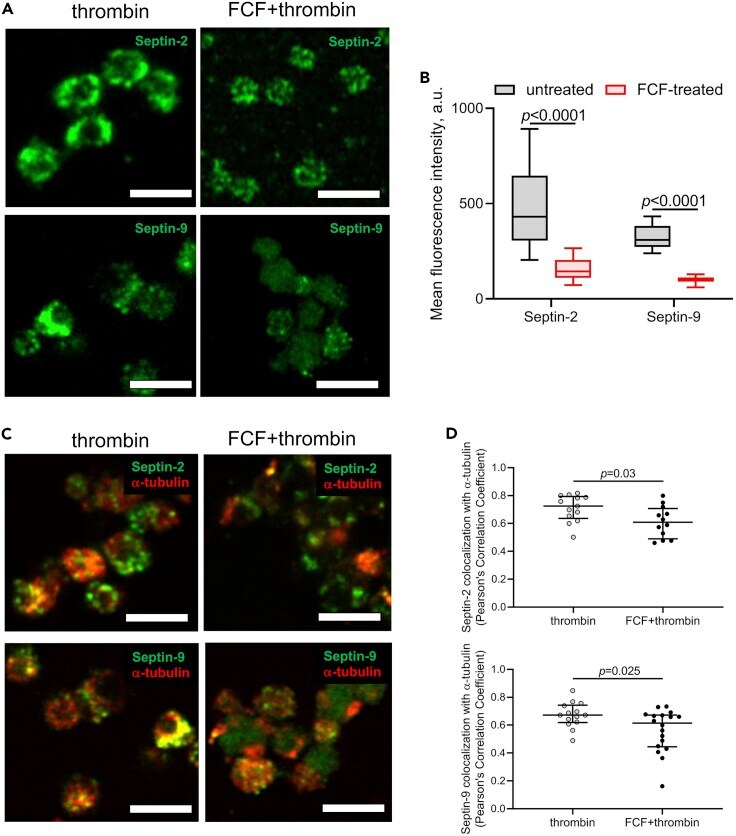
- Structural alterations induced by a septin inhibitor FCF in thrombin-activated platelets (A) Immunofluorescence confocal microscopy of Septin-2 and Septin-9 in thrombin-activated platelets in the absence and presence of 50 muM of FCF showing decrease of sepins compaction caused by FCF. Scale bar = 3 mum. Projections of optical z stack slices. (B) Images in A quantified in terms of the mean fluorescence intensity measured at the identical settings of a confocal fluorescent microscope (n = 80 cells, Median and IQR). (C) Immunofluorescence microscopy of Septin-2, Septin-9 and alpha-tubulin in thrombin-activated platelets in the absence and presence of 50 muM of FCF. (D) FCF-induced changes in the fluorescence correlation (Pearson) between Septin-2 and alpha-tubulin (D, top) and Septin-9 and alpha-tubulin (D, bottom), displaying reduced spatial association between septins and tubulin. The results are presented as a median and IQR. Significance tested by the Mann-Whitney U-test.
- Submitted by
- Invitrogen Antibodies (provider)
- Main image
- Experimental details
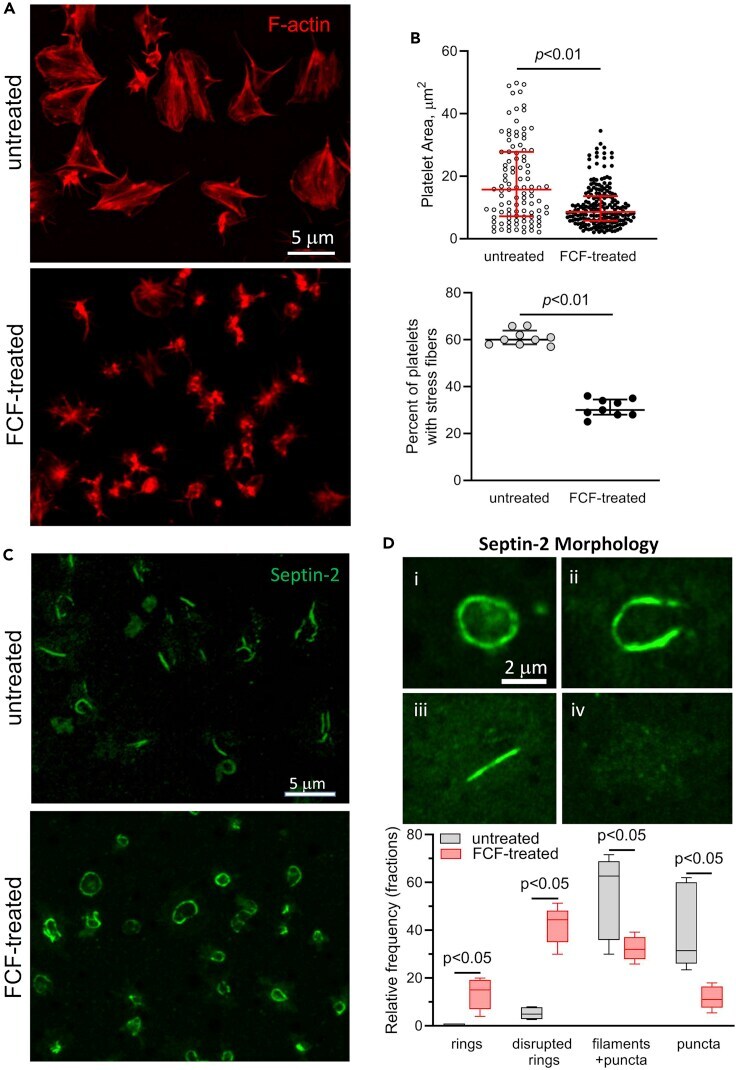
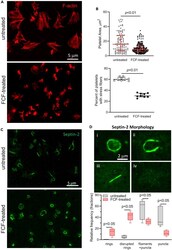
- Abrogation of platelet spreading and supramolecular structural alterations of Septin-2 induced by FCF in spread platelets (A) Gel-filtered platelets spread on a fibrinogen-coated surface for 60 min, followed by fixation and staining for Septin-2 and F-actin. The images are the projections of optical z stack slices. (B) The degree of platelet spreading in the absence and presence of FCF (50 muM) were quantified in terms of the spread area per platelet. The effect of septin dynamics inhibition on formation of stress fibers in spread platelets was evaluated by calculating the fraction of platelets having stress fibers in the presence and absence of FCF (n > 100 cells, Median and IQR). Significance tested by two-tail Mann-Whitney. (C) Representative confocal microscopy images of Septin-2 in isolated platelets spread on fibrinogen for 60 min in the absence and presence of FCF, 50 muM. (D) Four types of Septin-2 structures identified in spread platelets: continuous subcortical rings (i), partially discontinued rings (ii), filamentous structures surrounded by fluorescent puncta (iii), single puncta stained for Septin-2 (iv). Quantification of Septin-2 structures in spread platelets in the absence and presence of FCF in terms of the relative frequency of Septin-2 structures defined in (i-iv). n = 50-80 cells per sample, N = 3 donors, Median and IQR. Significance tested by two-tail Mann-Whitney.