 Explore
 Validate
 Learn
Learn14-1969-82
antibody from Invitrogen Antibodies
Targeting: CCR6
BN-1, CD196, CKR-L3, CMKBR6, DCR2, DRY-6, GPR-CY4, GPR29, STRL22
 Western blot
 Immunoprecipitation
 Flow cytometry
Antibody data
- Antibody Data
- Antigen structure
- References [11]
- Comments [0]
- Validations
- Flow cytometry [2]
- Other assay [12]
Submit
Validation data
Reference
Comment
Report error
- Product number
- 14-1969-82 - Provider product page

- Provider
- Invitrogen Antibodies
- Product name
- CD196 (CCR6) Monoclonal Antibody (R6H1), eBioscience™
- Antibody type
- Monoclonal
- Antigen
- Other
- Description
- Description: This R6H1 monoclonal antibody reacts with CD196 (also known as CCR6), a seven transmembrane G protein-coupled receptor expressed on T, B, dendritic, natural killer, and Langerhans cells. This CC chemokine receptor uniquely binds MIP-3a/CCL20, a chemoattractant for dendritic cells, effector/memory T cells, and B cells. CD196 is also involved in host defense and inflammation at epithelial sites. Furthermore, this receptor has been implicated in Th17 differentiation and CD4+FoxP3+ regulatory T cell development. Applications Reported: This R6H1 antibody has been reported for use in flow cytometric analysis, immunoblotting (WB), and immunoprecipitation. Applications Tested: This R6H1 antibody has been tested by western blot on lysates prepared from normal human peripheral blood cells. This antibody can be used at less than or equal to 5 µg/mL. Purity: Greater than 90%, as determined by SDS-PAGE. Aggregation: Less than 10%, as determined by HPLC. Filtration: 0.2 µm post-manufacturing filtered.
- Reactivity
- Human
- Host
- Mouse
- Isotype
- IgG
- Antibody clone number
- R6H1
- Vial size
- 100 μg
- Concentration
- 0.5 mg/mL
- Storage
- 4°C
Submitted references Common transcriptional programs and the role of chemokine (C-C motif) ligand 20 (CCL20) in cell migration of cholangiocarcinoma.
Transcriptional Regulation of CD40 Expression by 4 Ribosomal Proteins via a Functional SNP on a Disease-Associated CD40 Locus.
The Calcineurin Inhibitor Tacrolimus Specifically Suppresses Human T Follicular Helper Cells.
The Rheumatoid Arthritis Risk Variant CCR6DNP Regulates CCR6 via PARP-1.
Expression of CCL20 and Its Corresponding Receptor CCR6 Is Enhanced in Active Inflammatory Bowel Disease, and TLR3 Mediates CCL20 Expression in Colonic Epithelial Cells.
CCR6 is a prognostic marker for overall survival in patients with colorectal cancer, and its overexpression enhances metastasis in vivo.
CCL20 Secretion from the Nucleus Pulposus Improves the Recruitment of CCR6-Expressing Th17 Cells to Degenerated IVD Tissues.
Regulation of IL-17 in human CCR6+ effector memory T cells.
Human T cells that are able to produce IL-17 express the chemokine receptor CCR6.
Human Th17 cells share major trafficking receptors with both polarized effector T cells and FOXP3+ regulatory T cells.
Down-regulation of the beta-chemokine receptor CCR6 in dendritic cells mediated by TNF-alpha and IL-4.
Win Maung HM, Chan-On W, Kunkeaw N, Khaenam P
EXCLI journal 2020;19:154-166
EXCLI journal 2020;19:154-166
Transcriptional Regulation of CD40 Expression by 4 Ribosomal Proteins via a Functional SNP on a Disease-Associated CD40 Locus.
Zou M, Zhang X, Jiang D, Zhao Y, Wu T, Gong Q, Su H, Wu D, Moreland L, Li G
Genes 2020 Dec 21;11(12)
Genes 2020 Dec 21;11(12)
The Calcineurin Inhibitor Tacrolimus Specifically Suppresses Human T Follicular Helper Cells.
Wallin EF, Hill DL, Linterman MA, Wood KJ
Frontiers in immunology 2018;9:1184
Frontiers in immunology 2018;9:1184
The Rheumatoid Arthritis Risk Variant CCR6DNP Regulates CCR6 via PARP-1.
Li G, Cunin P, Wu D, Diogo D, Yang Y, Okada Y, Plenge RM, Nigrovic PA
PLoS genetics 2016 Sep;12(9):e1006292
PLoS genetics 2016 Sep;12(9):e1006292
Expression of CCL20 and Its Corresponding Receptor CCR6 Is Enhanced in Active Inflammatory Bowel Disease, and TLR3 Mediates CCL20 Expression in Colonic Epithelial Cells.
Skovdahl HK, Granlund Av, Østvik AE, Bruland T, Bakke I, Torp SH, Damås JK, Sandvik AK
PloS one 2015;10(11):e0141710
PloS one 2015;10(11):e0141710
CCR6 is a prognostic marker for overall survival in patients with colorectal cancer, and its overexpression enhances metastasis in vivo.
Liu J, Ke F, Xu Z, Liu Z, Zhang L, Yan S, Wang Z, Wang H, Wang H
PloS one 2014;9(6):e101137
PloS one 2014;9(6):e101137
CCL20 Secretion from the Nucleus Pulposus Improves the Recruitment of CCR6-Expressing Th17 Cells to Degenerated IVD Tissues.
Zhang W, Nie L, Wang Y, Wang XP, Zhao H, Dongol S, Maharjan S, Cheng L
PloS one 2013;8(6):e66286
PloS one 2013;8(6):e66286
Regulation of IL-17 in human CCR6+ effector memory T cells.
Liu H, Rohowsky-Kochan C
Journal of immunology (Baltimore, Md. : 1950) 2008 Jun 15;180(12):7948-57
Journal of immunology (Baltimore, Md. : 1950) 2008 Jun 15;180(12):7948-57
Human T cells that are able to produce IL-17 express the chemokine receptor CCR6.
Singh SP, Zhang HH, Foley JF, Hedrick MN, Farber JM
Journal of immunology (Baltimore, Md. : 1950) 2008 Jan 1;180(1):214-21
Journal of immunology (Baltimore, Md. : 1950) 2008 Jan 1;180(1):214-21
Human Th17 cells share major trafficking receptors with both polarized effector T cells and FOXP3+ regulatory T cells.
Lim HW, Lee J, Hillsamer P, Kim CH
Journal of immunology (Baltimore, Md. : 1950) 2008 Jan 1;180(1):122-9
Journal of immunology (Baltimore, Md. : 1950) 2008 Jan 1;180(1):122-9
Down-regulation of the beta-chemokine receptor CCR6 in dendritic cells mediated by TNF-alpha and IL-4.
Carramolino L, Kremer L, Goya I, Varona R, Buesa JM, Gutiérrez J, Zaballos A, Martínez-A C, Márquez G
Journal of leukocyte biology 1999 Nov;66(5):837-44
Journal of leukocyte biology 1999 Nov;66(5):837-44
No comments: Submit comment
Supportive validation
- Submitted by
- Invitrogen Antibodies (provider)
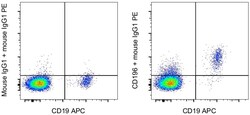
- Main image

- Experimental details
- Normal human peripheral blood cells cells were stained with CD19 Monoclonal Antibody, APC (Product # 17-0199-42) and 0.125 µg of Mouse IgG1 kappa Isotype Control (Product # 14-4714-85) (left) or 0.125 µg of CD196 Monoclonal Antibody (right) followed by IgG1 Monoclonal Antibody, PE (Product # 12-4015-82). Cells in the lymphocyte gate were used for analysis.

- Submitted by
- Invitrogen Antibodies (provider)
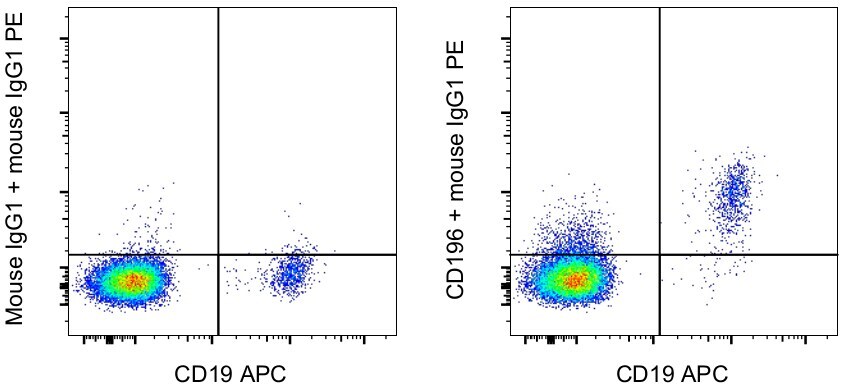
- Main image
- Experimental details
- Normal human peripheral blood cells cells were stained with CD19 Monoclonal Antibody, APC (Product # 17-0199-42) and 0.125 µg of Mouse IgG1 kappa Isotype Control (Product # 14-4714-85) (left) or 0.125 µg of CD196 Monoclonal Antibody (right) followed by IgG1 Monoclonal Antibody, PE (Product # 12-4015-82). Cells in the lymphocyte gate were used for analysis.
Supportive validation
- Submitted by
- Invitrogen Antibodies (provider)
- Main image
- Experimental details
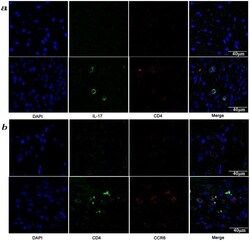
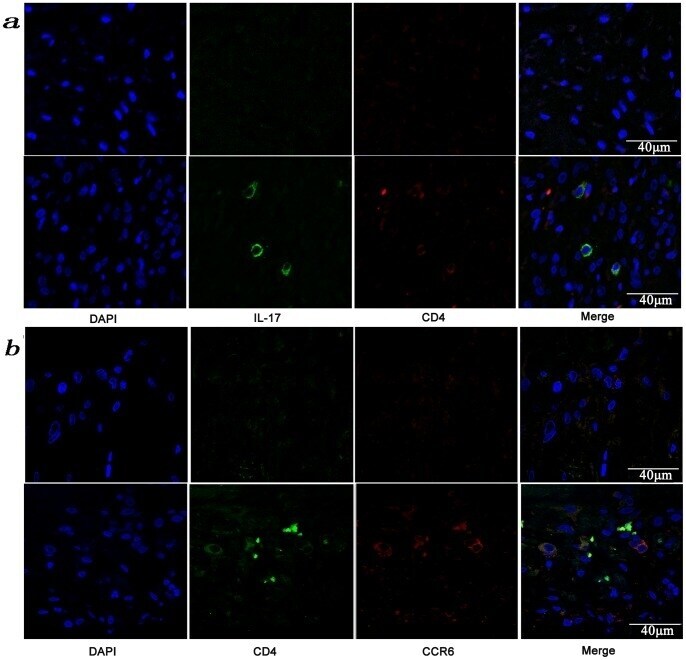
- Figure 3 Presence of IL-17-producing cells in the degenerated IVD tissues. Fifty IVD tissue samples (Group P, n = 20 and Group E, n = 30) from disc degeneration patients and 3 from scoliosis patients were analyzed. In Group P or the control group, there were few or no positive cells (data not shown). The representative results of group E are shown. (a), IL-17-producing cells were detected by a rabbit anti-IL-17 polyclonal antibody and a mouse anti-CD4 monoclonal Ab, followed by secondary staining with an Alexa 488-conjugated donkey anti-rabbit and an Alexa 568-conjugated donkey anti-mouse IgG. DAPI mounting medium was used for nuclear staining. (b), surface CCR6 expression on the cells was detected with a rabbit anti CD4 monoclonal Ab and a mouse anti-CCR6 monoclonal Ab, followed by secondary staining with an Alexa 488-conjugated donkey anti-rabbit and an Alexa 568-conjugated donkey anti-mouse IgG. DAPI mounting medium was used for nuclear staining. In the top panel, green and red represents the expression of IL-17 and CD4, respectively, and the double-stained cells represent the IL-17-producing cells. In the bottom panel, green and red represents the expression of CD4 and CCR6, respectively, and the double-stained cells demonstrate the surface expression of CCR6 on T lymphocytes.
- Submitted by
- Invitrogen Antibodies (provider)
- Main image

- Experimental details
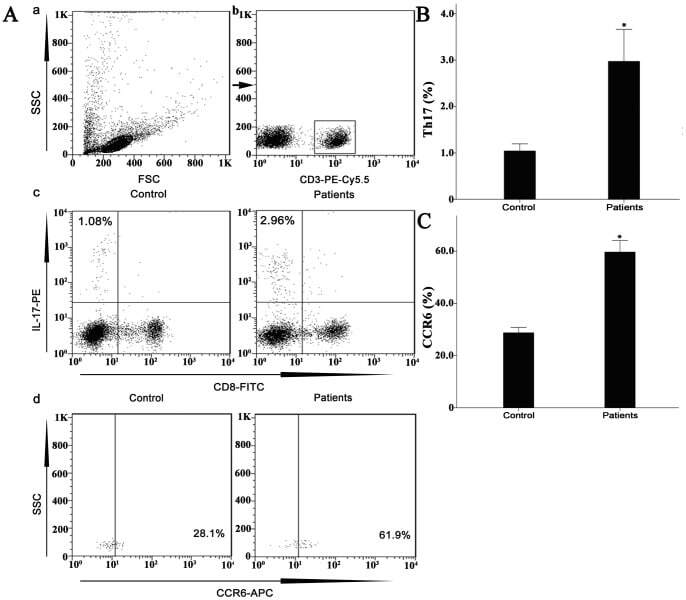
- Figure 7 Circulating percentages of Th17 cells and CCR6-positive cells in peripheral blood are increased in IVD degenerated patients when compared with controls. Heparinized peripheral whole blood cells from 20 patients and 15 healthy controls were stimulated with phorbol myristate acetate (PMA), ionomycin, and monensin for 4 h and subsequently stained with fluorochrome-labeled antibodies as described in Materials and Methods. A(a) Lymphocytes were gated by flow cytometry. A(b) CD3 + T subsets were gated by flow cytometry; the plots in the inset box represent the CD3 + T cells. A(c) Representative IL-17 expression levels in the CD3 + CD8 - T subsets (CD4 + T subsets) from each group are shown. The percentages of positive cells are shown in the upper left panels. A(d) Representative surface CCR6 expression levels on the CD3 + CD8 - IL-17 + subsets from each group are shown. The percentages of positive cells are shown in the right panel. (B) The percentage of circulating Th17 cells was significantly higher in IVD degenerated patients (2.973+-0.689%) than in the control group (1.039+-0.156%; *, p
- Submitted by
- Invitrogen Antibodies (provider)
- Main image
- Experimental details
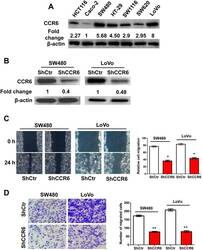
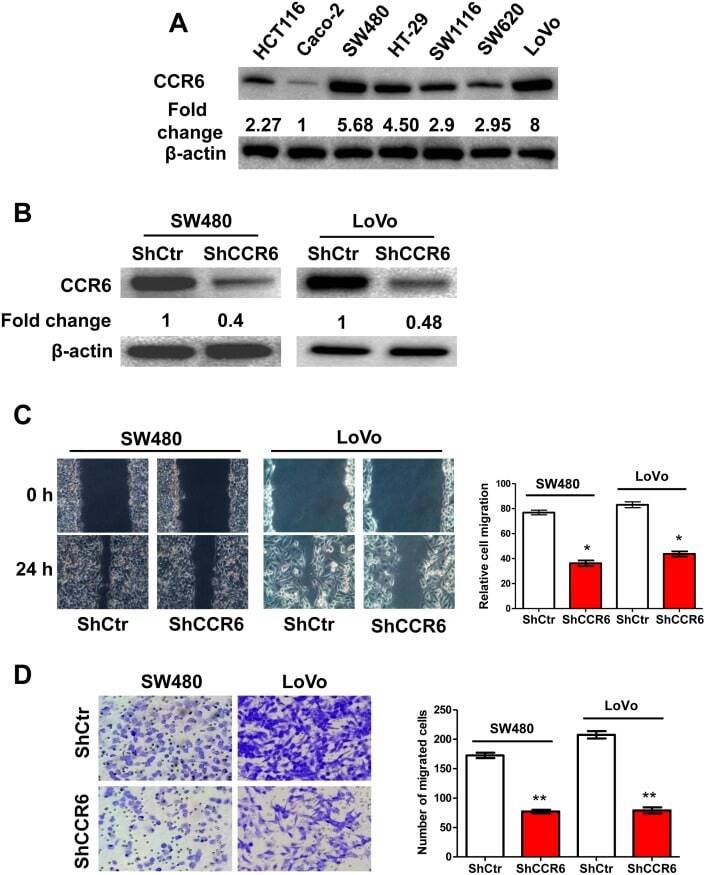
- Figure 3 Knockdown of CCR6 by shRNA Inhibits CRC Cell Migration in vitro . (A) Western blotting analysis of CCR6 levels in 7 cultured CRC cell lines. Values were expressed as fold changes relative to Caco-2, and normalized to beta-actin. (B) Western blotting analysis of knockdown of CCR6 in SW480 and LoVo cells, beta-actin served as a loading control. Values were expressed as fold changes relative to controls (ShCtr), and normalized to beta-actin. (C) Wound-healing assays for motility of CCR6-silenced SW480 and LoVo cells and control cells. Representative pictures of one field at the beginning (t = 0 hr) (upper panel) and at the end of the recording (t = 24 hr) (lower panel) in each condition are shown. The relative cell migration in ShCtr and shCCR6 groups are shown in the right panel. (D) Representative images of transwell migrated cells in CCR6-silenced SW480 and LoVo cells (lower panel) or control cells (upper panel) cells. The numbers of migrated cells in ShCtr and shCCR6 groups are shown in the right panel. Values represent mean from triplicate wells, +- S.D. * p
- Submitted by
- Invitrogen Antibodies (provider)
- Main image
- Experimental details
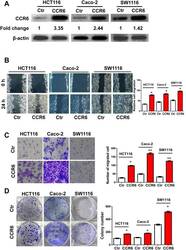
- Figure 4 Enhanced Proliferation and Migration of CRC cells with Overexpressed CCR6. (A) Western blotting analysis of ectopic expression of CCR6 in HCT116 Ctr and HCT116 CCR6 cells or Caco-2 Ctr and Caco-2 CCR6 or SW1116 Ctr and SW1116 CCR6 cells. beta-actin served as a loading control. Values were expressed as fold changes relative to controls (Ctr), and normalized to beta-actin. (B) Wound-healing assay for motility of HCT116 Ctr and HCT116 CCR6 or Caco-2 Ctr and Caco-2 CCR6 or SW1116 Ctr and SW1116 CCR6 cells. Representative pictures of one field at the beginning (t = 0) (upper panel) and at the end of the recording (t = 24 h) (lower panel) in each condition are shown. The relative cell migration in CCR6 and control groups are shown in the right panel. (C) Representative images of transwell migrated cells in stably transfected HCT116 Ctr , Caco-2 Ctr , SW1116 Ctr (upper panel) or HCT116 CCR6 , Caco-2 CCR6 , SW1116 CCR6 (lower panel) cells. Average number of migrated cells of HCT116 Ctr and HCT116 CCR6 or Caco-2 Ctr and Caco-2 CCR6 or SW1116 Ctr and SW1116 CCR6 cells are shown in the right panel. (D) Representative image of colony formation in HCT116 Ctr , Caco-2 Ctr , SW1116 Ctr (upper panel) or HCT116 CCR6 , Caco-2 CCR6 , SW1116 CCR6 cells (lower panel). Values represent mean from triplicate wells, +- S.D. * p

- Submitted by
- Invitrogen Antibodies (provider)
- Main image

- Experimental details
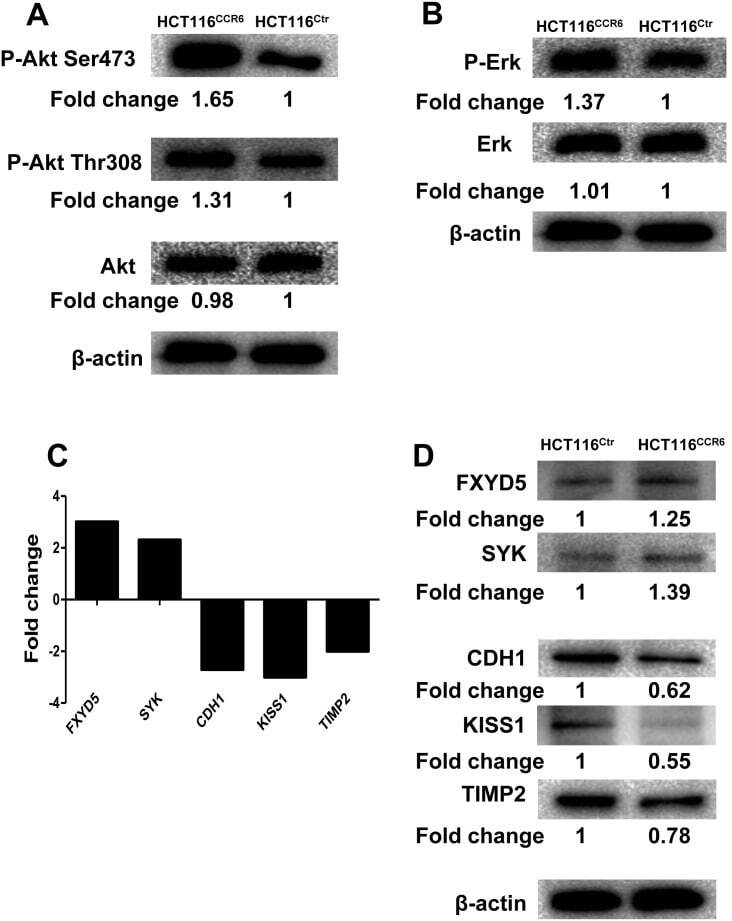
- Figure 6 Signaling Pathway Involved in the Aggressiveness of HCT116 CCR6 . (A, B) Western blotting analysis of Erk1/2 or phospho-Erk1/2 and Akt, phosphorylated Akt (Ser473) or phosphorylated Akt (Ser308) in HCT116 CCR6 and HCT116 Ctr cells. Values were expressed as fold changes relative to HCT116 Ctr , and normalized to beta-actin. (C) Upregulated (FXYD5 and SYK) or down-regulated genes (CDH1, KISS1 and TIMP2) in HCT116 CCR6 cells screening with a human tumor metastasis RT 2 profiler PCR Array. (D) Western blotting analysis of changed FXYD5, SYK, CDH1, KISS1 and TIMP2 genes in HCT116 CCR6 and HCT116 Ctr cells. Values were expressed as fold changes relative to HCT116 Ctr , and normalized to beta-actin.
- Submitted by
- Invitrogen Antibodies (provider)
- Main image

- Experimental details
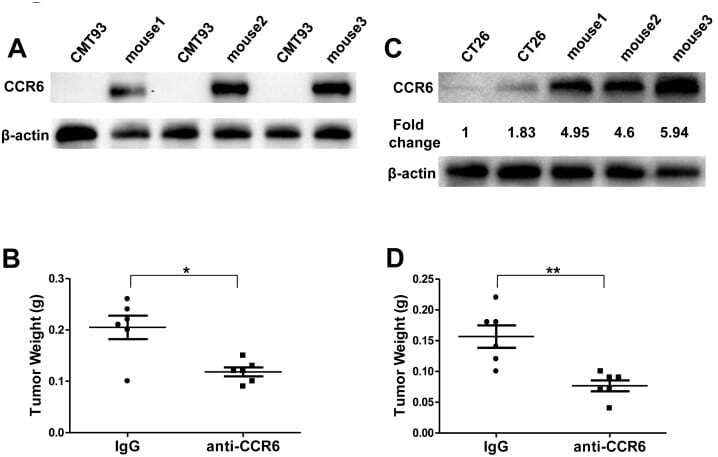
- Figure 7 Inhibition of Mouse CRC Progression by Targeting Tumor-expressing CCR6. (A) Western blotting analysis of CCR6 in murine CMT93 colorectal tumor cell line and CRC tissue derived from CCR6 -/- mice grafted with CMT93 at day10. (B) Statistical analysis of tumor weight in each group treated with IgG or anti-CCR6. (C) Western blotting of CCR6 in murine CT26 colorectal tumor cell line and CRC tissue derived from Balb/c mice grafted with CT26 at day 10. (D) Statistical analysis of tumor weight in each group treated with IgG or anti-CCR6. * p
- Submitted by
- Invitrogen Antibodies (provider)
- Main image
- Experimental details
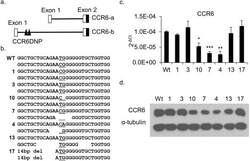
- Fig 1 Characterization of mutated HCT116 clones generated by TALENs targeting the CCR6DNP. (a) Partial genomic arrangement of CCR6 showing alternative transcripts CCR6-a and CCR6-b and the location of CCR6DNP. Only CCR-b could be detected in HCT116 and Jurkat T cells by real time PCR (see S3 Fig ). (b) Sequence of the three alleles of CCR6DNP in 7 representative targeted HCT116 clones. The CCR6DNP is underlined. (c) and (d) Expression of CCR6 in the 7 targeted clones by qPCR and Western blot. For qPCR, data are shown as mean+-s.d. ( n = 3). Sequence, sequence trace and expression data for all 17 mutated HCT116 clones are in S1 and S2 Figs. Statistical significance in 1c reflects comparison to WT.

- Submitted by
- Invitrogen Antibodies (provider)
- Main image
- Experimental details
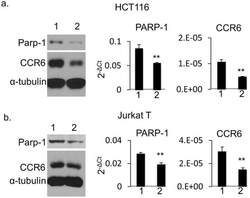
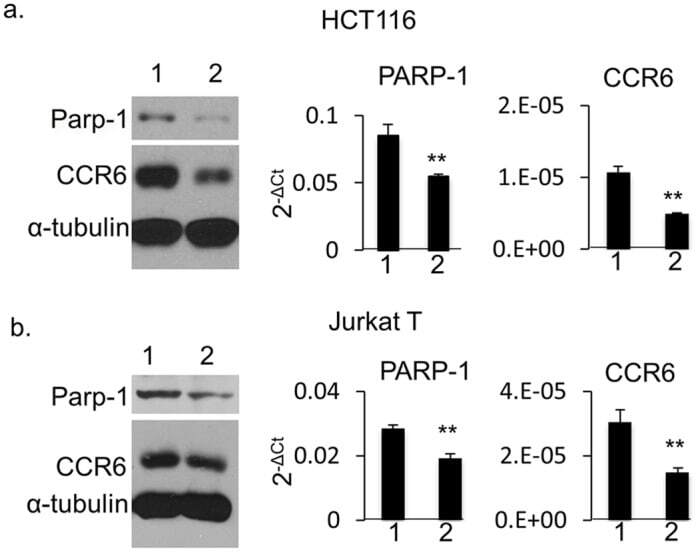
- Fig 5 CCR6 expression in PARP-1 knockdown human cells. HCT116 cells (a) and Jurkat T cells (b) by Western blot (left), and qPCR analysis on PARP-1 (middle) and on CCR6 (right). For Western blot, whole cell extract was isolated and separated on SDS-PAGE gel. Western blot was detected with mouse anti-human PARP-1, CCR6 and alpha-tubulin antibodies simultaneously. Lane 1: negative control for shRNA. Lane 2: shRNA treatment for HCT116 cells or siRNA treatment for Jurkat T cells. For qPCR, data are shown as mean+-s.d. ( n = 3).
- Submitted by
- Invitrogen Antibodies (provider)
- Main image
- Experimental details
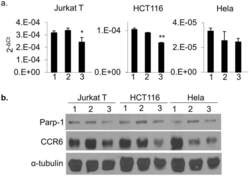
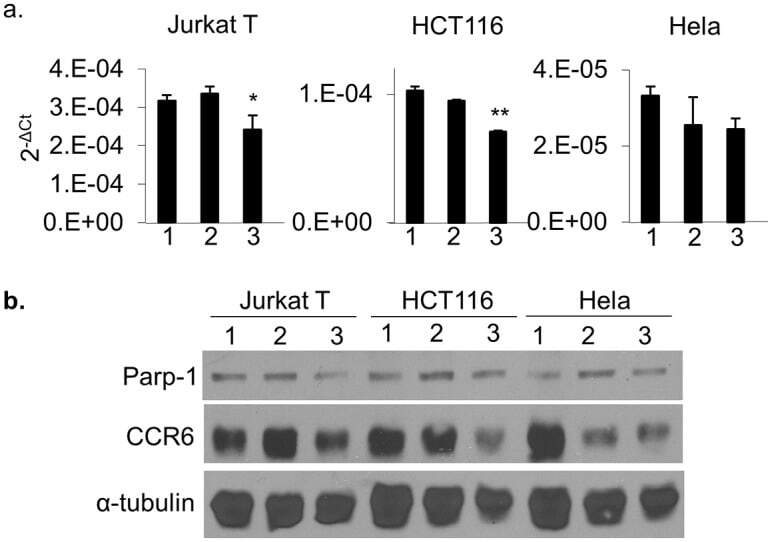
- Fig 6 CCR6 expression in human cells treated with 3-aminobenzamide. (a) qPCR and (b) Western blot to show expression of CCR6 and PARP-1 in Jurkat T cells, HCT116 and Hela cells. Cells were treated with 0 mM (lane 1), 5 mM (lane 2) and 10 mM (lane 3) 3-AB for 72 hrs. For qPCR, data are shown as mean+-s.d. ( n = 3).
- Submitted by
- Invitrogen Antibodies (provider)
- Main image
- Experimental details
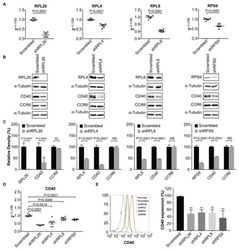
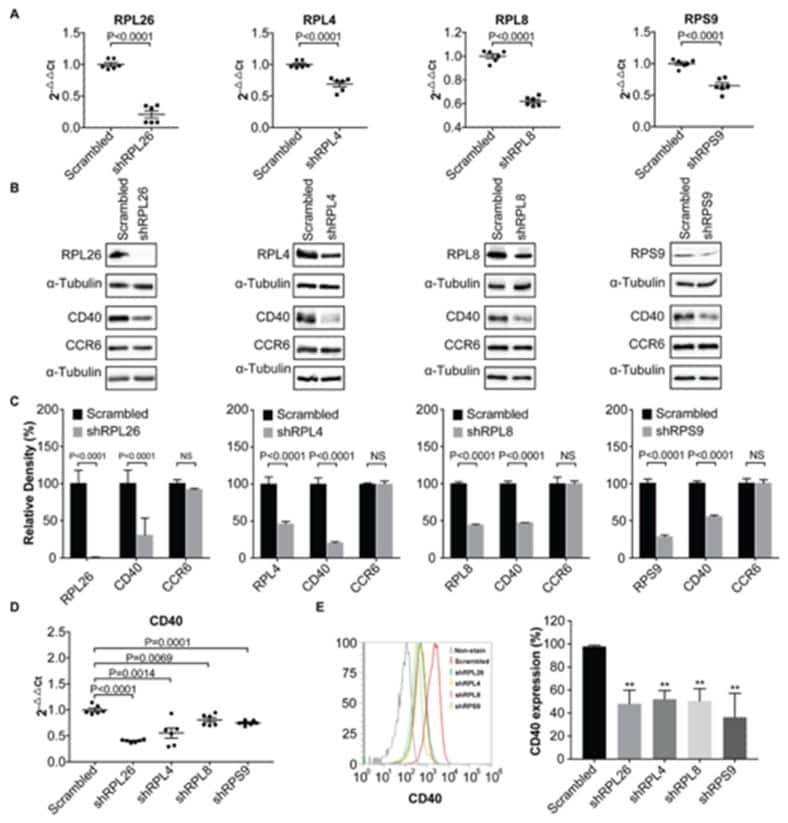
- Figure 1 Demonstration of RPL26, RPL4, RPL8, and RPS9 , as CD40 transcription regulators in human B cells. ( A ) Knockdown of RPL26, RPL4, RPL8 , and RPS9 , in human BL2 cells using shRNA as shown by real time PCR. ( B ) Western blots showing downregulation of RPL26, RPL4, RPL8, and RPS9 results in decreased expression of CD40 , but not CCR6 in BL2 cells. Whole cell protein was used for Western blots. ( C ) Statistical analysis of Western blots in ( B ) based on relative density. NS: not significant. ( D ) Down-regulation of CD40 expression on mRNA levels in the knockdown cells, suggesting a transcriptional regulation of CD40 expression. alpha-Tubulin was used for loading control. CCR6 was used as a negative control for translational regulation. ( E ) FACS analysis of CD4 0 surface expression in the RPL26, RPL4, RPL8, and RPS9 shRNA knockdown BL2 cells. Scrambled: scrambled shRNA control. sh: shRNA. **: p value < 0.01.
- Submitted by
- Invitrogen Antibodies (provider)
- Main image
- Experimental details
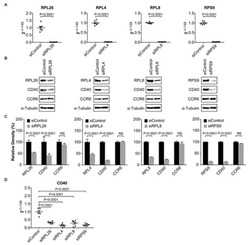
- Figure 2 Demonstration of RPL26, RPL4, RPL8 , and RPS9 as CD40 transcription regulators in human FLS. ( A ) Real time PCR showing downregulation of RPL26 , RPL4 , RPL8 , and RPS9 in FLS by siRNA. ( B ) Western blot showing reduced CD40 expression in RPL26, RPL4, RPL8 , and RPS9 knockdown cells by siRNA. CCR6 was used as a negative control for translational regulation. ( C ) Statistical analysis of Western blots in ( B ) based on relative density. NS: not significant. ( D ) Real time PCR showing reduced CD40 expression in downregulation of RPL26, RPL4, RPL8, and RPS9 in FLS. si: siRNA.
- Submitted by
- Invitrogen Antibodies (provider)
- Main image
- Experimental details
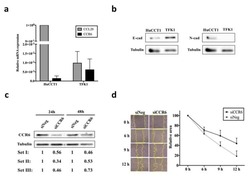
- Figure 3 mRNA and protein expression of CCL20 and CCR6 , and the effect of CCR6 knockdown on wound healing ability in CCA cell lines. a) Real-time RT-PCR for CCL20 (gray bar) and CCR6 (black bar) in HuCCT1 and TFK-1. b) Baseline expression of E-cad and N-cad in HuCCT1 and TFK-1. c) Representative Western blot assays in 24 and 48 h siNeg and siCCR6 transfected HuCCT1. Relative protein expression from 3 independent assays was shown below the corresponding lane. d) Wound healing assay in siNeg and siCCR6 transfected HuCCT1. Image (40X) was recorded at indicated time points, the yellow line highlighted the wound closure area (left). Graph shows mean + SE for relative wound closure area from 3 independent assays in siNeg (circle) and siCCR6 (square) transfected cells (right).
