Explore
 Validate
 Learn
Learn Immunocytochemistry
Antibody data
- Antibody Data
- Antigen structure
- References [5]
- Comments [0]
- Validations
- Immunocytochemistry [2]
- Flow cytometry [1]
- Other assay [4]
Submit
Validation data
Reference
Comment
Report error
- Product number
- 12-4033-82 - Provider product page

- Provider
- Invitrogen Antibodies
- Product name
- GILZ Monoclonal Antibody (CFMKG15), PE, eBioscience™
- Antibody type
- Monoclonal
- Antigen
- Other
- Description
- Description: GILZ is a leucine-zipper-containing protein that is induced by glucocorticoids. It is expressed in mast cells, monocytes, macrophages, dendritic cells, and T cells. GILZ has been shown to inhibit production of IL-2 as well as TCR-driven upregulation of FasL. GILZ mediates these changes in transcription, at least in part, by inhibiting DNA-binding of the transcription factors AP-1 and NF-kappaB. GILZ has also been shown to mediate anti-inflammatory signals in macrophages and dendritic cells by interfering with NF-kappaB-mediated signaling. Although GILZ has been reported to localize to the nucleus, more recent reports as well as testing at eBioscience have observed predominantly cytoplasmic staining. Applications Reported: This CFMKG15 antibody has been reported for use in intracellular staining followed by flow cytometric analysis and immunocytochemistry. Applications Tested: This CFMKG15 antibody has been tested by intracellular flow cytometric analysis of dexamethasone-treated mouse lymph node cells and human peripheral blood cells. This can be used at less than or equal to 0.5 µg per test. A test is defined as the amount (µg) of antibody that will stain a cell sample in a final volume of 100 µL. Cell number should be determined empirically but can range from 10^5 to 10^8 cells/test. It is recommended that the antibody be carefully titrated for optimal performance in the assay of interest. For intracellular staining with CFMKG15, it is recommended to use IC Fixation Buffer (Product # 00-8222-49) followed by permeabilization with a 1X dilution of the 10X Permeabilization Buffer (Product # 00-8333-56). Excitation: 488-561 nm; Emission: 578 nm; Laser: Blue Laser, Green Laser, Yellow-Green Laser. Filtration: 0.2 µm post-manufacturing filtered.
- Reactivity
- Human, Mouse
- Host
- Rat
- Conjugate
- Yellow dye
- Isotype
- IgG
- Antibody clone number
- CFMKG15
- Vial size
- 100 μg
- Concentration
- 0.2 mg/mL
- Storage
- 4°C, store in dark, DO NOT FREEZE!
Submitted references Integrin α4β1/VCAM-1 Interaction Evokes Dynamic Cell Aggregation Between Immune Cells and Human Lung Microvascular Endothelial Cells at Infectious Hemolysis.
Chronic stress physically spares but functionally impairs innate-like invariant T cells.
Regulation of Innate Lymphoid Cells in Acute Kidney Injury: Crosstalk between Cannabidiol and GILZ.
Altered glucocorticoid metabolism represents a feature of macroph-aging.
Induction of Glucocorticoid-induced Leucine Zipper (GILZ) Contributes to Anti-inflammatory Effects of the Natural Product Curcumin in Macrophages.
Lou HY, Yan HP, Yang LG, Fan JH, Cho WC, Xiao ZH, Li SJ
Frontiers in pharmacology 2021;12:653143
Frontiers in pharmacology 2021;12:653143
Chronic stress physically spares but functionally impairs innate-like invariant T cells.
Rudak PT, Choi J, Parkins KM, Summers KL, Jackson DN, Foster PJ, Skaro AI, Leslie K, McAlister VC, Kuchroo VK, Inoue W, Lantz O, Haeryfar SMM
Cell reports 2021 Apr 13;35(2):108979
Cell reports 2021 Apr 13;35(2):108979
Regulation of Innate Lymphoid Cells in Acute Kidney Injury: Crosstalk between Cannabidiol and GILZ.
Baban B, Khodadadi H, Vaibhav K, Marchetti C, Riccardi C, Mozaffari MS
Journal of immunology research 2020;2020:6056373
Journal of immunology research 2020;2020:6056373
Altered glucocorticoid metabolism represents a feature of macroph-aging.
Valbuena Perez JV, Linnenberger R, Dembek A, Bruscoli S, Riccardi C, Schulz MH, Meyer MR, Kiemer AK, Hoppstädter J
Aging cell 2020 Jun;19(6):e13156
Aging cell 2020 Jun;19(6):e13156
Induction of Glucocorticoid-induced Leucine Zipper (GILZ) Contributes to Anti-inflammatory Effects of the Natural Product Curcumin in Macrophages.
Hoppstädter J, Hachenthal N, Valbuena-Perez JV, Lampe S, Astanina K, Kunze MM, Bruscoli S, Riccardi C, Schmid T, Diesel B, Kiemer AK
The Journal of biological chemistry 2016 Oct 28;291(44):22949-22960
The Journal of biological chemistry 2016 Oct 28;291(44):22949-22960
No comments: Submit comment
Supportive validation
- Submitted by
- Invitrogen Antibodies (provider)
- Main image

- Experimental details
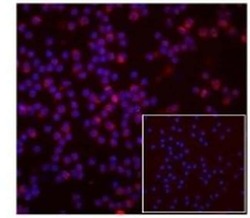
- Normal human peripheral blood cells were cultured for 3 hr with dexamethasone, followed by intracellular staining with 5 µg/mL of Rat IgG2a kappa Isotype Control PE (Product # 12-4321-80) (inset) or 5 µg/mL of Anti-Human/Mouse GILZ PE. Cells were cytospun onto glass slides and the nuclei were counterstained with DAPI.
- Conjugate
- Yellow dye

- Submitted by
- Invitrogen Antibodies (provider)
- Main image
- Experimental details
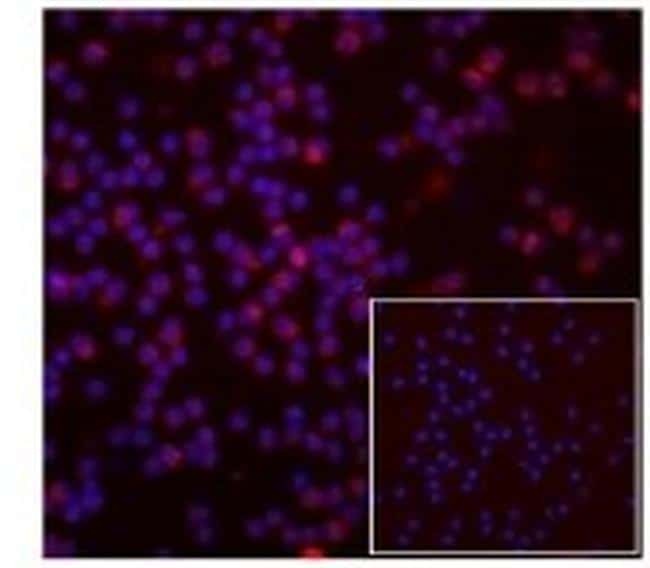
- Normal human peripheral blood cells were cultured for 3 hr with dexamethasone, followed by intracellular staining with 5 µg/mL of Rat IgG2a kappa Isotype Control PE (Product # 12-4321-80) (inset) or 5 µg/mL of Anti-Human/Mouse GILZ PE. Cells were cytospun onto glass slides and the nuclei were counterstained with DAPI.
Supportive validation
- Submitted by
- Invitrogen Antibodies (provider)
- Main image
- Experimental details
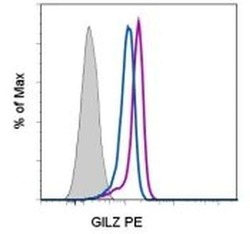
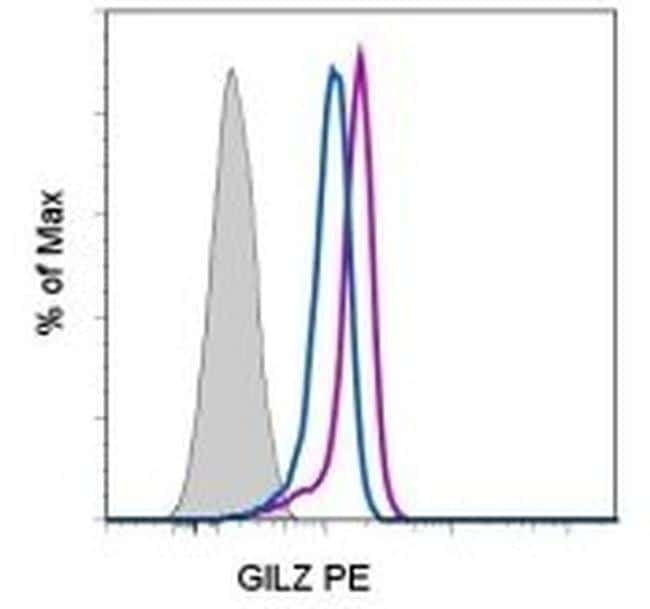
- C57BL/6 lymph node cells were cultured for 3 hr with (purple histogram) or without (blue histogram) dexamethasone, followed by intracellular staining with 0.25 µg of Rat IgG2a kappa Isotype Control PE (Product # 12-4321-80) (filled histogram) or 0.25 µg of Anti-Human/Mouse GILZ PE (filled histograms). CD3+ cells in the lymphocyte gate were used for analysis.
Supportive validation
- Submitted by
- Invitrogen Antibodies (provider)
- Main image
- Experimental details
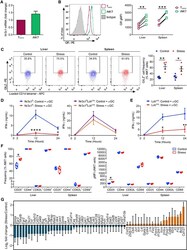
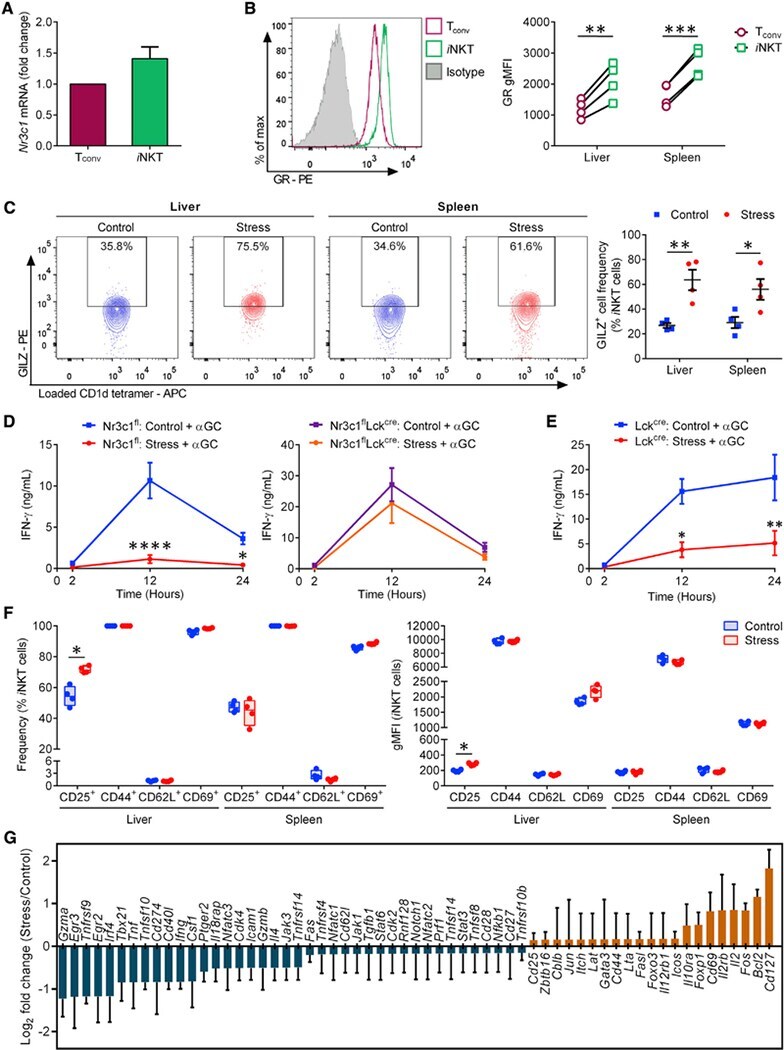
- Figure 4. Stress impedes i NKT cell responses to alphaGC in a cell-autonomous, GR-dependent manner and creates a transcriptomic signature consistent with extensive i NKT cell dysfunctions (A) Hepatic i NKT and T conv cells from naive B6 mice (n = 10 per experiment) were fluorescence-activated cell sorting (FACS) purified and the Nr3c1 mRNA content of i NKT cells relative to that of T conv cells was PCR quantitated. Fold-change values were determined in 3 independent experiments. (B) HMNCs and splenocytes were stained with an anti-GR mAb or a mouse IgG2akappa isotype control. Open histograms illustrate the GR positivity of hepatic i NKT and T conv cells, and the filled histogram corresponds to the staining of TCRbeta + cells with the above isotype control. Summary data depict the geometric mean fluorescence intensity (gMFI) of GR staining. (C) HMNCs and splenocytes from mice that had been restrained or left undisturbed were stained with an anti-GILZ mAb or a rat IgG2akappa isotype control. Representative contour plots depict GILZ + i NKT cell frequencies, which are summarized in scatterplots. (D and E) Nr3c1 fl and Nr3c1 fl Lck cre mice (n = 6-9) (D) and Lck cre mice (n = 4 or 5) (E) were restrained or left undisturbed before they received alphaGC, and serum IFN-gamma was quantitated by ELISA. (F) HMNCs and splenocytes from stressed and control mice were stained with mAbs against CD25, CD44, CD62L, and CD69 or with appropriate isotype controls. Box-and-whisker plots illustrate
- Conjugate
- Yellow dye
- Submitted by
- Invitrogen Antibodies (provider)
- Main image
- Experimental details
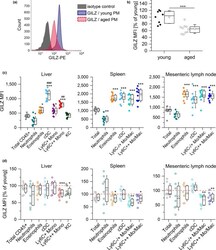
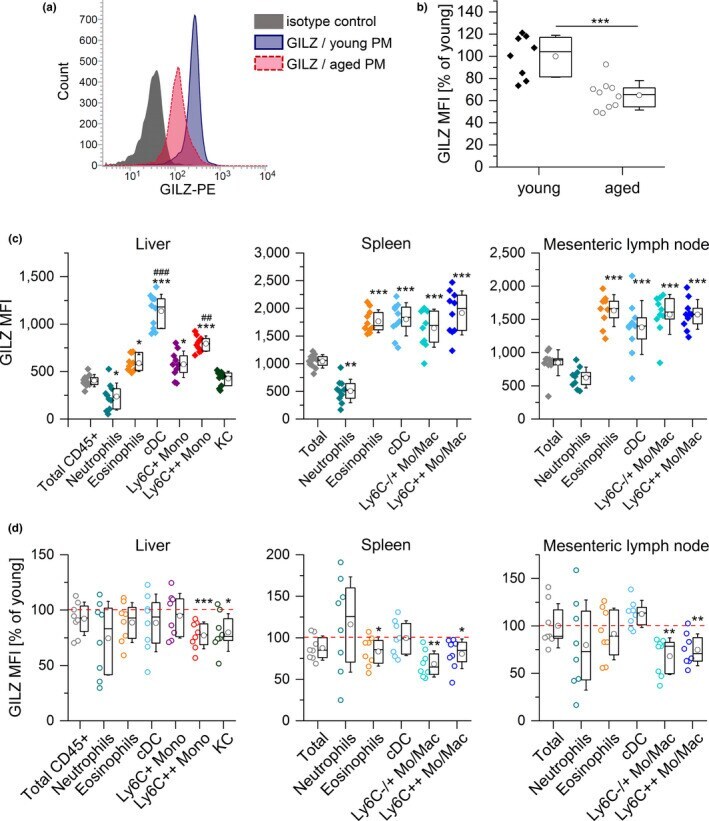
- FIGURE 5 GILZ expression in myeloid cells from young and aged mice. (a, b) GILZ expression in PMs from young and aged mice was determined by flow cytometry. (a) Representative histogram. (b) Background-subtracted GILZ median fluorescence intensity (MFI) (young: n = 8, aged: n = 10). (c) GILZ MFI in myeloid cells in the liver and lymphoid tissues of young mice ( n = 10). *** p < .001 compared with MFI values for total CD45 + (liver) or total cells (spleen and lymph node), ## p < .01, ### p < .001 compared with all other subsets (ANOVA with Bonferroni's post hoc test. (d) GILZ expression in myeloid subsets of aged mice. The GILZ MFI of young cells was set as 100% for each subset ( n = 8). * p < .05, ** p < .01, *** p < .001 compared with the same subset in young animals by Mann-Whitney U test. Box plots show the 25-75th percentiles (box), mean (circle), median (line), and SD (whiskers). Mono: monocytes; Mo/Mac: monocytes and macrophages; cDC: classical dendritic cells; KC: Kupffer cells
- Conjugate
- Yellow dye
- Submitted by
- Invitrogen Antibodies (provider)
- Main image
- Experimental details
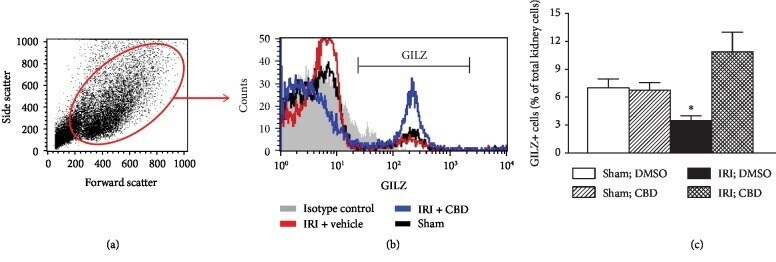
- Figure 4 Effects of cannabidiol on GILZ expression in the kidney. Kidney cell preparations from vehicle- and cannabidiol- (CBD-) treated animals, as described under Methods, were subjected to flow cytometry analyses for GILZ expression. (a) Side scatter vs. forward scatter followed by histogram showing GILZ-positive cells. (c) Means +- SEM of 3 animals for group/condition; each independent experiment included 3 animals. * p < 0.05 compared to other three groups.
- Conjugate
- Yellow dye
- Submitted by
- Invitrogen Antibodies (provider)
- Main image

- Experimental details
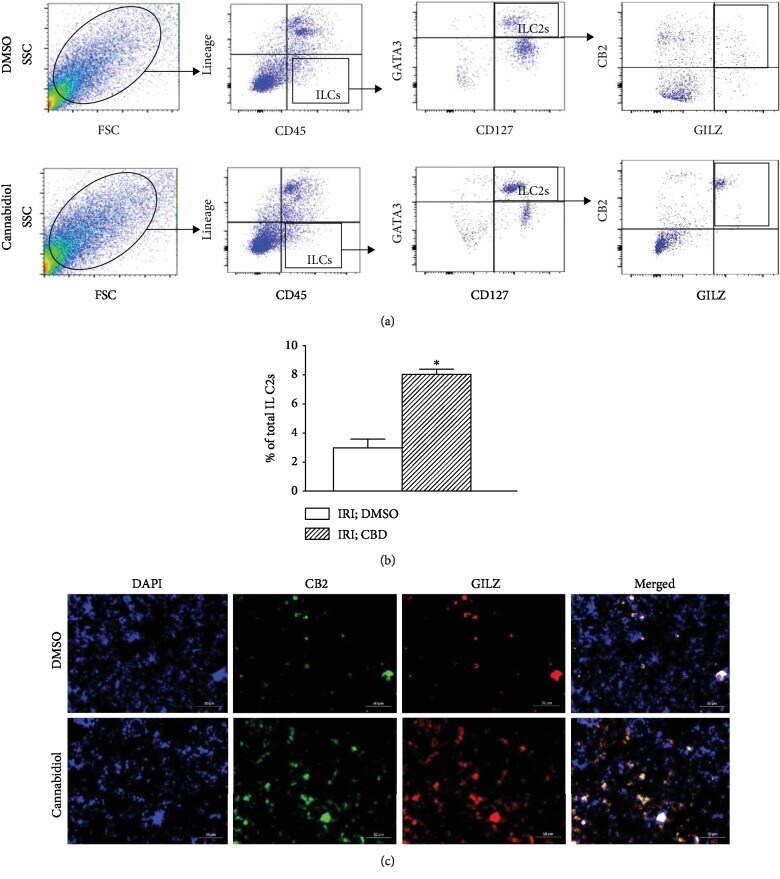
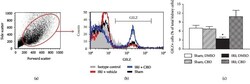
- Figure 6 Effects of cannabidiol on CB2 and GILZ expression in ILC2s. Cell preparations from ischemic-reperfused kidneys of vehicle- (DMSO-) and cannabidiol- (CBD-) treated mice were initially sorted for ILC2s, as described in Methods, followed by their identification as CB2+, GILZ+ ILC2s using both analytical flow cytometry (a, b) and immunofluorescence imaging (c); (b) quantitative data show means +- SEM of n = 3-4 animals/group. * p < 0.05 compared to the other group.
- Conjugate
- Yellow dye