Explore
 Validate
 Learn
Learn Western blot
 Immunocytochemistry
Antibody data
- Antibody Data
- Antigen structure
- References [1]
- Comments [0]
- Validations
- Immunocytochemistry [4]
- Immunohistochemistry [1]
- Other assay [1]
Submit
Validation data
Reference
Comment
Report error
- Product number
- PA5-78704 - Provider product page

- Provider
- Invitrogen Antibodies
- Product name
- ABHD5 Polyclonal Antibody
- Antibody type
- Polyclonal
- Antigen
- Recombinant full-length protein
- Description
- Reconstitute with 0.2 mL of distilled water to yield a concentration of 500 µg/mL. Positive Control - WB: rat kidney tissue, A431 whole cell. IHC: human intestinal cancer tissue. ICC/IF: A431 cell.
- Reactivity
- Human, Mouse, Rat
- Host
- Rabbit
- Isotype
- IgG
- Vial size
- 100 μg
- Concentration
- 500 μg/mL
- Storage
- -20°C
Submitted references Cancer-derived exosomal TRIM59 regulates macrophage NLRP3 inflammasome activation to promote lung cancer progression.
Liang M, Chen X, Wang L, Qin L, Wang H, Sun Z, Zhao W, Geng B
Journal of experimental & clinical cancer research : CR 2020 Aug 31;39(1):176
Journal of experimental & clinical cancer research : CR 2020 Aug 31;39(1):176
No comments: Submit comment
Supportive validation
- Submitted by
- Invitrogen Antibodies (provider)
- Main image

- Experimental details
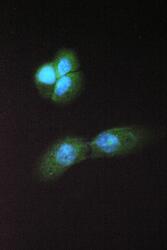
- Immunocytochemistry analysis of Abhd5 using anti-Abhd5 antibody (Product # PA5-78704) . Abhd5 was detected in a section of A431 cells. Enzyme antigen retrieval was performed using IHC enzyme antigen retrieval reagent for 15 mins. The cells were blocked with 10% goat serum and then incubated with 2μg/mL rabbit anti-Abhd5 antibody (Product # PA5-78704) overnight at 4°C. DyLight®488 Conjugated Goat Anti-Rabbit IgG was used as secondary antibody at 1:100 dilution and incubated for 30 minutes at 37°C. The section was counterstained with DAPI. Visualize using a fluorescence microscope and filter sets appropriate for the label used.

- Submitted by
- Invitrogen Antibodies (provider)
- Main image

- Experimental details
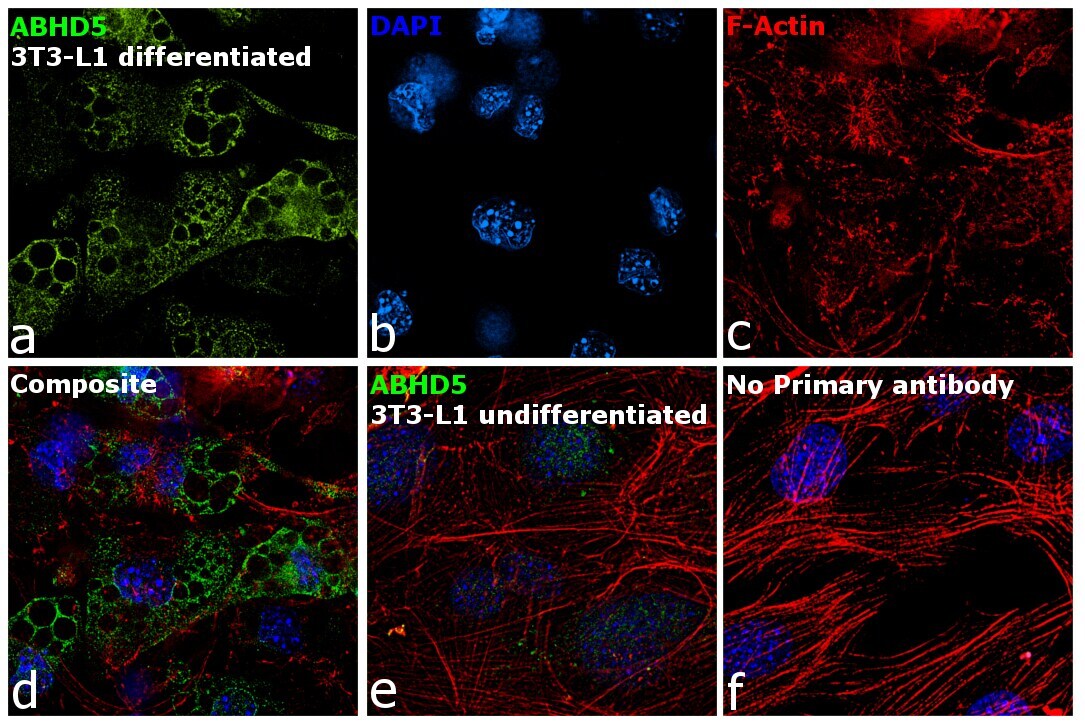
- Immunofluorescence analysis of ABHD5 was performed using 70% confluent log phase 3T3-L1 cells differentiated to adipocytes. The cells were fixed with 4% paraformaldehyde for 10 minutes, permeabilized with 0.1% Triton™ X-100 for 15 minutes, and blocked with 1% BSA for 1 hour at room temperature. The cells were labeled with ABHD5 Polyclonal Antibody (Product # PA5-78704) at 1:100 dilution in 0.1% BSA, incubated at 4 degree Celsius overnight and then labeled with Goat anti-Rabbit IgG (H+L) Superclonal™ Secondary Antibody, Alexa Fluor® 488 conjugate (Product # A27034) at a dilution of 1:2000 for 45 minutes at room temperature (Panel a: green). Nuclei (Panel b: blue) were stained with SlowFade® Gold Antifade Mountant with DAPI (Product # S36938). F-actin (Panel c: red) was stained with Rhodamine Phalloidin (Product # R415, 1:300). Panel d represents the merged image showing increased ABHD5 expression along with localization to surface of fat globules as well as cytoplasm. Panel e shows untreated cells with lower expression of ABHD5. Panel f represents control cells with no primary antibody to assess background. The images were captured at 60X magnification.
- Submitted by
- Invitrogen Antibodies (provider)
- Main image

- Experimental details
- Immunofluorescence analysis of ABHD5 was performed using 70% confluent log phase 3T3-L1 cells differentiated to adipocytes. The cells were fixed with 4% paraformaldehyde for 10 minutes, permeabilized with 0.1% Triton™ X-100 for 15 minutes, and blocked with 1% BSA for 1 hour at room temperature. The cells were labeled with ABHD5 Polyclonal Antibody (Product # PA5-78704) at 1:100 dilution in 0.1% BSA, incubated at 4 degree Celsius overnight and then labeled with Goat anti-Rabbit IgG (Heavy Chain) Superclonal™ Secondary Antibody, Alexa Fluor® 488 conjugate (Product # A27034) at a dilution of 1:2000 for 45 minutes at room temperature (Panel a: green). Nuclei (Panel b: blue) were stained with SlowFade® Gold Antifade Mountant with DAPI (Product # S36938). F-actin (Panel c: red) was stained with Rhodamine Phalloidin (Product # R415, 1:300). Panel d represents the merged image showing increased ABHD5 expression along with localization to surface of fat globules as well as cytoplasm. Panel e shows untreated cells with lower expression of ABHD5. Panel f represents control cells with no primary antibody to assess background. The images were captured at 60X magnification.

- Submitted by
- Invitrogen Antibodies (provider)
- Main image
- Experimental details
- Immunocytochemistry analysis of Abhd5 using anti-Abhd5 antibody (Product # PA5-78704) . Abhd5 was detected in a section of A431 cells. Enzyme antigen retrieval was performed using IHC enzyme antigen retrieval reagent for 15 mins. The cells were blocked with 10% goat serum and then incubated with 2μg/mL rabbit anti-Abhd5 antibody (Product # PA5-78704) overnight at 4°C. DyLight®488 Conjugated Goat Anti-Rabbit IgG was used as secondary antibody at 1:100 dilution and incubated for 30 minutes at 37°C. The section was counterstained with DAPI. Visualize using a fluorescence microscope and filter sets appropriate for the label used.

Supportive validation
- Submitted by
- Invitrogen Antibodies (provider)
- Main image
- Experimental details
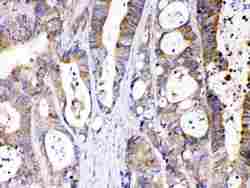
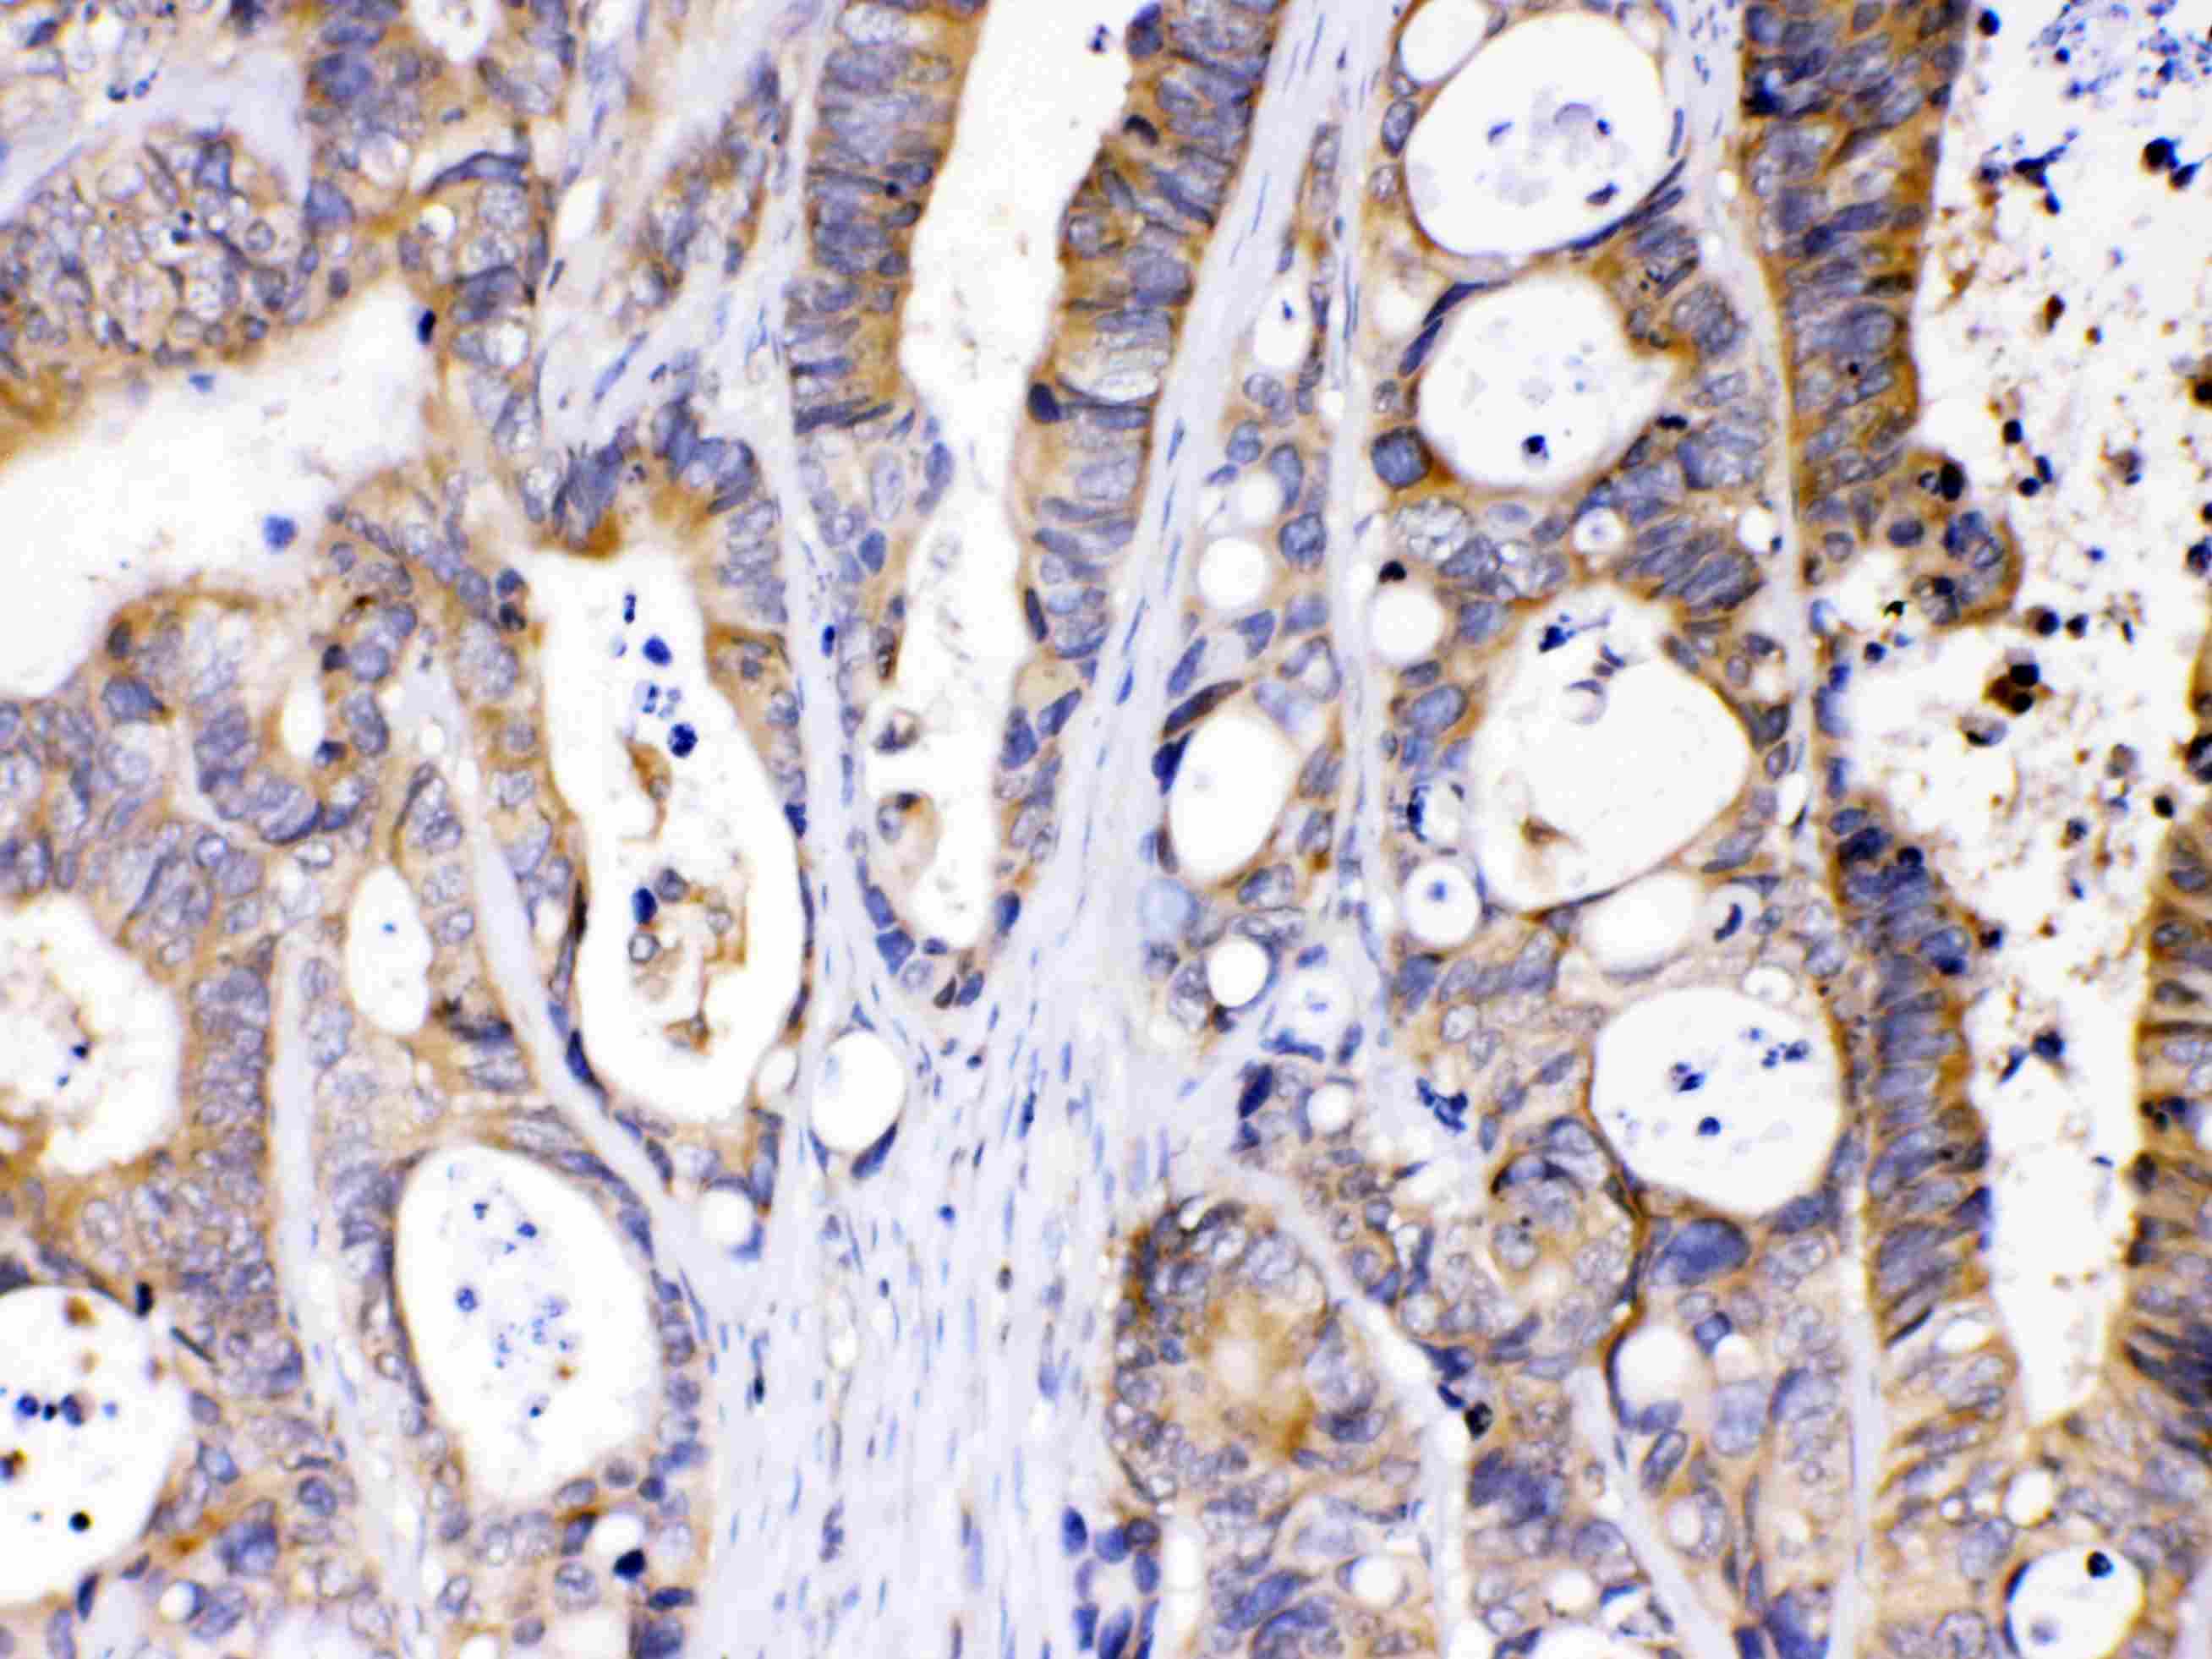
- Immunohistochemistry analysis of ABHD5 on paraffin-embedded human intestinal cancer tissue. Sample was incubated with ABHD5 polyclonal antibody (Product# PA5-78704) with a dilution of 1 µg/mL, and developed by Streptavidin-Biotin-Complex (SABC) with DAB chromogen method.
Supportive validation
- Submitted by
- Invitrogen Antibodies (provider)
- Main image
- Experimental details
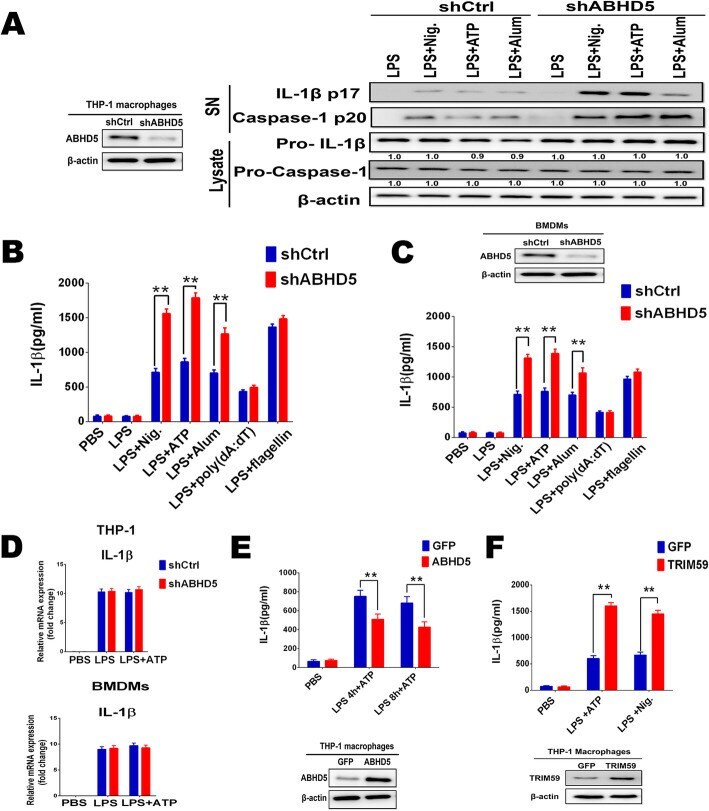
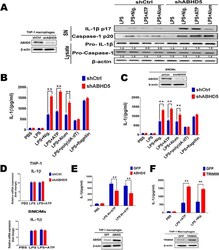
- Fig. 4 ABHD5 deficiency promotes NLRP3 inflammasome activation in macrophages. a . Western blot analysis of ABHD5 expression in macrophages transfected with scrambled control shRNA or ABHD5 shRNA for 36 h. Immunoblot of the IL-1beta, the pro-caspase-1 and cleaved caspase-1 in the supernatants (SNs) or cell lysates of ABHD5-silenced THP-1 macrophages, primed with LPS, and then stimulated with Nigericin (Nig. ), ATP or Alum. beta-actin served as a loading control. Quantification of Western blotting were performed with the Image J software. Numbers below each blot indicate relative band intensity normalized to beta-actin. b . ELISA of IL-1beta in supernatants from THP-1 macrophages silenced of ABHD5, primed with LPS for 8 h, and followed by stimulation with ATP, Nig., Alum, poly(dA:dT) or flagellin for 30 min. c . ELISA of IL-1beta in supernatants from BMDMs silenced of ABHD5, primed with LPS for 8 h, and followed by stimulation with ATP, Nig., Alum, poly(dA:dT) or flagellin for 30 min. d . RT-PCR analysis of IL-1beta mRNA expression in macrophages transfected with shRNA as indicated and stimulated as indicated. e. ELISA of IL-1beta in supernatants from THP-1 cells infected with lentiviral vectors expressing ABHD5 or GFP control, primed with LPS for various times, and followed by stimulation with ATP for 30 min. f . ELISA of IL-1beta in supernatants from THP-1 cells infected with lentiviral vectors expressing TRIM59 or GFP control, primed with LPS, and followed by stimulation wi