Explore
 Validate
 Learn
Learn Western blot
 ELISA
ELISA Immunocytochemistry
Antibody data
- Antibody Data
- Antigen structure
- References [1]
- Comments [0]
- Validations
- Immunocytochemistry [7]
- Other assay [2]
Submit
Validation data
Reference
Comment
Report error
- Product number
- PA5-90788 - Provider product page

- Provider
- Invitrogen Antibodies
- Product name
- ATL2 Polyclonal Antibody
- Antibody type
- Polyclonal
- Antigen
- Recombinant protein fragment
- Description
- Immunogen sequence: ARDTYCKSME QVCGGDKPYI APSDLERKHL DLKEVAIKQF RSVKKMGGDE FCRRYQDQLE AEIEETYANF IKHNDGKNIF Y; Positive Samples: U-87MG, HT-29, Jurkat, HeLa; Cellular Location: Endoplasmic reticulum membrane, Multi-pass membrane protein
- Reactivity
- Human, Mouse, Rat
- Host
- Rabbit
- Isotype
- IgG
- Vial size
- 100 μL
- Concentration
- 0.82 mg/mL
- Storage
- -20°C, Avoid Freeze/Thaw Cycles
Submitted references Alzheimer's disease-causing presenilin-1 mutations have deleterious effects on mitochondrial function.
Han J, Park H, Maharana C, Gwon AR, Park J, Baek SH, Bae HG, Cho Y, Kim HK, Sul JH, Lee J, Kim E, Kim J, Cho Y, Park S, Palomera LF, Arumugam TV, Mattson MP, Jo DG
Theranostics 2021;11(18):8855-8873
Theranostics 2021;11(18):8855-8873
No comments: Submit comment
Supportive validation
- Submitted by
- Invitrogen Antibodies (provider)
- Main image
- Experimental details
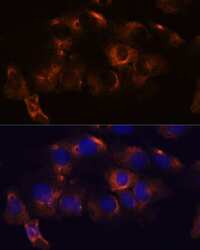
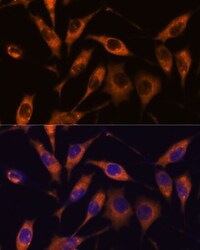
- Immunocytochemistry-Immunofluorescence analysis of ATL2 was performed in C6 cells using ATL2 Polyclonal Antibody (Product # PA5-90788) at a dilution of 1:100. Blue: DAPI for nuclear staining.
- Submitted by
- Invitrogen Antibodies (provider)
- Main image

- Experimental details
- Immunocytochemistry-Immunofluorescence analysis of ATL2 was performed in C6 cells using ATL2 Polyclonal Antibody (Product # PA5-90788) at a dilution of 1:100. Blue: DAPI for nuclear staining.

- Submitted by
- Invitrogen Antibodies (provider)
- Main image
- Experimental details
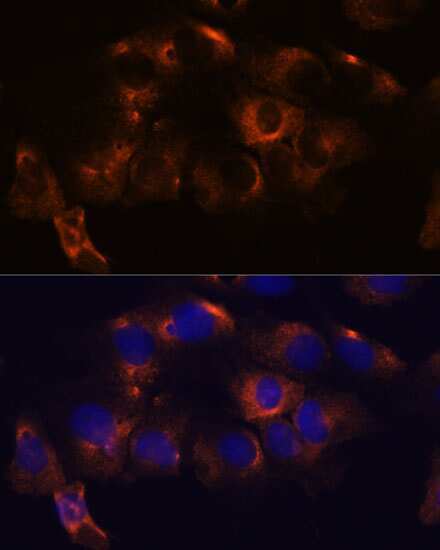
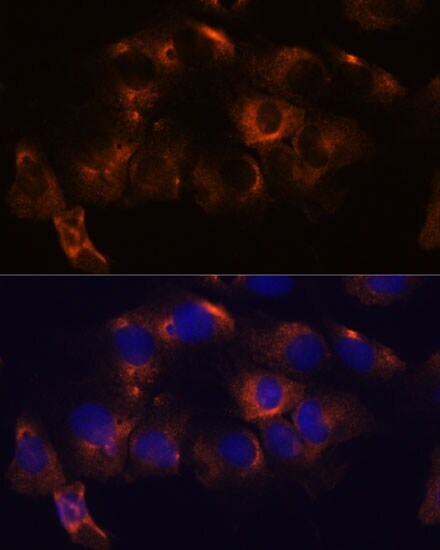
- Immunocytochemistry-Immunofluorescence analysis of ATL2 was performed in HeLa cells using ATL2 Polyclonal Antibody (Product # PA5-90788) at a dilution of 1:100. Blue: DAPI for nuclear staining.

- Submitted by
- Invitrogen Antibodies (provider)
- Main image
- Experimental details
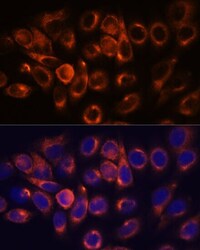
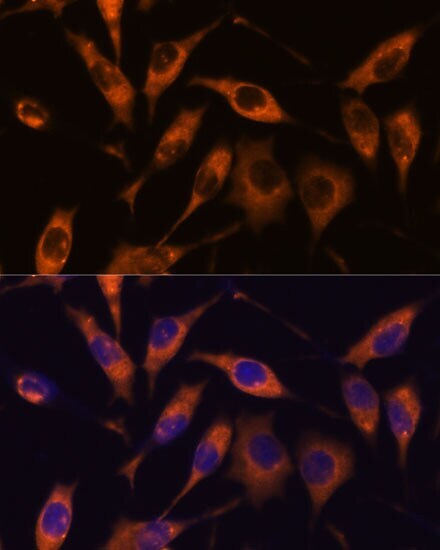
- Immunocytochemistry-Immunofluorescence analysis of ATL2 was performed in L929 cells using ATL2 Polyclonal Antibody (Product # PA5-90788) at a dilution of 1:100. Blue: DAPI for nuclear staining.
- Submitted by
- Invitrogen Antibodies (provider)
- Main image

- Experimental details
- Immunofluorescence analysis of ATL2 in C6 cells. Samples were incubated with ATL2 Polyclonal antibody (Product # PA5-90788) using a dilution of 1:100. Blue: DAPI for nuclear staining.
- Submitted by
- Invitrogen Antibodies (provider)
- Main image

- Experimental details
- Immunofluorescence analysis of ATL2 in HeLa cells. Samples were incubated with ATL2 Polyclonal antibody (Product # PA5-90788) using a dilution of 1:100. Blue: DAPI for nuclear staining.

- Submitted by
- Invitrogen Antibodies (provider)
- Main image

- Experimental details
- Immunofluorescence analysis of ATL2 in L929 cells. Samples were incubated with ATL2 Polyclonal antibody (Product # PA5-90788) using a dilution of 1:100. Blue: DAPI for nuclear staining.

Supportive validation
- Submitted by
- Invitrogen Antibodies (provider)
- Main image
- Experimental details
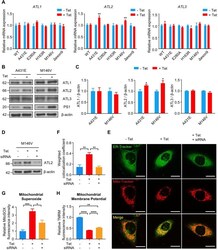
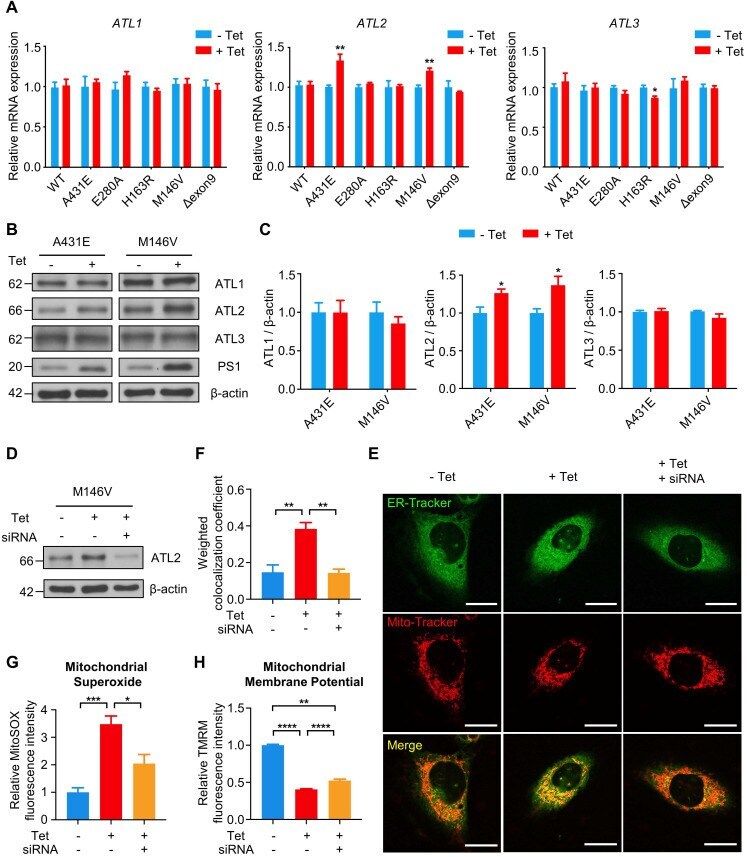
- Figure 6 Knockdown of ATL2 after PS1 mutant induction rescues abnormally elevated ER-mitochondria colocalization back to normal level in the H4 PS1M146V cell line. (A) mRNA expression levels of ATL1 , ATL2 , and ATL3 in H4 PS1 cell lines before and after tetracycline (100 ng/ml) treatment. (B) Representative western blots of ATL1, ATL2, and ATL3 in H4 PS1A431E and H4 PS1M146V cell lines before and after tetracycline (100 ng/ml) treatment. (C) Quantification of ATL1, ATL2, and ATL3 expressions in (B). n = 3; * P < 0.05; Student's t -test (two-tailed). (D) A representative western blot of ATL2 in H4 PS1M146V cell line before and after tetracycline (100 ng/ml) treatment or siRNA (40 nM) transfection. (E) Representative confocal images of Mito-Tracker (red) and ER-Tracker (green) labeled H4 PS1M146V cell line before and after tetracycline (100 ng/ml) treatment or siRNA (40 nM) transfection. Scale bar, 20 um. (F) The weighted colocalization coefficient between mitochondria and ER. For each independent imaging experiment, 10-15 cells were analyzed. n = 3; ** P < 0.01; One-way ANOVA with Tukey post-hoc test. (G) Quantification of mitochondrial superoxide production in H4 PS1M146V cell line before and after tetracycline (100 ng/ml) treatment or siRNA (40 nM) transfection. n = 4; * P < 0.05 , *** P < 0.001; One-way ANOVA with Tukey post-hoc test. (H) Quantification of mitochondrial membrane potential in H4 PS1M146V cell line before and after tetracycline (100 ng/ml) treatment or siRNA
- Submitted by
- Invitrogen Antibodies (provider)
- Main image
- Experimental details
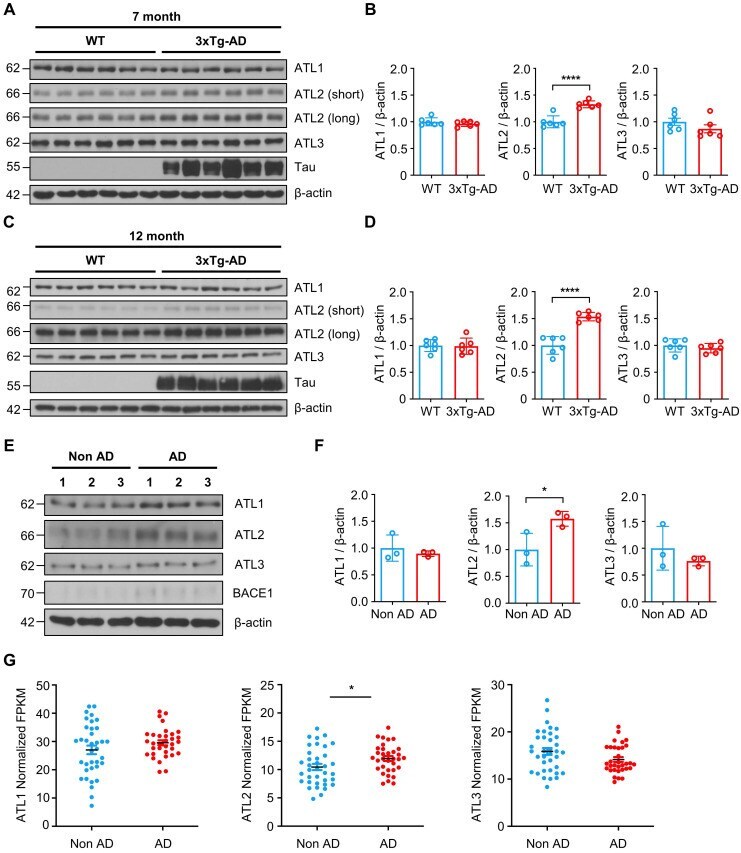
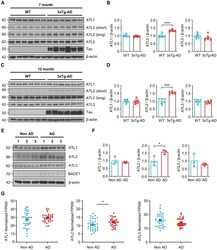
- Figure 7 ATL2 expression level is elevated in the brains of AD mouse model and AD patients. (A) Representative western blots of ATL1, ATL2, ATL3, and Tau in the hippocampi of seven-month-old 3xTg-AD mice (male, n = 2; female, n = 4) and age-matched wild-type (male, n = 2; female, n = 4). (B) Quantification of ATL1, ATL2, and ATL3 expressions in (A); **** P < 0.0001; Student's t -test (two-tailed). (C) Representative western blots of ATL1, ATL2, ATL3, and Tau in the hippocampi of twelve-month-old 3xTg-AD mice (male, n = 2; female, n = 4) and age-matched wild-type (male, n = 2; female, n = 4). (D) Quantification of ATL1, ATL2, and ATL3 expressions in (C); **** P < 0.0001; Student's t -test (two-tailed). (E) Representative western blots of ATL1, ATL2, ATL3, and BACE1 in the inferior parietal lobule of AD patients (n = 3) and age-matched control subjects (n = 3). (F) Quantification of ATL1, ATL2, and ATL3 expressions in (C); * P < 0.05; Student's t -test (two-tailed). (G) Expression levels of ATL1 , ATL2 , and ATL3 in the frontal white matter of subjects with (red, n = 33) and without (blue, n = 36) AD; * P < 0.05; Student's t -test (two-tailed). The values shown indicate the means +- SEM.