Explore
 Validate
 Learn
Learn Western blot
 Immunocytochemistry
Antibody data
- Antibody Data
- Antigen structure
- References [4]
- Comments [0]
- Validations
- Immunocytochemistry [1]
- Immunohistochemistry [4]
- Other assay [13]
Submit
Validation data
Reference
Comment
Report error
- Product number
- PA5-20330 - Provider product page

- Provider
- Invitrogen Antibodies
- Product name
- Nephrin Polyclonal Antibody
- Antibody type
- Polyclonal
- Antigen
- Synthetic peptide
- Description
- Despite its predicted molecular weight, Nephrin often migrates at a lower molecular weight in SDS-PAGE. A suggested positive control is mouse kidney tissue lysate. PA5-20330 can be used with blocking peptide PEP-0450.
- Reactivity
- Human, Mouse, Rat
- Host
- Rabbit
- Isotype
- IgG
- Vial size
- 100 μg
- Concentration
- 1 mg/mL
- Storage
- 4°C
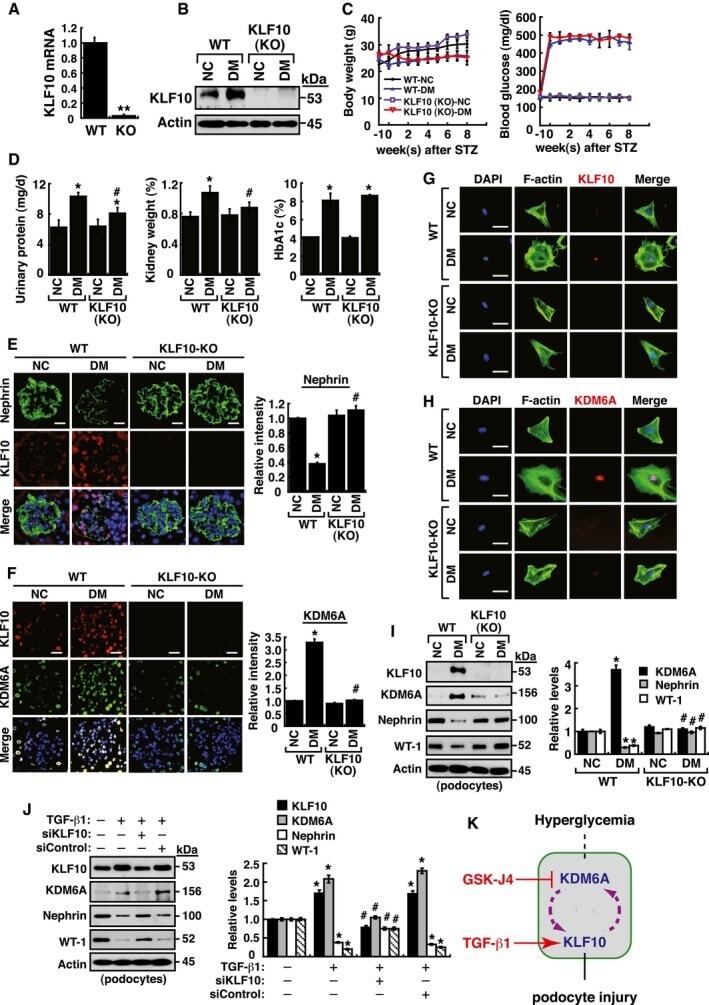
Submitted references A KDM6A-KLF10 reinforcing feedback mechanism aggravates diabetic podocyte dysfunction.
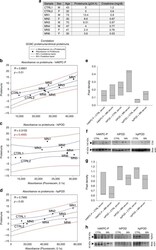
A glomerulus-on-a-chip to recapitulate the human glomerular filtration barrier.
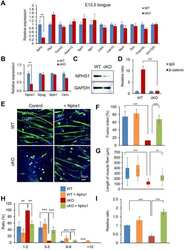
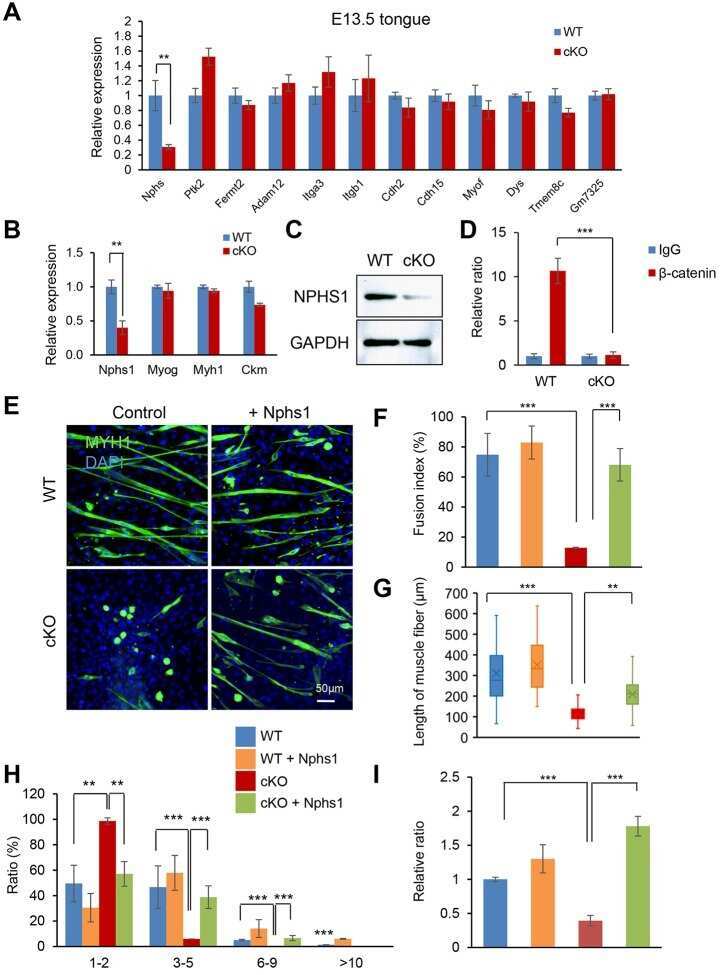
WNT/β-catenin signaling plays a crucial role in myoblast fusion through regulation of nephrin expression during development.
Podocyte injury elicits loss and recovery of cellular forces.
Lin CL, Hsu YC, Huang YT, Shih YH, Wang CJ, Chiang WC, Chang PJ
EMBO molecular medicine 2019 May;11(5)
EMBO molecular medicine 2019 May;11(5)
A glomerulus-on-a-chip to recapitulate the human glomerular filtration barrier.
Petrosyan A, Cravedi P, Villani V, Angeletti A, Manrique J, Renieri A, De Filippo RE, Perin L, Da Sacco S
Nature communications 2019 Aug 13;10(1):3656
Nature communications 2019 Aug 13;10(1):3656
WNT/β-catenin signaling plays a crucial role in myoblast fusion through regulation of nephrin expression during development.
Suzuki A, Minamide R, Iwata J
Development (Cambridge, England) 2018 Nov 27;145(23)
Development (Cambridge, England) 2018 Nov 27;145(23)
Podocyte injury elicits loss and recovery of cellular forces.
Haley KE, Kronenberg NM, Liehm P, Elshani M, Bell C, Harrison DJ, Gather MC, Reynolds PA
Science advances 2018 Jun;4(6):eaap8030
Science advances 2018 Jun;4(6):eaap8030
No comments: Submit comment
Supportive validation
- Submitted by
- Invitrogen Antibodies (provider)
- Main image
- Experimental details
- Immunofluorescent analysis of mouse kidney cells using a Nephrin polyclonal antibody (Product # PA5-20330) at a 10 µg/mL dilution.
Supportive validation
- Submitted by
- Invitrogen Antibodies (provider)
- Main image
- Experimental details
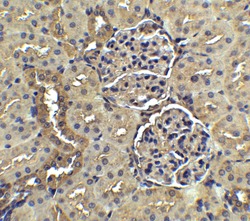
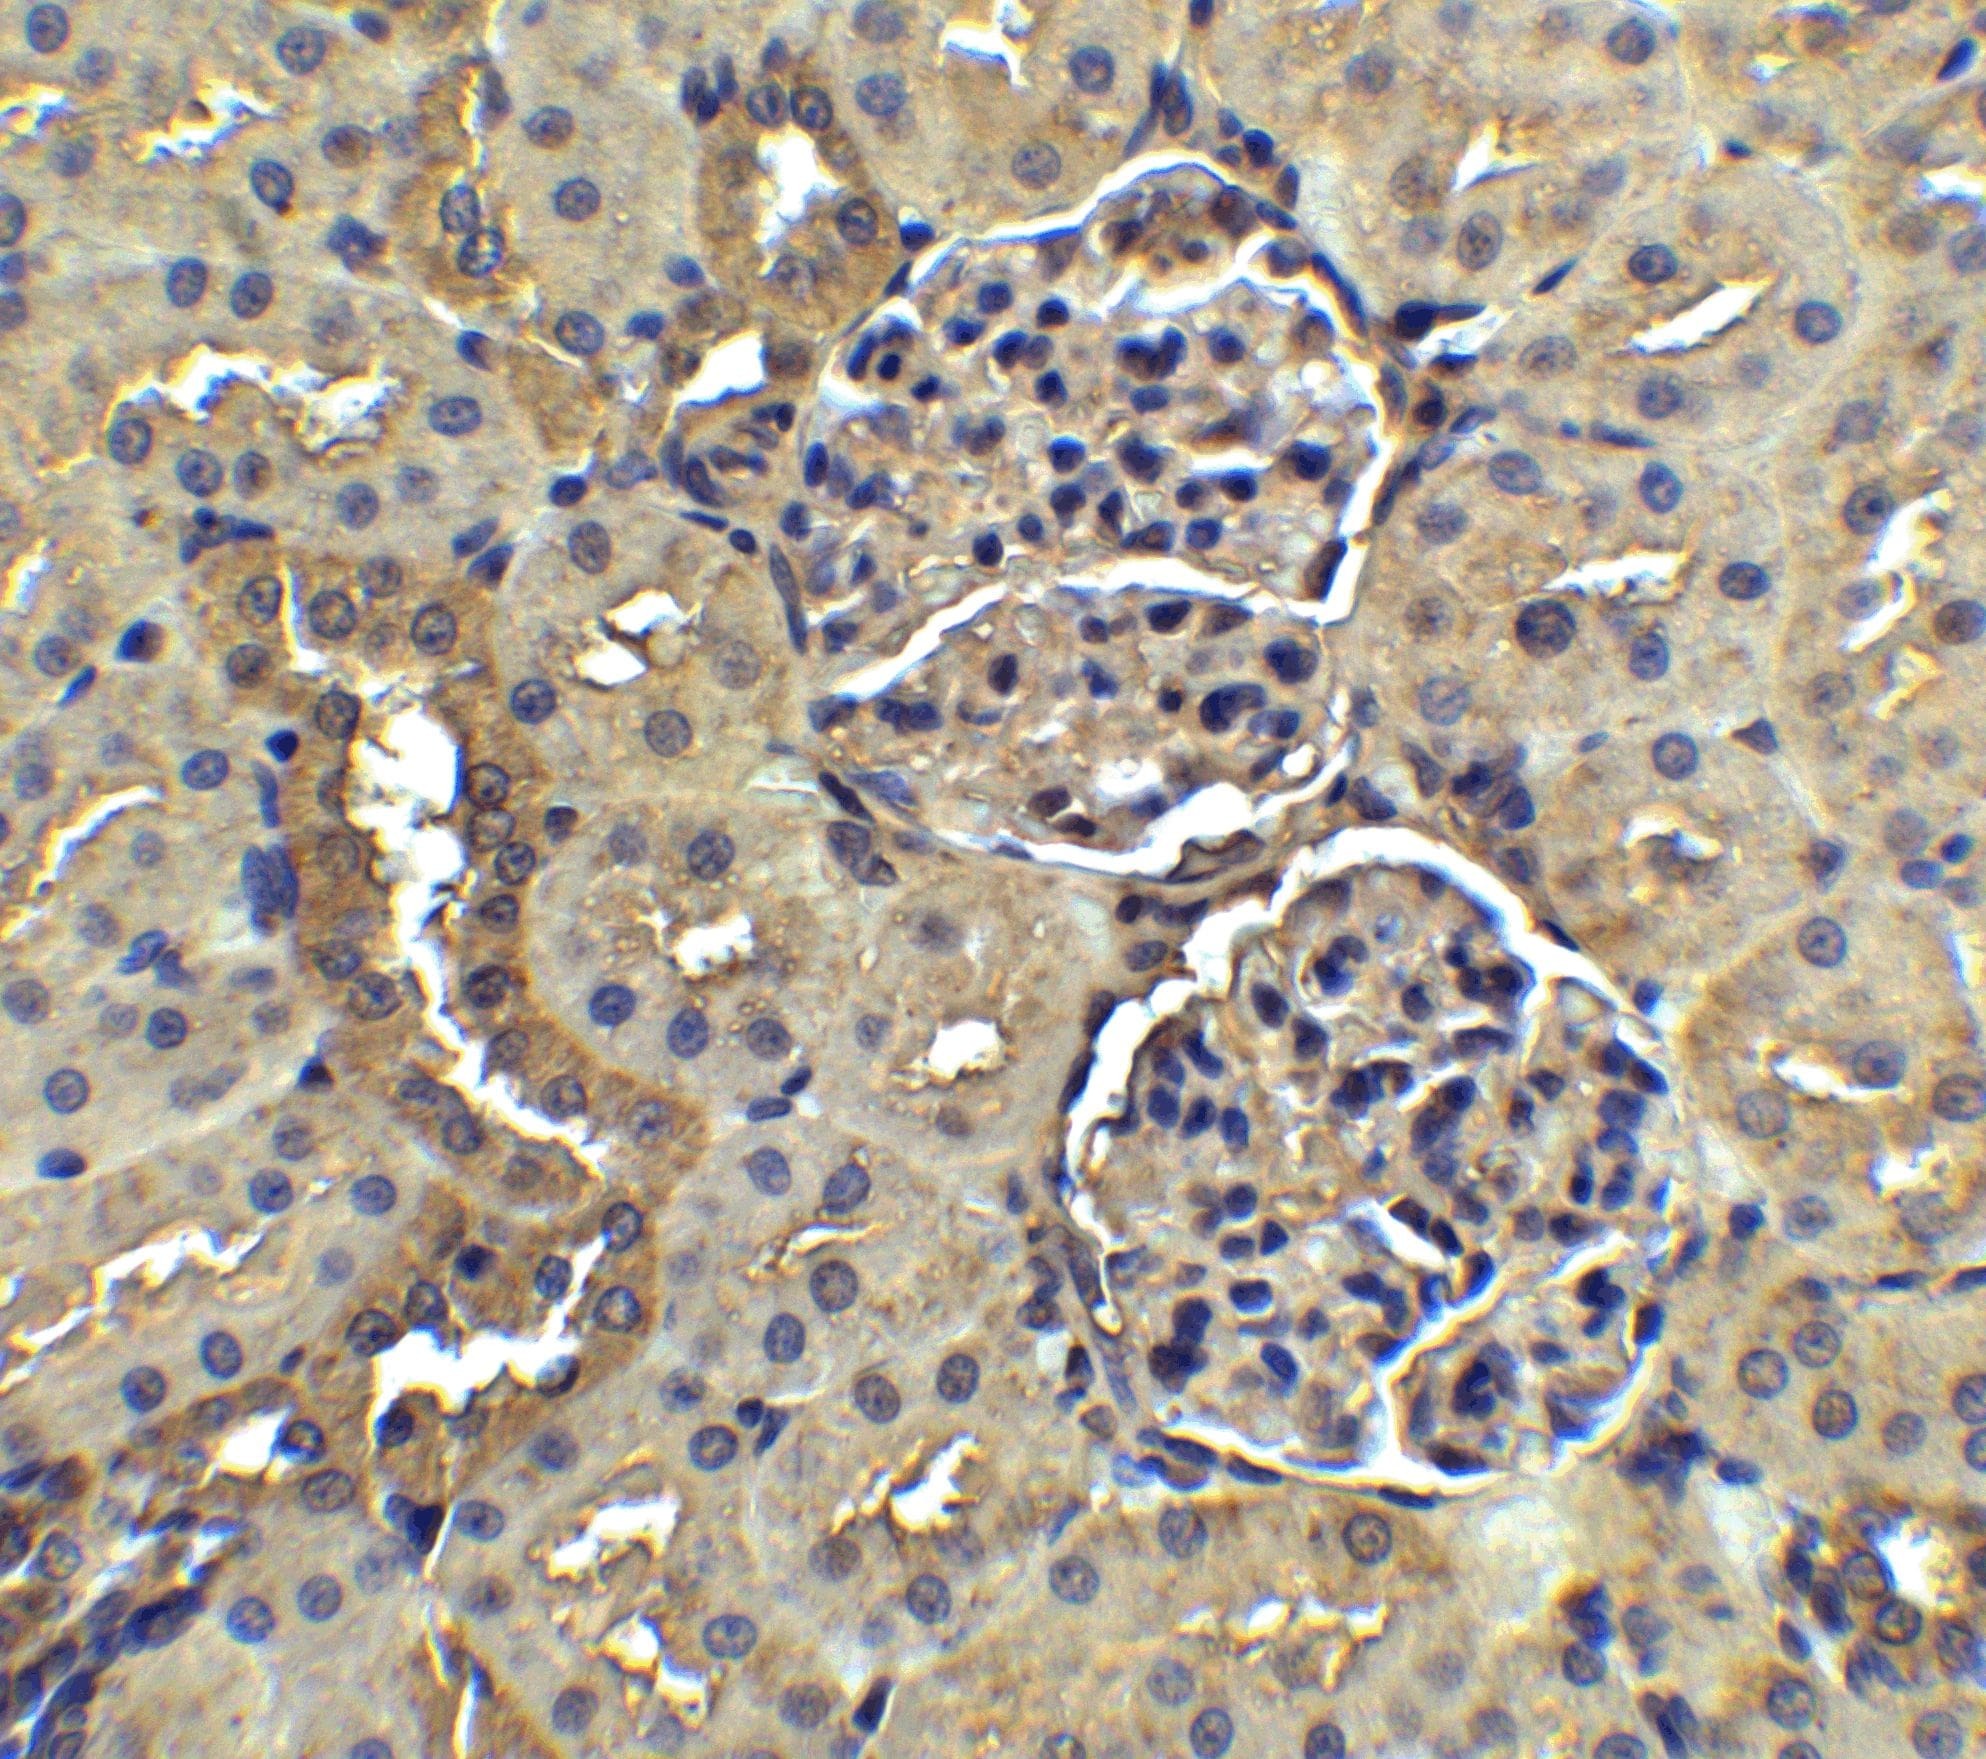
- Immunohistochemical analysis of paraffin-embedded rat kidney tissue using Nephrin Polyclonal Antibody (Product # PA5-20330) at 5 µg/mL. Tissue was fixed with formaldehyde and blocked with 0.1 serum for 1 h at RT; antigen retrieval was by heat mediation with a citrate buffer (pH6). Samples were incubated with primary antibody overnight at 4˚C. A goat anti-rabbit IgG H&L (HRP) at 1/250 was used as secondary. Counter stained with Hematoxylin.
- Submitted by
- Invitrogen Antibodies (provider)
- Main image
- Experimental details
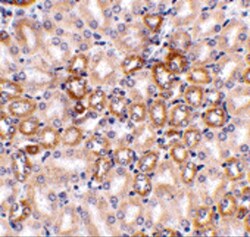
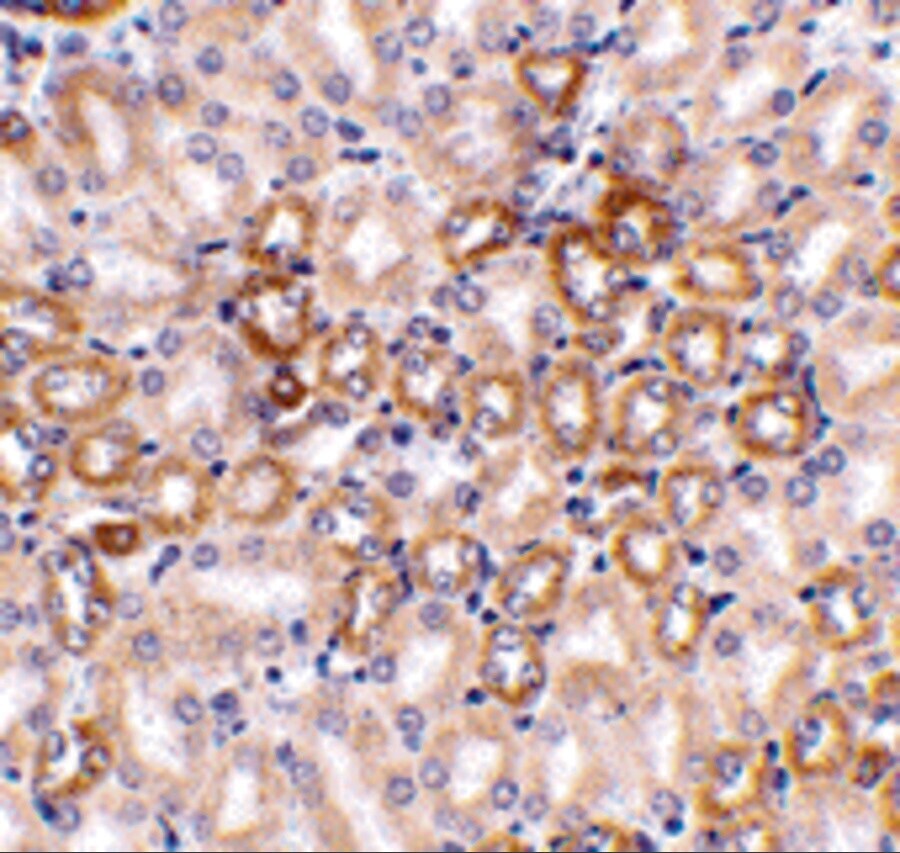
- Immunohistochemical analysis of paraffin-embedded mouse kidney tissue using Nephrin Polyclonal Antibody (Product # PA5-20330) at 1 µg/mL. Tissue was fixed with formaldehyde and blocked with 0.1 serum for 1 h at RT; antigen retrieval was by heat mediation with a citrate buffer (pH6). Samples were incubated with primary antibody overnight at 4˚C. A goat anti-rabbit IgG H&L (HRP) at 1/250 was used as secondary. Counter stained with Hematoxylin.
- Submitted by
- Invitrogen Antibodies (provider)
- Main image

- Experimental details
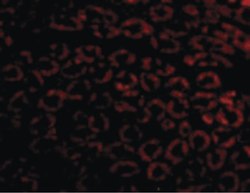
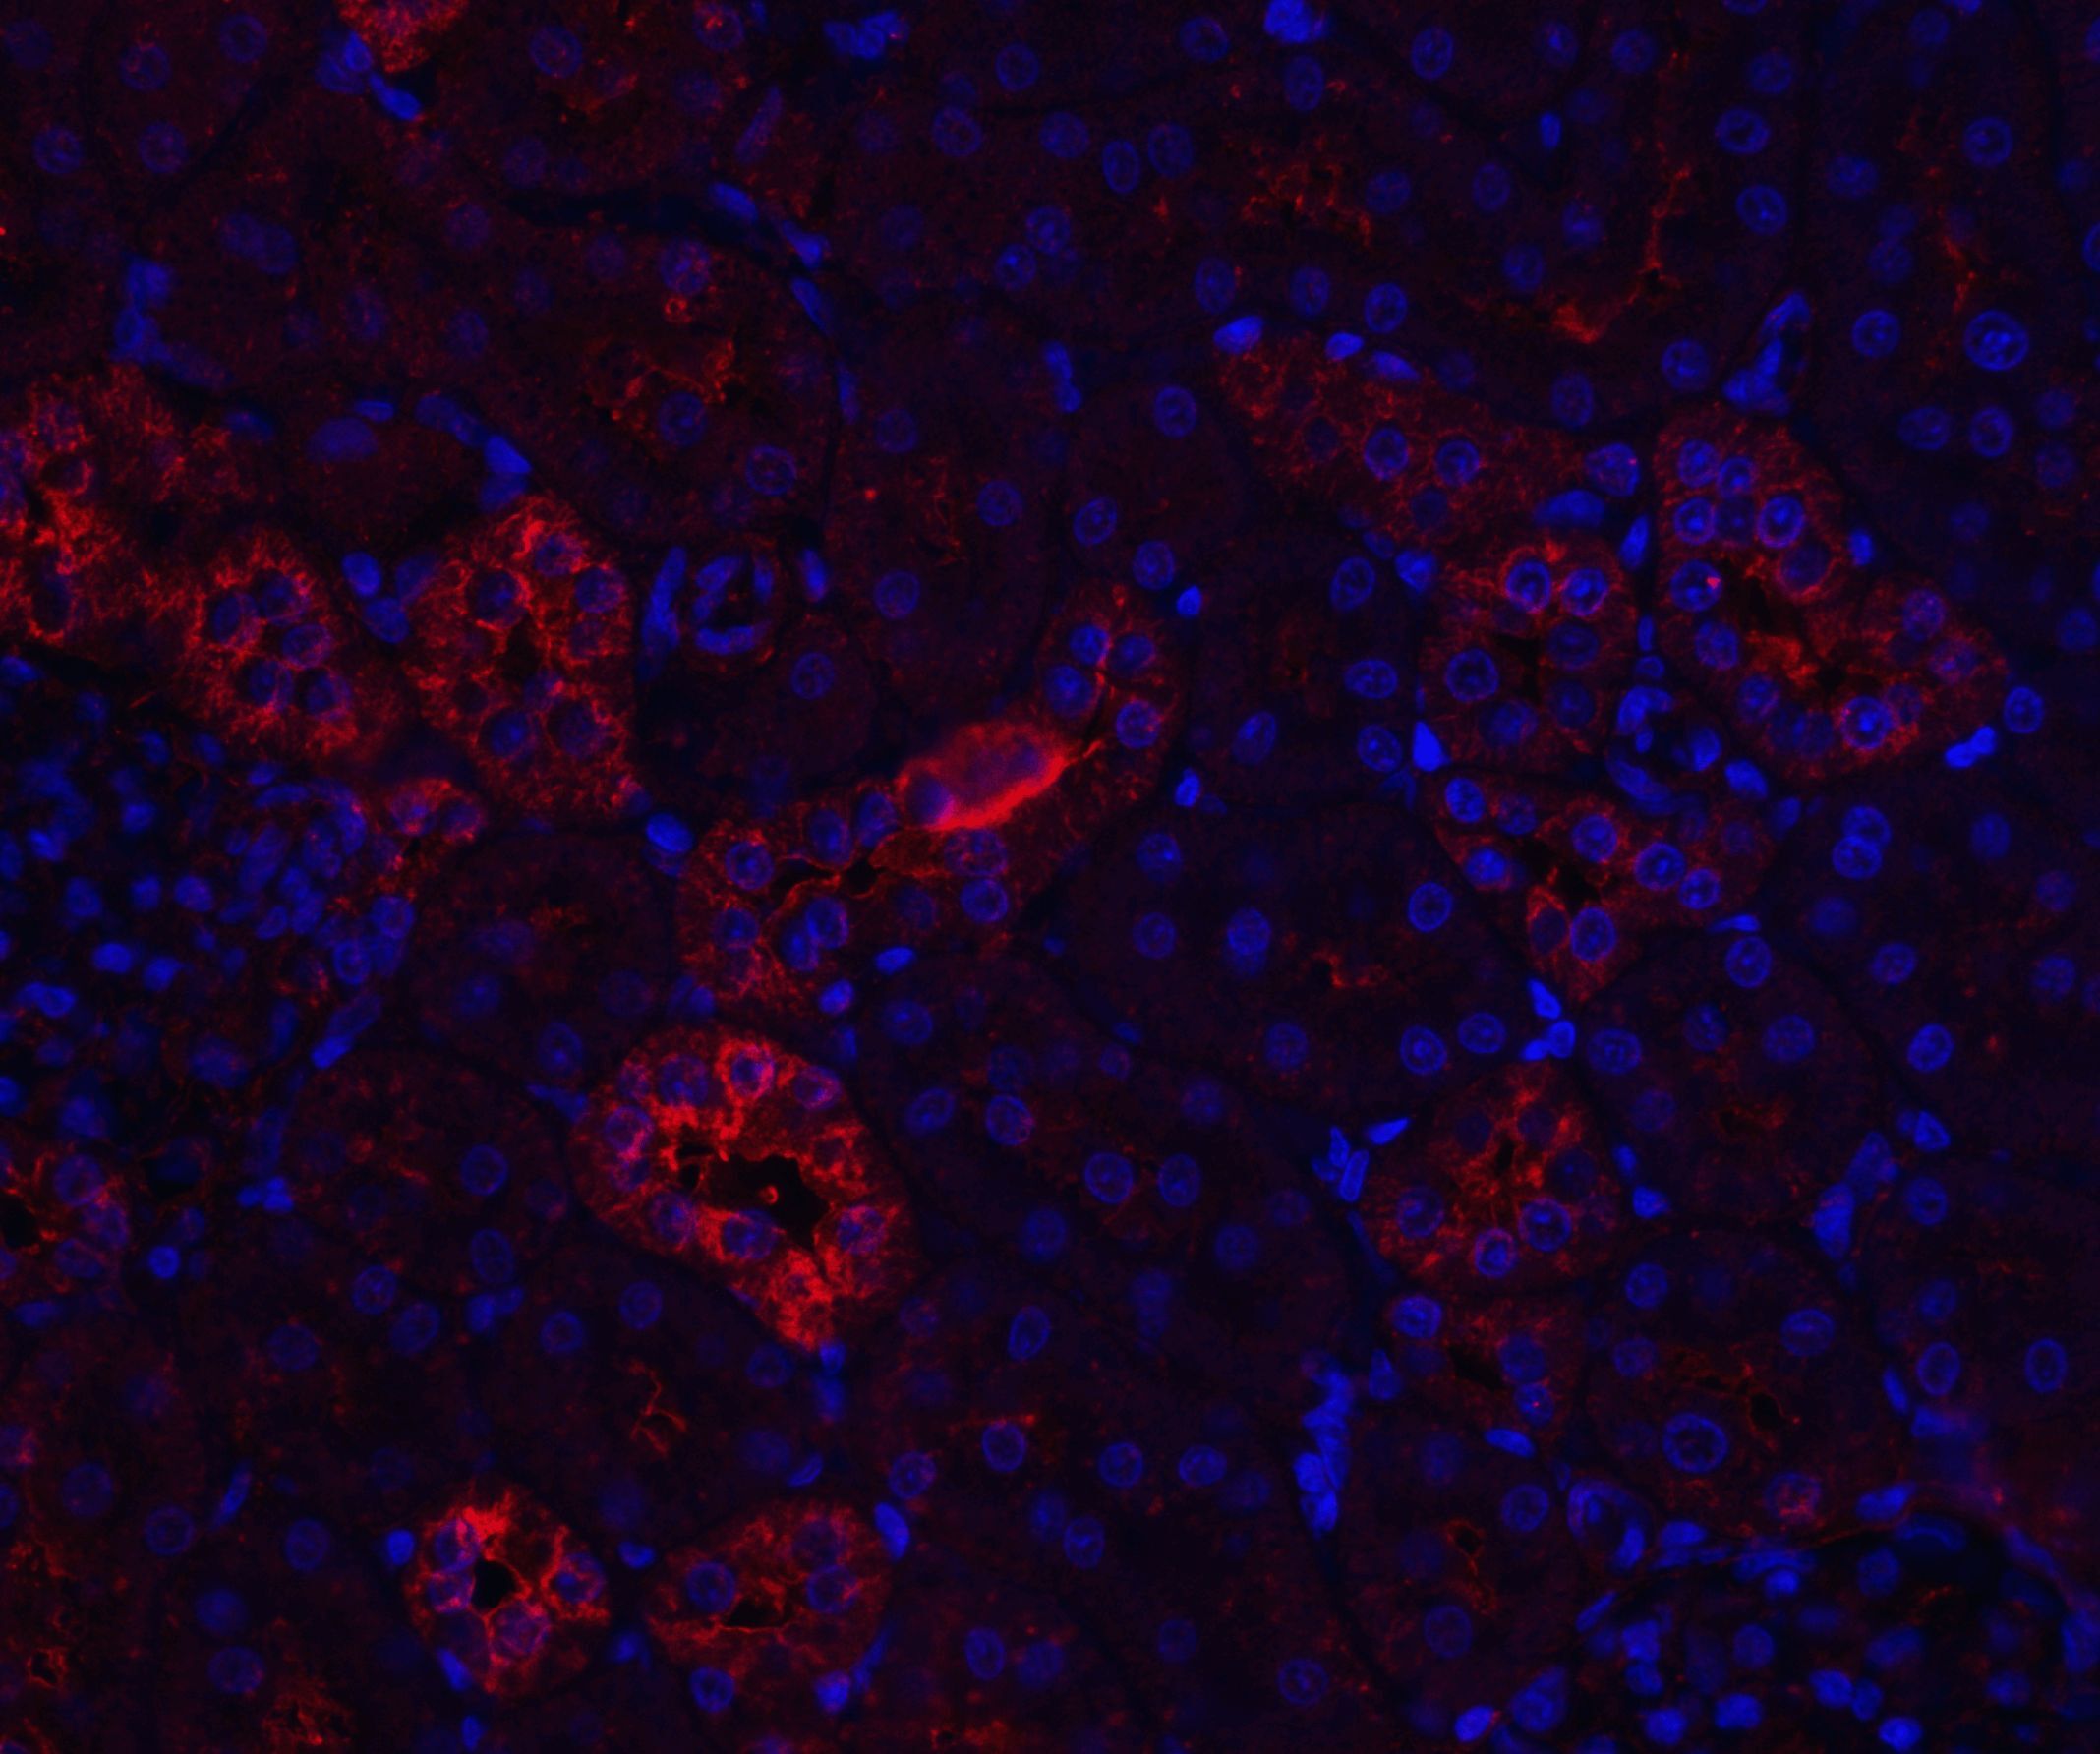
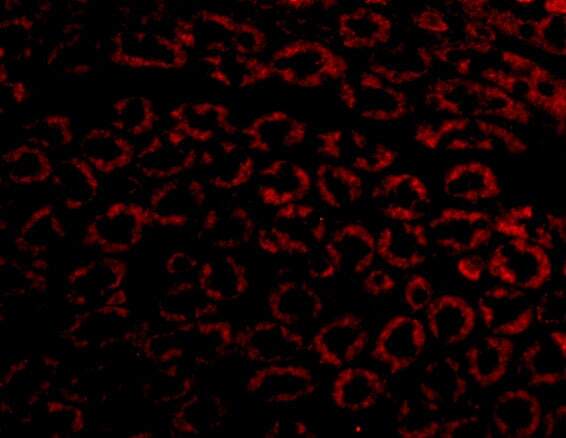
- Immunofluorescent analysis of 4% paraformaldehyde-fixed rat kidney tissue labeling Nephrin with Nephrin Polyclonal Antibody (Product # PA5-20330) at 20 µg/mL, followed by goat anti-rabbit IgG secondary antibody at 1:500 dilution (red) and DAPI staining (blue).
- Submitted by
- Invitrogen Antibodies (provider)
- Main image

- Experimental details
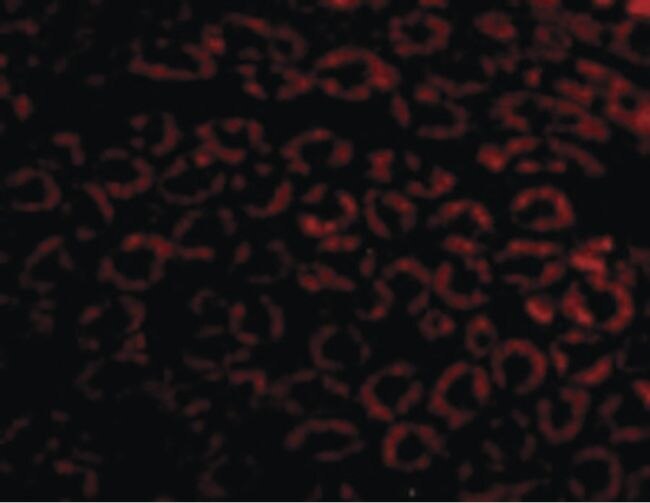
- Immunofluorescent analysis of 4% paraformaldehyde-fixed mouse kidney cells labeling Nephrin with Nephrin Polyclonal Antibody (Product # PA5-20330) at 10 µg/mL, followed by goat anti-rabbit IgG secondary antibody at 1:500 dilution (red).
Supportive validation
- Submitted by
- Invitrogen Antibodies (provider)
- Main image
- Experimental details
- NULL
- Submitted by
- Invitrogen Antibodies (provider)
- Main image
- Experimental details
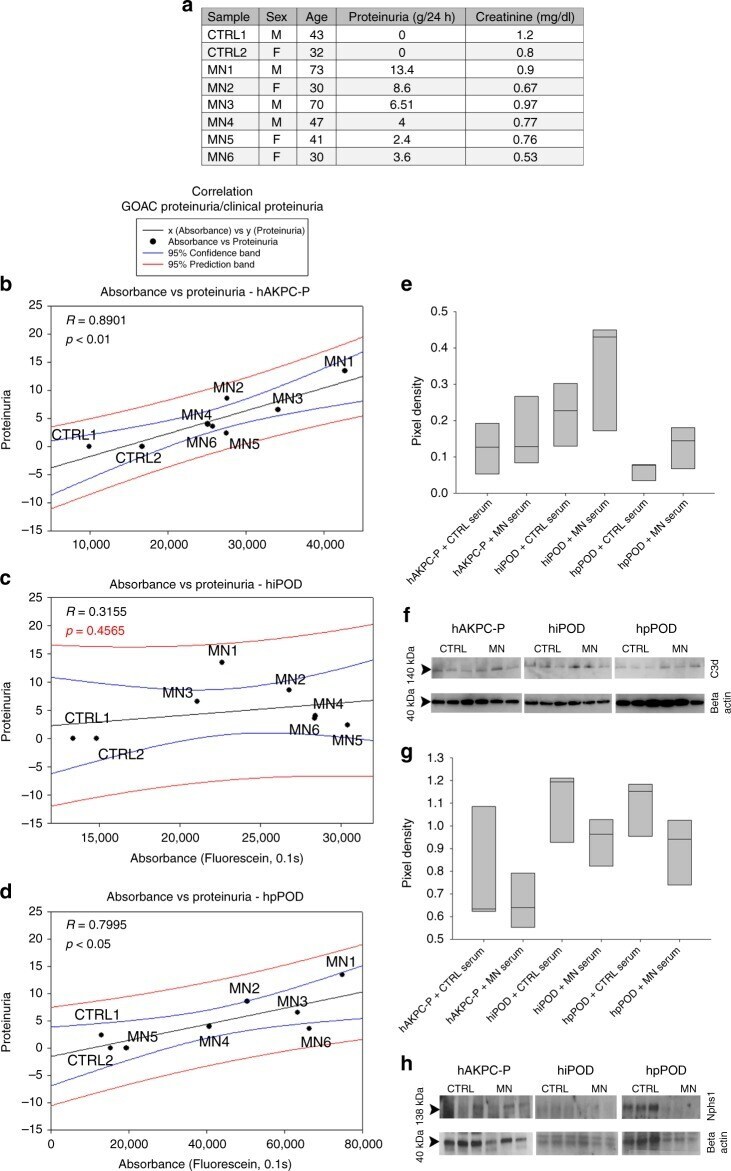
- Fig. 6 Correlation of GOAC proteinuria with clinical data and MN mechanism modeling on the chip. a Table of clinical parameters for proteinuria in MN serum samples used on the GOAC. b hAKPC-P + hGEC chip proteinuria for CTRL1-2 and MN1-6 clinical proteinuria levels suggests a very strong correlation between clinical profile and response in the chip (measured as albumin leakage). R : 0.8901, P < 0.01. c hiPOD + hGEC chip proteinuria for CTRL1-2 and MN1-6 clinical proteinuria levels suggests a weak correlation between clinical profile and response in the chip (measured as albumin leakage). R : 0.3156, not significant. d hpPOD + hGEC chip proteinuria for CTRL1-2 and MN1-6 clinical proteinuria levels suggests a strong correlation between clinical profile and response in the chip (measured as albumin leakage). R : 0.7995, p < 0.05. For all samples, regression analysis was performed. Equation: Polynomial, linear. Blue lines = 95% confidence band; red lines = 95% prediction band. e , f Western blot analysis for C3d (140kDA) and beta actin (40 kDa) in hAKPC-P + hGEC, hiPOD + hGEC, and hpPOD + hGEC chips exposed to healthy or MN serum confirmed increased expression for C3d by all three MN chips. Number of replicates per experimental group: 3 ( f ). Quantification of C3d expression was performed by measuring pixel density and followed by normalization against beta actin. g , h Western blot analysis for NPHS1 (138kDA) and beta actin (40 kDa) in hAKPC-P + hGEC, hiPOD + hGEC, and hpPOD +
- Submitted by
- Invitrogen Antibodies (provider)
- Main image
- Experimental details
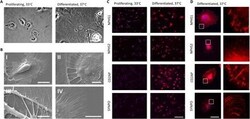
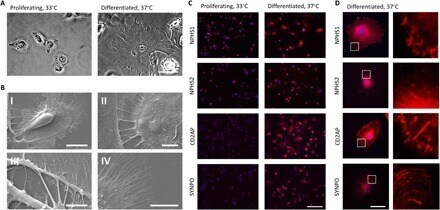
- Fig. 1 Differentiation of LY podocytes. ( A ) Phase-contrast microscopy of proliferating LY human podocytes cultured at 33degC. Differentiation of LY podocytes at 37degC for 12 days results in a transition to differentiated morphology. Differentiated cells increase in size up to lengths of 150 mum and develop finger-like foot processes around the periphery of the cell. Scale bar, 50 mum. ( B ) Scanning electron microscopy reveals ultrastructures of primary and secondary foot processes on differentiated LY podocytes. (I) LY podocyte differentiated at 37degC for 12 days demonstrates primary foot processes around the cell periphery and extending toward adjacent cell. Scale bar, 20 mum. (II) Primary foot processes interdigitating between differentiated LY podocytes. Scale bar, 5 mum. (III) Primary foot processes branching off of a differentiated LY podocyte. Scale bar, 5 mum. (IV) Secondary foot processes around the outer periphery of a differentiated podocyte. Scale bar, 10 mum. ( C ) Localization and expression of podocyte-specific proteins NPHS1, NPHS2, CD2AP, and SYNPO (red) in proliferating and differentiated LY podocytes assessed by immunocytochemistry at low magnification. DAPI (4',6-diamidino-2-phenylindole) (blue) detects nuclei. Scale bar, 200 mum. ( D ) Localization and expression of podocyte-specific proteins NPHS1, NPHS2, CD2AP, and SYNPO (red) in a single differentiated LY podocyte. DAPI (blue) detects nuclei. Scale bar, 50 mum; right panels, magnification of area m
- Submitted by
- Invitrogen Antibodies (provider)
- Main image
- Experimental details
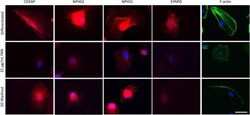
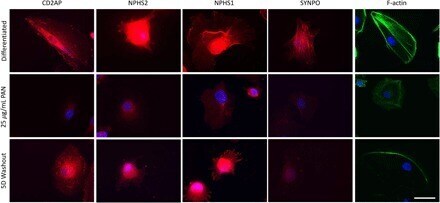
- Fig. 4 Reduced expression of podocyte-specific proteins in a PAN injury model is reversible in vitro. Localization and expression of podocyte-specific proteins NPHS1, NPHS2, CD2AP, and SYNPO (red) and F-actin (green) in differentiated, PAN (25 mug/ml)-treated LY podocytes and 5-day PAN washout of LY podocytes assessed by immunocytochemistry. DAPI (blue) detects nuclei. Scale bar, 50 mum.
- Submitted by
- Invitrogen Antibodies (provider)
- Main image

- Experimental details
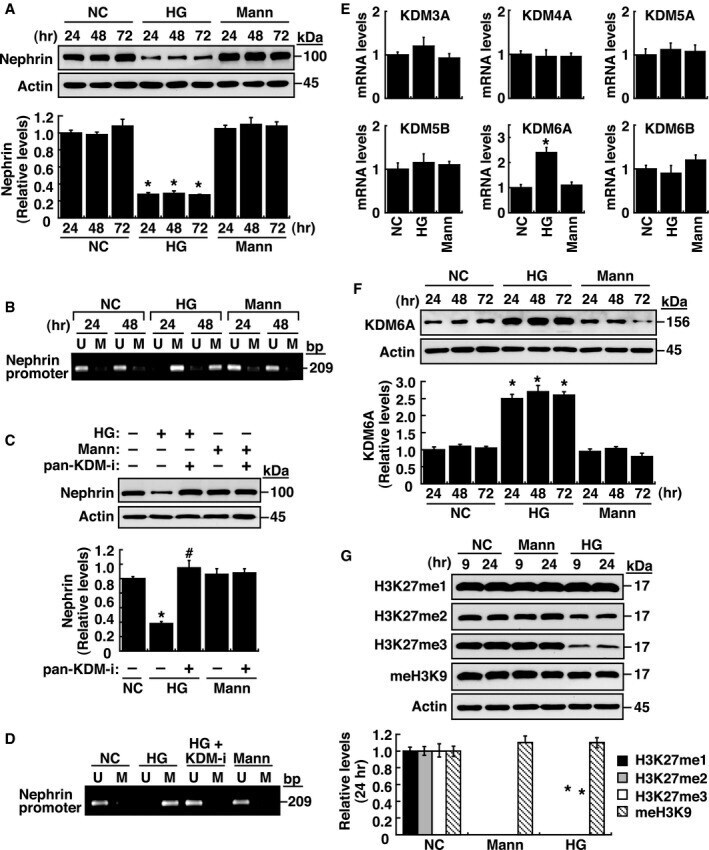
- Figure 1 Multi-layered epigenetic controls contribute to nephrin down-regulation in immortalized mouse podocytes A Western blot analysis of nephrin expression in immortalized podocytes cultured in normal (5 mM) or high glucose (HG; 30 mM) or high mannitol (Mann; 5 mM glucose plus 25 mM mannitol) for 24, 48, and 72 h. * P < 0.05 versus normal controls for the indicated time points (Wilcoxon two-sample test; n = 3). B Analysis of the methylation status at nephrin gene promoter in podocytes cultured in normal, high glucose, or high mannitol at the indicated time points. U, unmethylated-specific primers; M, methylated-specific primers. Experiments were repeated three times, and a representative gel from one experiment is shown. C Effect of pargyline hydrochloride, a pan-KDM inhibitor, on high glucose-mediated nephrin expression. Immortalized mouse podocytes were cultured in the indicated cultured media in the presence or absence of pargyline hydrochloride (1 muM) for 48 h. Protein lysates from the treated podocytes were analyzed for nephrin expression by immunoblotting. * P < 0.05 versus normal controls, # P < 0.05 versus untreated HG-incubated cells (Wilcoxon two-sample test; n = 3). D Effect of pargyline hydrochloride on high glucose-mediated DNA methylation at nephrin gene promoter. Genomic DNA samples from the treated podocytes in (C) were analyzed for methylation status of nephrin gene promoter by methylation-specific PCR. Experiments were repeated three times, and a represe
- Submitted by
- Invitrogen Antibodies (provider)
- Main image
- Experimental details
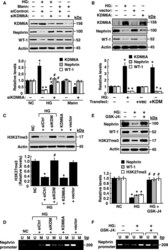
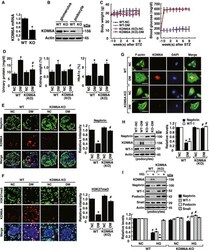
- Figure 2 KDM 6A contributes to down-regulation of nephrin, WT -1, and H3K27me3 in podocytes A Effect of KDM6A knockdown on the expression of nephrin and WT-1 in immortalized mouse podocytes cultured under high glucose conditions. Western blot analyses were performed using protein lysates of podocytes that were transfected with scrambled siRNAs or KDM6A-specific siRNAs, and cultured in high glucose (HG) or high mannitol (Mann) for 48 h. * P < 0.05 versus normal controls, # P < 0.05 versus control siRNA with HG incubation (parametric ANOVA and a Bonferroni post hoc test; n = 3). B Effect of KDM6A overexpression on expression levels of nephrin and WT-1. Immortalized podocytes were transfected with the KDM6A expression plasmid or the empty vector control for 48 h, and the expression levels of KDM6A, nephrin, and WT-1 in these transfected podocytes were analyzed by immunoblotting. * P < 0.05 versus vector controls (Parametric ANOVA and a Bonferroni post hoc test; n = 3). C Changes in H3K27me3 levels in podocytes after treatment with high glucose, the combination of high glucose and KDM6A knockdown, or KDM6A overexpression for 48 h. * P < 0.05 versus normal controls, # P < 0.05 versus control siRNA with HG incubation (Parametric ANOVA and a Bonferroni post hoc test; n = 3). D Changes in DNA methylation at nephrin gene promoter by high glucose, by the combination of high glucose plus KDM6A knockdown, or by KDM6A overexpression in immortalized podocytes. U, unmethylated-specific prim

- Submitted by
- Invitrogen Antibodies (provider)
- Main image

- Experimental details
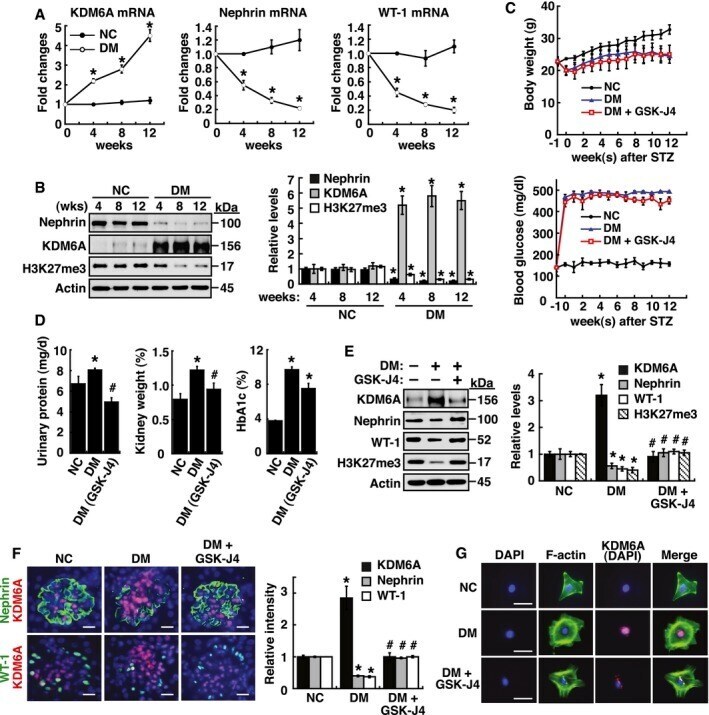
- Figure 3 KDM 6A promotes podocyte and kidney dysfunction in diabetic mice A Relative mRNA levels of KDM6A, nephrin and WT-1, normalized to beta-actin, expressed in kidney glomeruli of normal and diabetic mice at 4, 8, and 12 weeks after diabetic induction. *Significant differences ( P < 0.05) compared with normal controls (Wilcoxon two-sample test; n = 8 each). B Western blot analysis of nephrin, KDM6A, and H3K27me3 in kidney glomeruli of normal and diabetic mice at different time points. * P < 0.05 versus normal controls for the indicated time points (Wilcoxon two-sample test; n = 3). C Changes in body weights and levels of blood glucose in normal, diabetic, and GSK-J4-treated diabetic mice. As noted, GSK-J4 treatment did not significantly affect body weights or blood glucose levels in diabetic mice during the experimental period of 12 weeks (Wilcoxon two-sample test; n = 8). D Levels of urinary protein excretion, weights of kidney, and levels of HbA1c in normal, diabetic, and GSK-J4-treated diabetic mice. Urinary total protein excretion, kidney weight, and levels of HbA1c were measured at 12 weeks after diabetic induction. The mean relative kidney weight (%) shown in the study is determined as the percent of kidneys out of total body weight, and the HbA1c level is defined as the ratio of HbA1c to the total hemoglobin (% HbA1c; DCCT unit). * P < 0.05 versus normal controls, # P < 0.05 versus untreated diabetic mice (parametric ANOVA and a Bonferroni post hoc test; n = 8). E
- Submitted by
- Invitrogen Antibodies (provider)
- Main image
- Experimental details
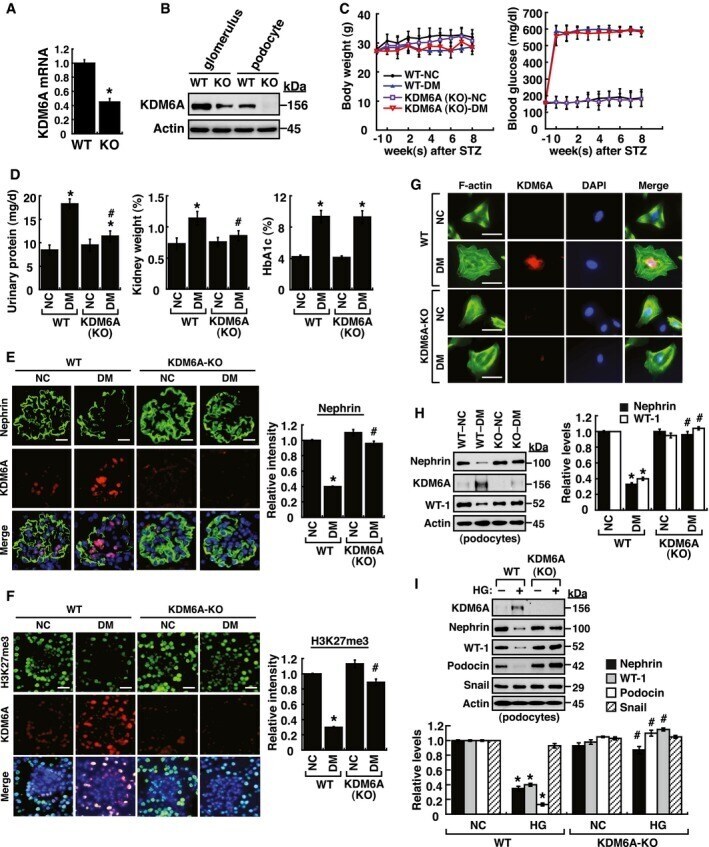
- Figure 4 Podocyte-specific knockout of KDM 6A in mice protects against diabetes-induced kidney injury A Quantitative RT-PCR evaluation of KDM6A mRNA expression in kidney glomeruli isolated from wild-type and KDM6A -knockout (KO) mice. * P < 0.05, significant difference versus wild-type controls (Wilcoxon two-sample test; n = 8). B Western blot analysis of KDM6A expression in glomeruli and podocytes isolated from wild-type and KDM6A -KO mice. Presented experiments were performed at least three times independently. C Changes in body weights and levels of blood glucose in wild-type or KDM6A -KO mice with or without STZ treatment. No significant differences in body weights or blood glucose levels between wild-type and KDM6A -KO mice with diabetes were observed during the 8-week experimental period (Wilcoxon two-sample test; n = 8). D Levels of urinary protein excretion, weights of kidney, and levels of HbA1c in wild-type and KDM6A -KO mice with or without STZ treatment (at 8 weeks after the onset of diabetes). The mean relative kidney weight (%) shown in the study is determined as the percent of kidneys out of total body weight, and the HbA1c level is defined as the ratio of HbA1c to the total hemoglobin (% HbA1c; DCCT unit). * P < 0.05 versus untreated wild-type controls, # P < 0.05 versus STZ-treated wild-type mice (parametric ANOVA and a Bonferroni post hoc test; n = 8). E Immunofluorescence images of kidney sections stained with KDM6A and nephrin in wild-type (WT-NC), KDM6A -
- Submitted by
- Invitrogen Antibodies (provider)
- Main image
- Experimental details
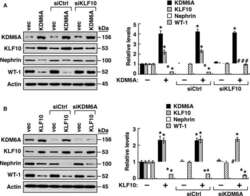
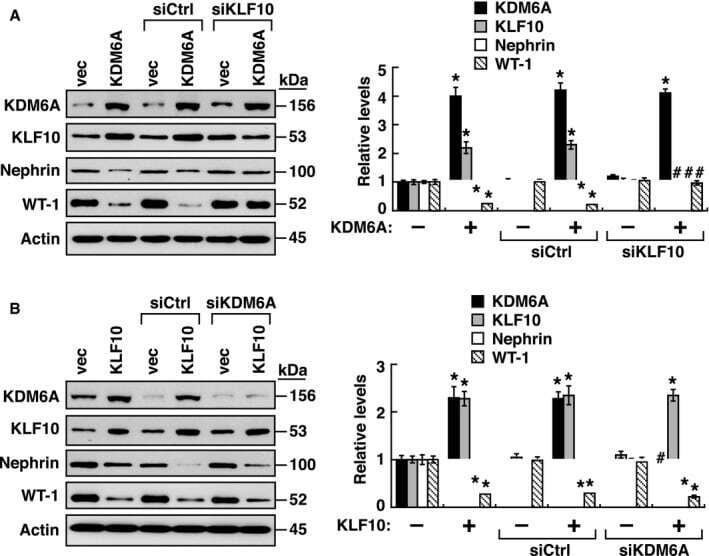
- Figure EV4 KLF 10 is dominant over KDM 6A in mediating down-regulation of nephrin and WT -1 A Effects of KDM6A overexpression in combination with KLF10 knockdown on the expression of podocyte-specific markers. Relative levels of KDM6A, KLF10, nephrin, and WT-1 expressed in podocytes that were transfected with the indicated plasmids, and siRNAs were determined by Western blot analysis. * P < 0.05 versus vector-transfected podocytes, # P < 0.05 versus podocytes transfected with KDM6A and control siRNA (parametric ANOVA and a Bonferroni post hoc test; n = 3). B Effects of KLF10 overexpression in combination with KDM6A knockdown on the expression of podocyte-specific markers. Relative levels of KDM6A, KLF10, nephrin, and WT-1 expressed in podocytes that were transfected with the indicated plasmids and siRNAs were determined by Western blot analysis. * P < 0.05 versus vector-transfected podocytes, # P < 0.05 versus podocytes transfected with KLF10 and control siRNA (parametric ANOVA and a Bonferroni post hoc test; n = 3). Data information: Data are expressed as mean +- SEM. See the exact P -values for comparison tests in Appendix Table S10 . Source data are available online for this figure.
- Submitted by
- Invitrogen Antibodies (provider)
- Main image
- Experimental details
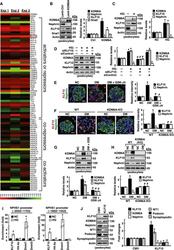
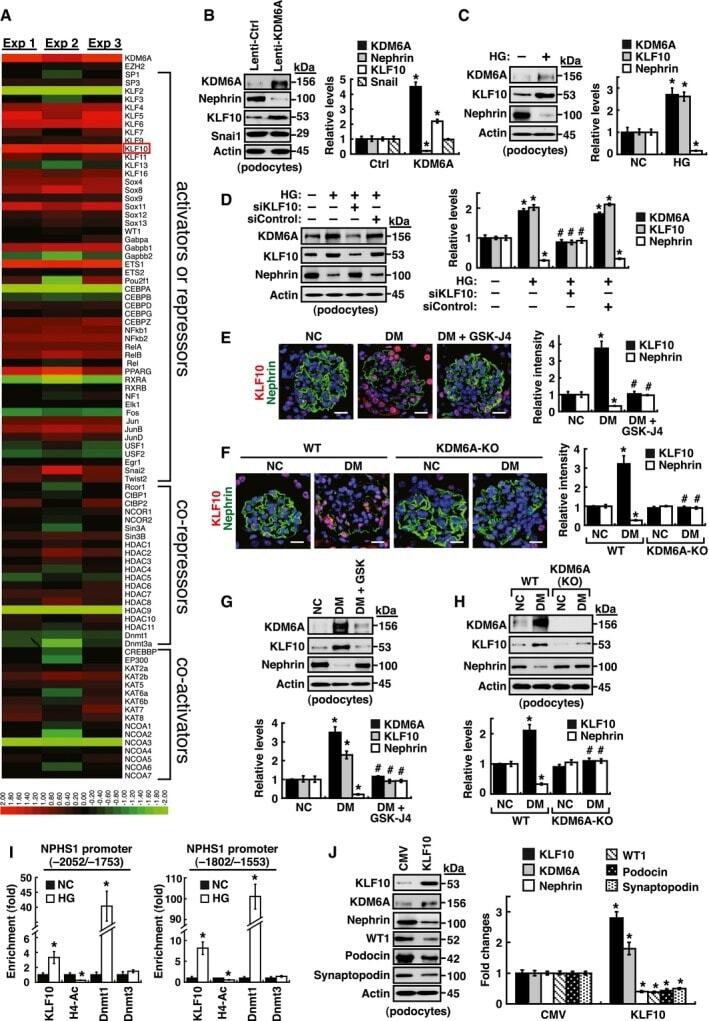
- Figure 5 KLF 10 is a downstream effector of KDM 6A and is capable of directly binding to nephrin gene promoter A Screening of the potential KDM6A-regulated transcriptional factors involved in repression of nephrin expression. After transduction with a control lentiviral vector or a lentiviral vector expressing KDM6A into primary podocytes for 48 h, intracellular RNAs were isolated and used for RNA sequencing (RNA-Seq) analysis. The transcript expression patterns of 86 selected transcriptional factors from three independent RNA-Seq experiments are presented in a heat map. Notably, among these 86 selected genes, KLF10 is the most up-regulated gene. B Validation of increased KDM6A and KLF10 expression in primary podocytes that were infected with an empty lentiviral vector or KDM6A-expressing lentiviral vector for 48 h. * P < 0.05 versus the empty vector control (Wilcoxon two-sample test; n = 3). C Increased expression of KDM6A and KLF10 in primary podocytes cultured in high glucose for 48 h. * P < 0.05 versus normal controls (Wilcoxon two-sample test; n = 3). D Effect of KLF10 knockdown on high glucose-mediated reduction of nephrin in primary podocytes. As noted, knockdown of KLF10 prevented down-regulation of nephrin and up-regulation of KDM6A in high glucose-treated podocytes. * P < 0.05 versus normal controls, # P < 0.05 versus control siRNA with HG incubation (parametric ANOVA and a Bonferroni post hoc test; n = 3). E Immunofluorescence analy
- Submitted by
- Invitrogen Antibodies (provider)
- Main image
- Experimental details
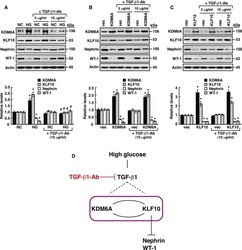
- Figure EV5 Addition of a TGF -beta1-neutralizing antibody has no significant effects on the positive inter-regulation between KDM 6A and KLF 10 in podocytes A Effects of TGF-beta1 neutralization on high glucose-mediated gene expression. Podocytes cultured in normal or high glucose were treated with different doses (3 and 10 mug/mL) of TGF-beta1-neutralizing antibody (MAB240, R&D Systems) for 48 h. Relative protein levels of KDM6A, KLF10, nephrin, and WT-1 in these treated podocytes were analyzed by Western blot analysis. * P < 0.05 versus normal controls, # P < 0.05 versus podocytes in high glucose (parametric ANOVA and a Bonferroni post hoc test; n = 3). B Effects of TGF-beta1 neutralization on KDM6A-mediated gene expression. Podocytes transfected with an empty vector or KDM6A-expressing plasmid were treated with different doses (3 and 10 mug/mL) of TGF-beta1 neutralizing antibody (MAB240, R&D Systems) for 48 h. Relative expression levels of KDM6A, KLF10, nephrin, and WT-1 in these treated podocytes were analyzed by Western blot analysis. * P < 0.05 versus podocytes transfected with an empty vector (parametric ANOVA and a Bonferroni post hoc test; n = 3). C Effects of TGF-beta1 neutralization on KLF10-mediated gene expression. Podocytes transfected with an empty vector or KLF10-expressing plasmid were treated with different concentrations (3 and 10 mug/mL) of TGF-beta1 neutralizing antibody (MAB240, R&D Systems) for 48 h. Relative expression levels

- Submitted by
- Invitrogen Antibodies (provider)
- Main image
- Experimental details
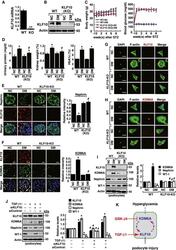
- Figure 6 KDM 6A and KLF 10 can build a positive feedback loop that is critically involved in podocyte dysfunction A Quantitative RT-PCR evaluation of KLF10 mRNA expression in kidney samples of wild-type and KLF10 -knockout (KO) mice. ** P < 0.0001, significant difference versus wild-type controls (Wilcoxon two-sample test; n = 8). B Western blot analysis of KLF10 expression in kidney samples of wild-type or KLF10 -KO mice treated with or without STZ at 8 weeks after the onset of diabetes. Presented experiments were performed at least three times independently. C Changes in body weight and blood glucose levels in wild-type or KLF10 -KO mice with or without STZ treatment. No significant differences in body weights or blood glucose levels between diabetic wild-type mice and diabetic KLF10 -KO mice were detected (Wilcoxon two-sample test; n = 8). D Levels of urinary protein excretion, weights of kidney, and levels of HbA1c in wild-type or KLF10 -KO mice with or without STZ treatment. The mean relative kidney weight (%) shown in the study is determined as the percent of kidneys out of total body weight, and the HbA1c level is defined as the ratio of HbA1c to the total hemoglobin (% HbA1c; DCCT unit). * P < 0.05 versus untreated wild-type controls, # P < 0.05 versus STZ-treated wild-type mice (parametric ANOVA and a Bonferroni post hoc test; n = 8). E Immunofluorescence images of kidney sections stained with KLF10 and nephrin in wild-type or KLF1
- Submitted by
- Invitrogen Antibodies (provider)
- Main image
- Experimental details
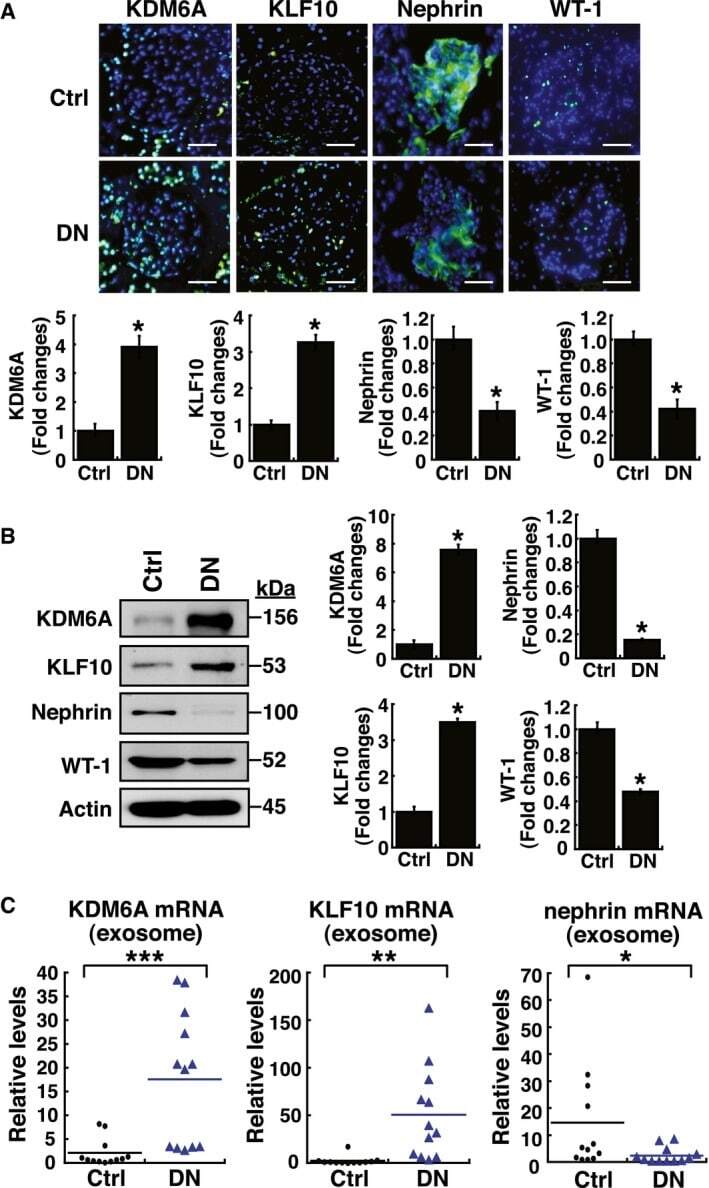
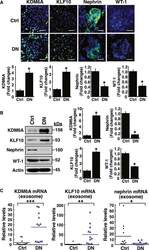
- Figure 7 Elevated levels of KDM 6A and KLF 10 expression, along with decreased levels of nephrin (or WT -1) expression, are detected in kidney tissues and urinary exosomes of patients with diabetic nephropathy A Immunofluorescence analysis of kidney sections from diabetic nephropathy subjects and non-diabetic controls stained with KDM6A, KLF10, nephrin, and WT-1. Scale bars, 50 mum. * P < 0.05 by Wilcoxon two-sample test ( n = 6 for each group). B Western blot analysis of kidney tissues from non-diabetic controls and diabetic nephropathy subjects. Expression levels of KDM6A, KLF10, nephrin, and WT-1 in kidney tissues were determined by immunoblotting using the indicated antibodies. Relative protein levels in kidney tissues were normalized to actin. * P < 0.05 by Wilcoxon two-sample test ( n = 6 for each group). C Levels of KDM6A and KLF10, nephrin mRNAs in urine exosomes of diabetic nephropathy patients and non-diabetic controls. Relative mRNA levels in human urinary exosomes were normalized to 18S rRNA. Horizontal lines are medians. * P < 0.05, ** P < 0.01, and *** P < 0.001 by Wilcoxon two-sample test ( n = 12 for each group). Data information: Data are expressed as mean +- SEM (A and B). See the exact P -values for comparison tests in Appendix Table S7 .