 Explore
 Validate
 Learn
Learn Immunohistochemistry
Antibody data
- Antibody Data
- Antigen structure
- References [1]
- Comments [0]
- Validations
- Immunohistochemistry [1]
- Other assay [2]
Submit
Validation data
Reference
Comment
Report error
- Product number
- PA5-33710 - Provider product page

- Provider
- Invitrogen Antibodies
- Product name
- GPR4 Polyclonal Antibody
- Antibody type
- Polyclonal
- Antigen
- Synthetic peptide
- Description
- Percent identity with other species by BLAST analysis: Human, Gibbon, Monkey, Mouse, Rat, Dog, Bat, Bovine, Panda, Rabbit, Pig (100%) Zebrafish (85%).
- Reactivity
- Human, Mouse, Rat, Bovine, Porcine, Rabbit, Simian
- Host
- Rabbit
- Isotype
- IgG
- Vial size
- 50 µg
- Concentration
- 1 mg/mL
- Storage
- Store at 4°C short term. For long term storage, store at -20°C, avoiding freeze/thaw cycles.
Submitted references The proton-activated G protein-coupled receptor GPR4 regulates the development of osteoarthritis via modulating CXCL12/CXCR7 signaling.
Li R, Guan Z, Bi S, Wang F, He L, Niu X, You Y, Liu Y, Ding Y, Siwko S, Wang N, Zhang Z, Jin Y, Luo J
Cell death & disease 2022 Feb 14;13(2):152
Cell death & disease 2022 Feb 14;13(2):152
No comments: Submit comment
Supportive validation
- Submitted by
- Invitrogen Antibodies (provider)
- Main image
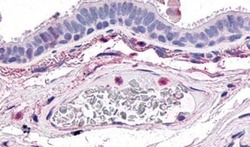
- Experimental details
- Immunohistochemical analysis of formalin-fixed paraffin-embedded human lung, respiratory epithelium using a GPR4 polyclonal antibody (Product # PA5-33710). Heat-induced antigen retrieval was performed prior to staining.

Supportive validation
- Submitted by
- Invitrogen Antibodies (provider)
- Main image

- Experimental details
- Fig. 1 GPR4 expression was upregulated in human and mouse OA articular cartilage. A The mRNA levels of GPR4 in intact and damaged regions of articular cartilage from OA patients ( n = 8) were determined by qRT-PCR. Data are expressed as mean +- s.d. ** p < 0.01 by Student's two-tailed t test. B Correlation between the expression of GPR4 and COL2A1 (left), or MMP3 (right) in intact and damaged regions of articular cartilage from OA patients ( n = 8) by qRT-PCR. Pearson's correlation analysis was performed. C , D Representative images of Safranin-O staining and immunohistochemistry (IHC) staining of GPR4 in intact and damaged regions of articular cartilage from human OA patients ( C ), Scale bar, 50 mum ( n = 8 patients per group). International Cartilage Repair Society (ICRS) scores of human OA cartilage were analyzed ( D , left) and GPR4 positive cells were quantified by IHC ( D , right). n = 8. Data are expressed as mean +- s.d. ** p < 0.01, *** p < 0.001 by Student's two-tailed t test. E - H Staining of articular cartilage sections with Safranin-O and GPR4 IHC from sham-operated ( n = 6) or DMM-operated ( n = 7) mice ( E ) or 4- or 24-month-old mice ( n = 7). Scale bars, 50 mum. G The corresponding OARSI (Osteoarthritis Research Society International) scores were assessed ( F and H , left) and GPR4 expression was quantified ( F and H , right), respectively. n = 7. Data are expressed as mean +- s.d. ** p < 0.01, *** p < 0.001 by Student's two-tailed t test.

- Submitted by
- Invitrogen Antibodies (provider)
- Main image

- Experimental details
- Lentivirus-mediated overexpression of GPR4 in mouse joint accelerated the development of posttraumatic OA. A , B Representative images of Safranin-O staining of mouse joints injected with lentivirus expressing GPR4 (Lenti-Gpr4) or empty control (Lenti-Ctrl). Four days after DMM surgery, the mice were IA injected with lentivirus once a week. Eight weeks later, the joints were collected and subject to Safranin-O staining ( A ). Scale bars, 50 mum. OARSI scores ( B ) were analyzed. Sham groups ( n = 7 mice), DMM groups ( n = 7 mice). Data are expressed as mean +- s.d. ** p < 0.01 using two-way ANOVA followed by Tukey's post hoc test. C - F Representative images of indicated antibody IHC staining of knee joint sections taken 8 weeks after DMM or Sham operation with Lenti-Gpr4 or Lenti-Ctrl injection. The corresponding quantitative analyses were shown in ( D - F ). Scale bars, 50 mum. n = 7 per group. Data are expressed as mean +- s.d. * p < 0.05, ** p < 0.01, *** p < 0.001 using two-way ANOVA followed by Tukey's post hoc test. G , H The joints were collected and subjected to H&E and IHC staining. Scale bars, 50 mum. G Synovitis scores were determined based on H&E staining ( H left, n = 7) and F4/80 positive cells were quantified ( H right, n = 7). Data are expressed as mean +- s.d. * p < 0.05, *** p < 0.001 using two-way ANOVA followed by Tukey's post hoc test. I Von Frey assay (left) and thermal hyperalgesia test (right) were performed 8 weeks after DMM or Sham operation with Le
