Explore
 Validate
 Learn
Learn Western blot
 Immunohistochemistry
Antibody data
- Antibody Data
- Antigen structure
- References [1]
- Comments [0]
- Validations
- Immunohistochemistry [1]
- Other assay [1]
Submit
Validation data
Reference
Comment
Report error
- Product number
- PA5-75267 - Provider product page

- Provider
- Invitrogen Antibodies
- Product name
- HTR1A Polyclonal Antibody
- Antibody type
- Polyclonal
- Antigen
- Synthetic peptide
- Description
- The antibody was affinity-purified from rabbit antiserum by affinity-chromatography using epitope-specific immunogen and the purity is > 95% (by SDS-PAGE).
- Reactivity
- Human, Mouse, Rat
- Host
- Rabbit
- Isotype
- IgG
- Vial size
- 100 μL
- Concentration
- 1 mg/mL
- Storage
- Store at 4°C short term. For long term storage, store at -20°C, avoiding freeze/thaw cycles.
Submitted references Mechanisms Underlying the Action of Ziziphi Spinosae Semen in the Treatment of Insomnia: A Study Involving Network Pharmacology and Experimental Validation.
Bian Z, Zhang W, Tang J, Fei Q, Hu M, Chen X, Su L, Fei C, Ji D, Mao C, Tong H, Yuan X, Lu T
Frontiers in pharmacology 2021;12:752211
Frontiers in pharmacology 2021;12:752211
No comments: Submit comment
Supportive validation
- Submitted by
- Invitrogen Antibodies (provider)
- Main image

- Experimental details
- Immunohistochemistry analysis of HTR1A in paraffin-embedded human brain tissue. Samples were incubated with HTR1A polyclonal antibody (Product # PA5-75267).
Supportive validation
- Submitted by
- Invitrogen Antibodies (provider)
- Main image
- Experimental details
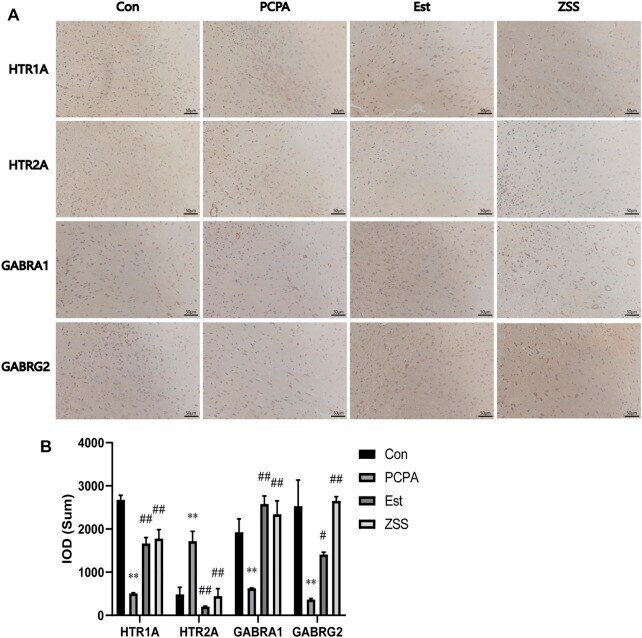
- FIGURE 8 The effects of ZSS on the expression of HTR1A, HTR2A, GABRA1 and GABRG2 in the hypothalamus (A) and immunohistochemistry results (the sum of the IOD) (B) . ** p < 0.01 compared with the control group, ## p < 0.01 compared with the model group. Data are shown as mean +- SD values and n = 3.