Explore
 Validate
 Learn
Learn Western blot
 Immunohistochemistry
Antibody data
- Antibody Data
- Antigen structure
- References [2]
- Comments [0]
- Validations
- Immunohistochemistry [2]
- Other assay [2]
Submit
Validation data
Reference
Comment
Report error
- Product number
- PA5-20332 - Provider product page

- Provider
- Invitrogen Antibodies
- Product name
- CRTH2 Polyclonal Antibody
- Antibody type
- Polyclonal
- Antigen
- Synthetic peptide
- Description
- A suggested positive control is Jurkat cell lysate. PA5-20332 can be used with blocking peptide PEP-0452.
- Reactivity
- Human, Mouse, Rat
- Host
- Rabbit
- Isotype
- IgG
- Vial size
- 100 μg
- Concentration
- 1 mg/mL
- Storage
- Maintain refrigerated at 2-8°C for up to 3 months. For long term storage store at -20°C
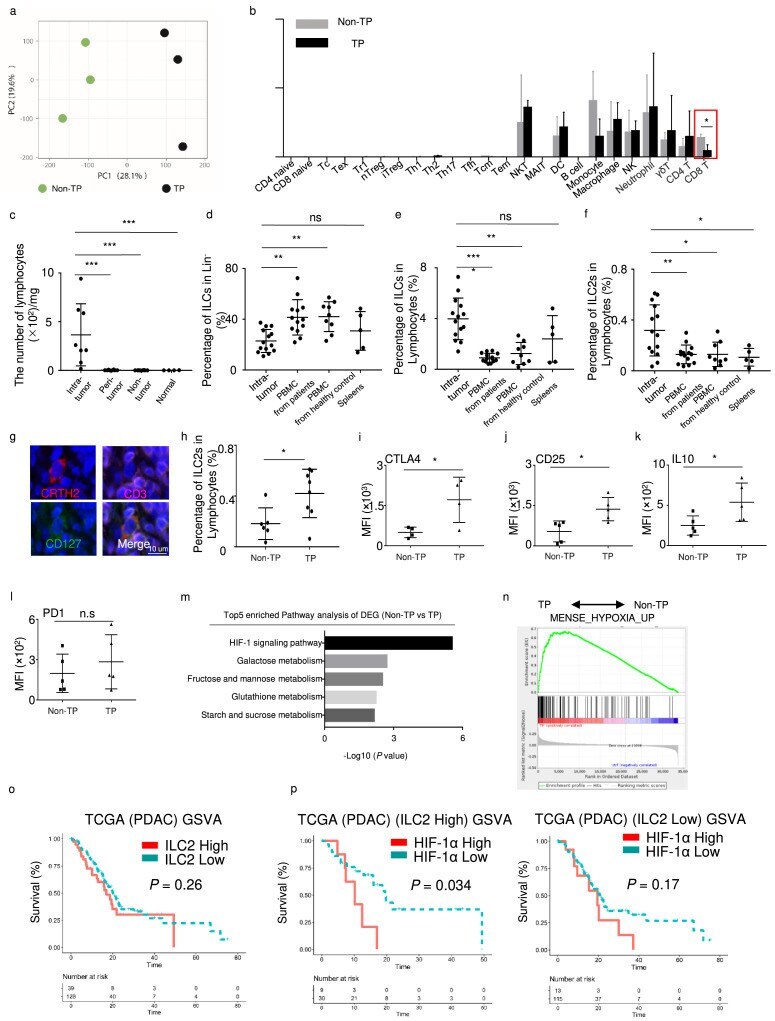
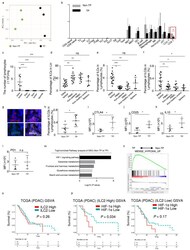
Submitted references Hypoxia-reprogrammed regulatory group 2 innate lymphoid cells promote immunosuppression in pancreatic cancer.
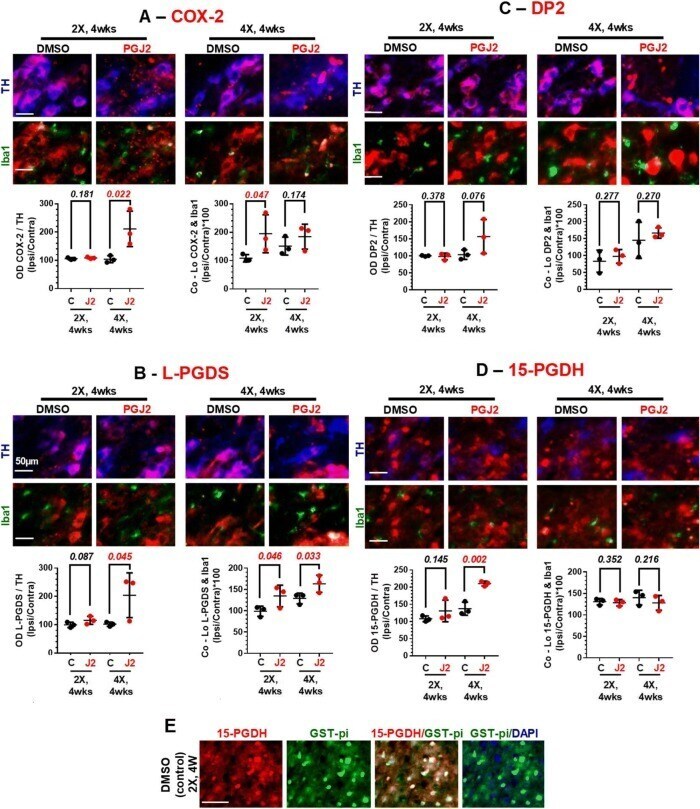
Prostaglandin D2/J2 signaling pathway in a rat model of neuroinflammation displaying progressive parkinsonian-like pathology: potential novel therapeutic targets.
Ye L, Jin K, Liao Z, Xiao Z, Xu H, Lin X, Li H, Li T, Zhang W, Han X, Wang W, Gao H, Liu L, Wu W, Yu X
EBioMedicine 2022 May;79:104016
EBioMedicine 2022 May;79:104016
Prostaglandin D2/J2 signaling pathway in a rat model of neuroinflammation displaying progressive parkinsonian-like pathology: potential novel therapeutic targets.
Corwin C, Nikolopoulou A, Pan AL, Nunez-Santos M, Vallabhajosula S, Serrano P, Babich J, Figueiredo-Pereira ME
Journal of neuroinflammation 2018 Sep 20;15(1):272
Journal of neuroinflammation 2018 Sep 20;15(1):272
No comments: Submit comment
Supportive validation
- Submitted by
- Invitrogen Antibodies (provider)
- Main image
- Experimental details
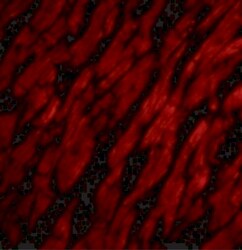
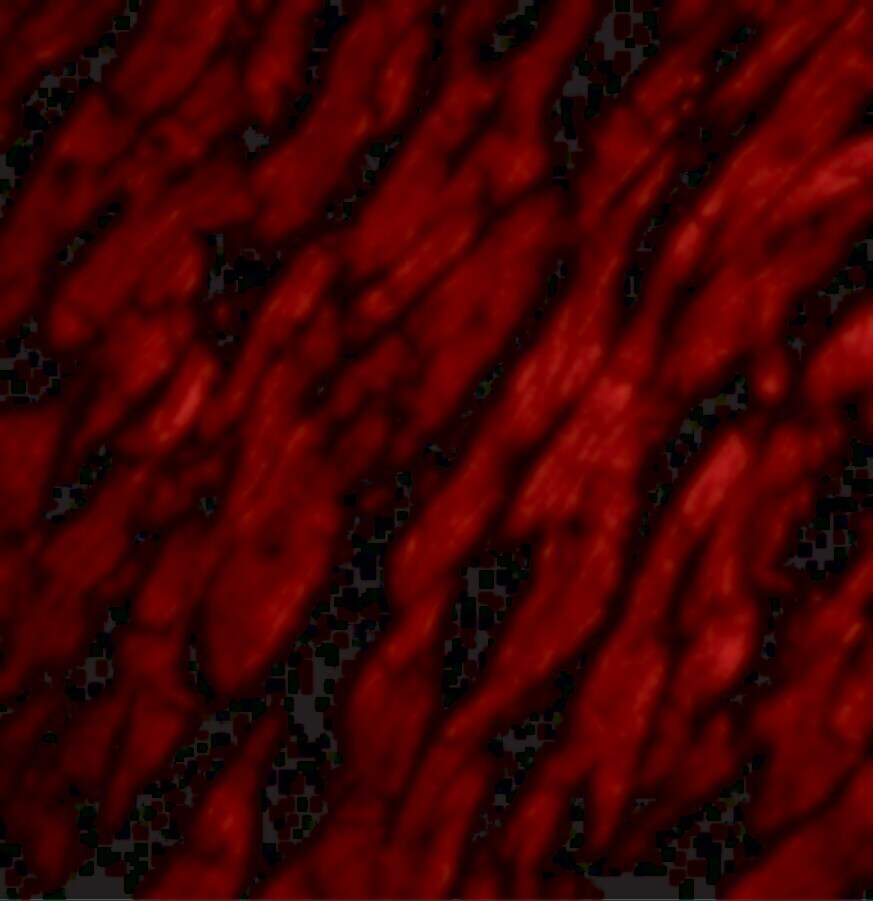
- Immunofluorescence of CRTH2 in Human Heart tissue with CRTH2 Polyclonal Antibody (Product # PA5-20332) at 20 µg/mL.
- Submitted by
- Invitrogen Antibodies (provider)
- Main image
- Experimental details
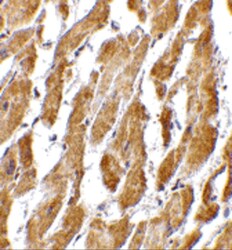
- Immunohistochemistry of CRTH2 in human heart tissue with CRTH2 Polyclonal Antibody (Product # PA5-20332) at 2.5 µg/mL.

Supportive validation
- Submitted by
- Invitrogen Antibodies (provider)
- Main image

- Experimental details
- Fig. 7 Effects of successive PGJ2 microinfusions on the following factors of the PGD2/J2 prostaglandin pathway: COX-2 ( a ), L-PGDS ( b ), DP2 receptor ( c ), and 15-PGDH ( d ), all in dopaminergic neurons and microglia, and 15-PGDH also in oligodendrocytes ( e ). Immunostaining for COX-2 (red in a ), L-PGDS (red in b ), DP2 (red in c ), 15-PGDH (red in d and e ), TH+ neurons (blue in a - d ), Iba1+ microglia (green in a - d ), and GST-pi+ oligodendrocytes (green in e ) at 4 weeks after two (2X) and four (4X) PGJ2 microinjections. Scale bar = 50 mum. a COX-2 is significantly increased in dopaminergic neurons from rats receiving four (4X) PGJ2 injections compared to controls. Co-localization of COX-2 and Iba1 is greater in microglia from rats receiving two (2X) PGJ2 injections than in controls. b L-PGDS is significantly increased in dopaminergic neurons from rats receiving four (4X) PGJ2 injections than in controls. Co-localization of L-PGDS and Iba1 is greater in microglia from rats receiving two (2X) and four (4X) PGJ2 injections than in controls. c DP2 levels remain stable in dopaminergic neurons from all treatment groups, but DP2+ staining is almost absent in microglia. d 15-PGDH expression is increased in dopaminergic neurons from rats receiving four (4X) PGJ2 injections, but not in microglia. e 15-PGDH is highly expressed in SNpc oligodendrocytes from all groups of rats. Values on the y -axis represent the optical density (OD, normalized to TH, left g
- Submitted by
- Invitrogen Antibodies (provider)
- Main image
- Experimental details
- Characterization of a novel ILC2 group in pancreatic cancer. (a) Visualization of TP ( n = 3) and Non-TP ( n = 3) in PCA, computed on a gene expression matrix. (b) Major immune cells abundance in TP and Non-TP patients estimated by ImmuCellAI algorithm, using microarray data. (c) Lymphocyte numbers in intra-tumor ( n = 8), peri-tumor ( n = 8), non-tumor ( n = 8), and normal tissues ( n = 4), assessed with the Mann-Whitney U test. (d) Percentages of ILCs in Lin - in tumors ( n = 14), PBMCs from patients ( n = 13), PBMCs from healthy controls ( n = 9), and spleens ( n = 5). (e) Percentages of ILCs in lymphocytes from tumors ( n = 14), PBMCs from patients ( n = 13), PBMCs from healthy controls ( n = 9), and spleens ( n = 5). (f) Percentages of ILC2s in lymphocytes from tumors ( n = 14), PBMCs from patients ( n = 13), PBMCs from healthy controls ( n = 9), and spleens ( n = 5). (g) Representative immunofluorescence images (magnification, x 1500) of human PDAC tissue stained with antibodies against CRTH2 (red), CD3 (pink), and CD127 (green). Nuclei were stained with DAPI (blue). (h) Percentages of ILC2s in lymphocytes from Non-TP ( n = 6) and TP ( n = 8) patients. Statistical analysis of CTLA4 ( n = 4) (i), CD25 ( n = 5) (j), IL10 ( n = 5) (k) and PD1 ( n = 5) (l) in ILC2 from Non-TP and TP patients. (m) Pathway analysis of differentially expressed genes highly expressed in TP. (n) Gene set enrichment analysis (GSEA) of hypoxia pathway in TP and Non-TP patients. (o) Gene Set Varian