Explore
 Validate
 Learn
Learn Western blot
 ELISA
ELISAAntibody data
- Antibody Data
- Antigen structure
- References [4]
- Comments [0]
- Validations
- Western blot [3]
- Immunocytochemistry [1]
- Immunoprecipitation [1]
- Immunohistochemistry [3]
- Other assay [7]
Submit
Validation data
Reference
Comment
Report error
- Product number
- PA5-28106 - Provider product page

- Provider
- Invitrogen Antibodies
- Product name
- VDAC2 Polyclonal Antibody
- Antibody type
- Polyclonal
- Antigen
- Synthetic peptide
- Description
- Recommended positive controls: A549, H1299, HCT116, Mouse liver. Store product as a concentrated solution. Centrifuge briefly prior to opening the vial.
- Reactivity
- Human, Mouse, Rat
- Host
- Rabbit
- Isotype
- IgG
- Vial size
- 100 μL
- Concentration
- 0.65 mg/mL
- Storage
- Store at 4°C short term. For long term storage, store at -20°C, avoiding freeze/thaw cycles.
Submitted references Toxoplasma gondii association with host mitochondria requires key mitochondrial protein import machinery.
Stress granules inhibit fatty acid oxidation by modulating mitochondrial permeability.
Cardiac-specific deletion of voltage dependent anion channel 2 leads to dilated cardiomyopathy by altering calcium homeostasis.
Inflammatory IFIT3 renders chemotherapy resistance by regulating post-translational modification of VDAC2 in pancreatic cancer.
Blank ML, Xia J, Morcos MM, Sun M, Cantrell PS, Liu Y, Zeng X, Powell CJ, Yates N, Boulanger MJ, Boyle JP
Proceedings of the National Academy of Sciences of the United States of America 2021 Mar 23;118(12)
Proceedings of the National Academy of Sciences of the United States of America 2021 Mar 23;118(12)
Stress granules inhibit fatty acid oxidation by modulating mitochondrial permeability.
Amen T, Kaganovich D
Cell reports 2021 Jun 15;35(11):109237
Cell reports 2021 Jun 15;35(11):109237
Cardiac-specific deletion of voltage dependent anion channel 2 leads to dilated cardiomyopathy by altering calcium homeostasis.
Shankar TS, Ramadurai DKA, Steinhorst K, Sommakia S, Badolia R, Thodou Krokidi A, Calder D, Navankasattusas S, Sander P, Kwon OS, Aravamudhan A, Ling J, Dendorfer A, Xie C, Kwon O, Cheng EHY, Whitehead KJ, Gudermann T, Richardson RS, Sachse FB, Schredelseker J, Spitzer KW, Chaudhuri D, Drakos SG
Nature communications 2021 Jul 28;12(1):4583
Nature communications 2021 Jul 28;12(1):4583
Inflammatory IFIT3 renders chemotherapy resistance by regulating post-translational modification of VDAC2 in pancreatic cancer.
Wang Z, Qin J, Zhao J, Li J, Li D, Popp M, Popp F, Alakus H, Kong B, Dong Q, Nelson PJ, Zhao Y, Bruns CJ
Theranostics 2020;10(16):7178-7192
Theranostics 2020;10(16):7178-7192
No comments: Submit comment
Supportive validation
- Submitted by
- Invitrogen Antibodies (provider)
- Main image
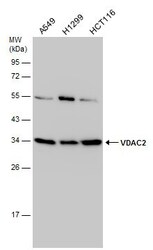
- Experimental details
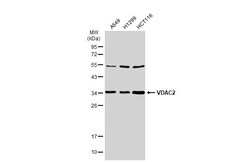
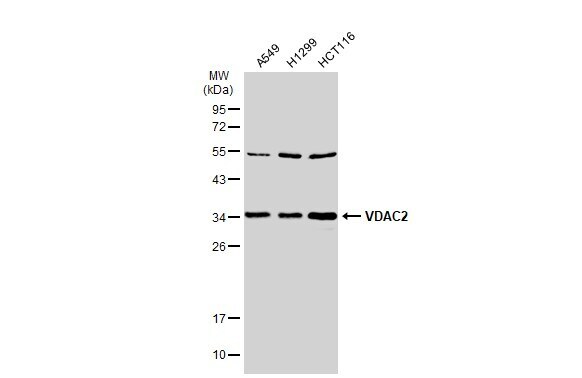
- Western Blot using VDAC2 Polyclonal Antibody (Product # PA5-28106). Various whole cell extracts (30 µg) were separated by 12% SDS-PAGE, and the membrane was blotted with VDAC2 Polyclonal Antibody (Product # PA5-28106) diluted at 1:1,000. The HRP-conjugated anti-rabbit IgG antibody was used to detect the primary antibody.
- Submitted by
- Invitrogen Antibodies (provider)
- Main image
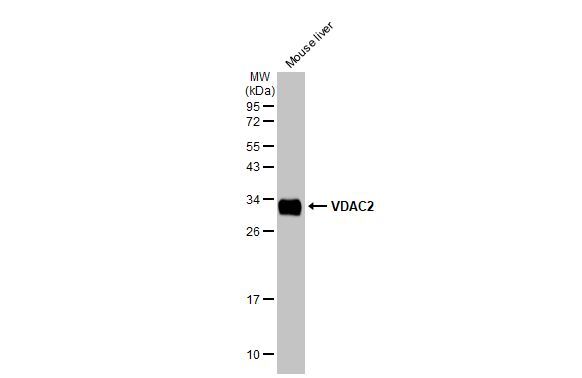
- Experimental details
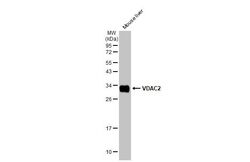
- Western Blot using VDAC2 Polyclonal Antibody (Product # PA5-28106). Mouse tissue extract (50 µg) was separated by 12% SDS-PAGE, and the membrane was blotted with VDAC2 Polyclonal Antibody (Product # PA5-28106) diluted at 1:1,000. The HRP-conjugated anti-rabbit IgG antibody was used to detect the primary antibody.
- Submitted by
- Invitrogen Antibodies (provider)
- Main image
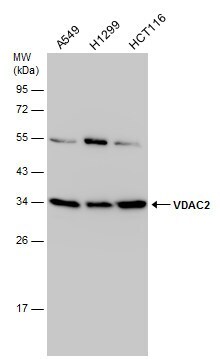
- Experimental details
- Western Blot analysis of VDAC2 was performed by separating 30 µg of various whole cell extracts by 12% SDS-PAGE. Proteins were transferred to a membrane and probed with a VDAC2 Polyclonal Antibody (Product # PA5-28106) at a dilution of 1:1000.
Supportive validation
- Submitted by
- Invitrogen Antibodies (provider)
- Main image

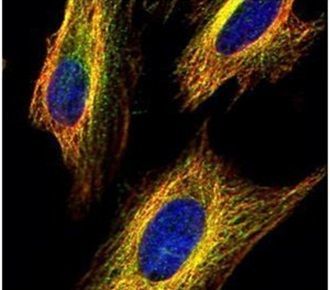
- Experimental details
- Immunofluorescent analysis of VDAC2 in methanol-fixed HeLa cells using a VDAC2 polyclonal antibody (Product # PA5-28106) (Green) at a 1:500 dilution. Alpha-tubulin filaments were labeled with Product # PA5-29281 (Red) at a 1:2000.
Supportive validation
- Submitted by
- Invitrogen Antibodies (provider)
- Main image

- Experimental details
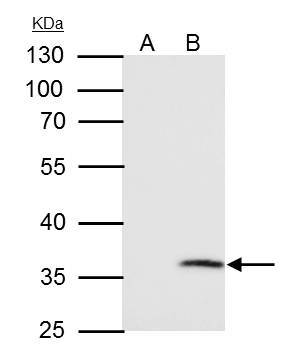
- VDAC2 Polyclonal Antibody immunoprecipitates VDAC2 protein in IP experiments. IP samples: HepG2 whole cell extract. A. Control with 4 µg of preimmune Rabbit IgG. B. Immunoprecipitation of VDAC2 protein by 4 µg VDAC2 Polyclonal Antibody (Product # PA5-28106). 10 % SDS-PAGE. The immunoprecipitated VDAC2 protein was detected by VDAC2 Polyclonal Antibody (Product # PA5-28106) diluted at 1:1,000.

Supportive validation
- Submitted by
- Invitrogen Antibodies (provider)
- Main image
- Experimental details
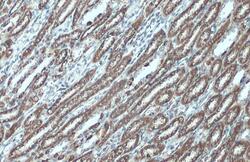
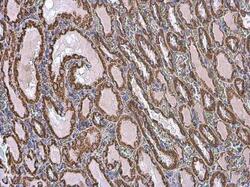
- VDAC2 Polyclonal Antibody detects VDAC2 protein at mitochondria by immunohistochemical analysis. Sample: Paraffin-embedded mouse kidney. VDAC2 stained by VDAC2 Polyclonal Antibody (Product # PA5-28106) diluted at 1:500. Antigen Retrieval: Citrat.
- Submitted by
- Invitrogen Antibodies (provider)
- Main image
- Experimental details
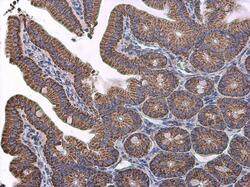
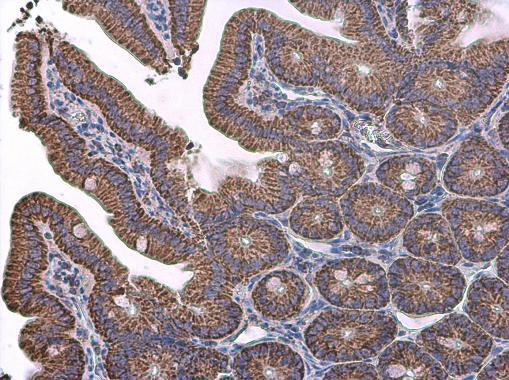
- Immunohistochemistry (Paraffin) analysis of VDAC2 was performed in paraffin-embedded mouse intestine tissue using VDAC2 Polyclonal Antibody (Product # PA5-28106) at a dilution of 1:500.
- Submitted by
- Invitrogen Antibodies (provider)
- Main image
- Experimental details
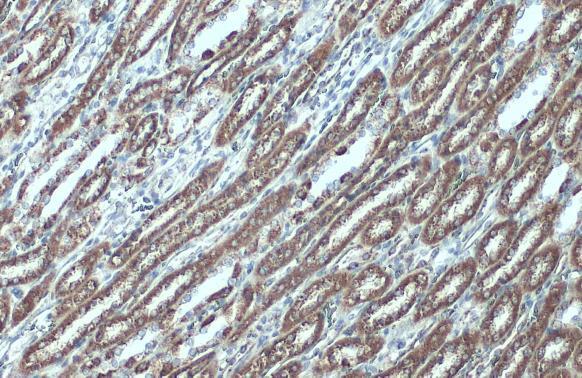
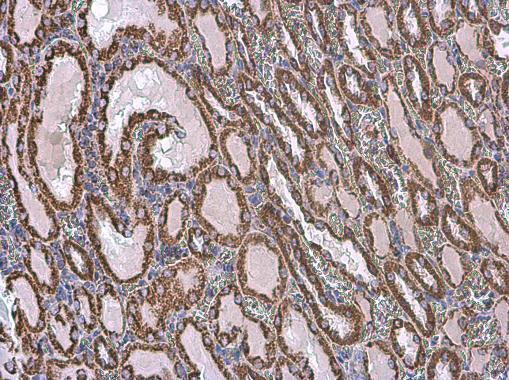
- Immunohistochemistry (Paraffin) analysis of VDAC2 was performed in paraffin-embedded rat kidney tissue using VDAC2 Polyclonal Antibody (Product # PA5-28106) at a dilution of 1:500.
Supportive validation
- Submitted by
- Invitrogen Antibodies (provider)
- Main image

- Experimental details
- VDAC2 Polyclonal Antibody immunoprecipitates VDAC2 protein in IP experiments. IP samples: HepG2 whole cell extract. A. Control with 4 µg of preimmune Rabbit IgG. B. Immunoprecipitation of VDAC2 protein by 4 µg VDAC2 Polyclonal Antibody (Product # PA5-28106). 10 % SDS-PAGE. The immunoprecipitated VDAC2 protein was detected by VDAC2 Polyclonal Antibody (Product # PA5-28106) diluted at 1:1,000.
- Submitted by
- Invitrogen Antibodies (provider)
- Main image
- Experimental details
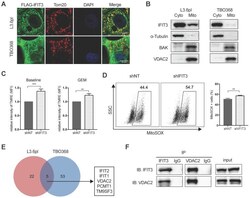
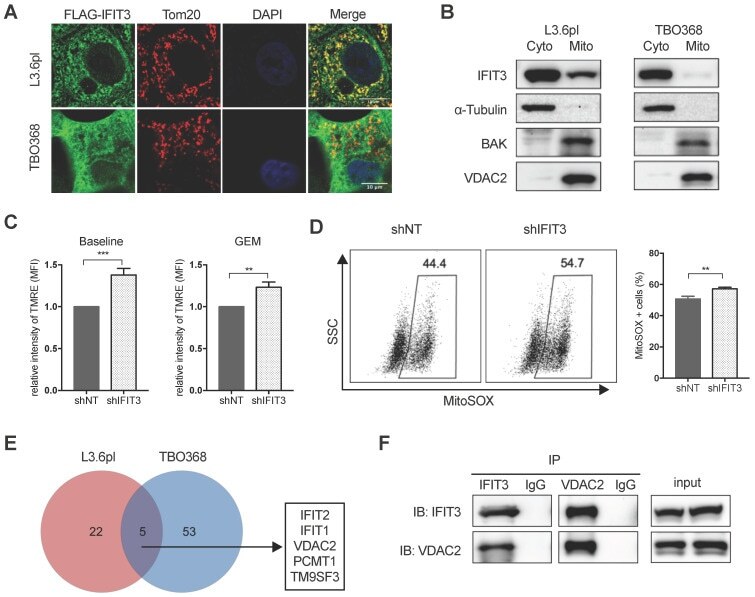
- Figure 4 IFIT3 regulates mitochondria-associated apoptosis. (A) Confocal immunofluorescence labeled with anti-FLAG ( green ), anti-Tom20 ( red ), and counterstained with DAPI ( blue ), showed co-localization of FLAG-tagged IFIT3 and Tom20 in mitochondria. L3.6pl and TBO368 cells stably express FLAG-tagged IFIT3 were used here. Scale was shown in the lower-right corner. (B) Western blot showed localization of IFIT3 in cytosol and mitochondria of L3.6pl and TBO368. Mitochondria were isolated as indicated in methods section. Cyto represent cytosol and Mito represent mitochondria. We probed alpha-Tubulin as cytosolic marker, BAK and VDAC2 as mitochondrial marker. (C) IFIT3 knockdown in L3.6pl altered mitochondrial membrane potential (DeltaPsim) with or without gemcitabine treatment. TMRE was used to determine the mitochondrial membrane potential (DeltaPsim). MFI: mean fluorescence intensity. (D) IFIT3 knockdown in L3.6pl showed more MitoSOX positive cells when treated with gemcitabine. Representative FACS dot plot and bar graph are shown. (E) Mass spectrometry results of immunoprecipitated samples by anti-IFIT3 antibody are shown in Venn diagram. Cells were treated with gemcitabine for indicated time before harvest. Proteins with p < 0.01 and log2 difference > 1 are considered significant. Proteins identified in the intersection of L3.6pl and TBO368 are listed beside the diagram. (F) Interaction between IFIT3 and VDAC2 was confirmed with western blot in L3.6pl. Data are presented
- Submitted by
- Invitrogen Antibodies (provider)
- Main image

- Experimental details
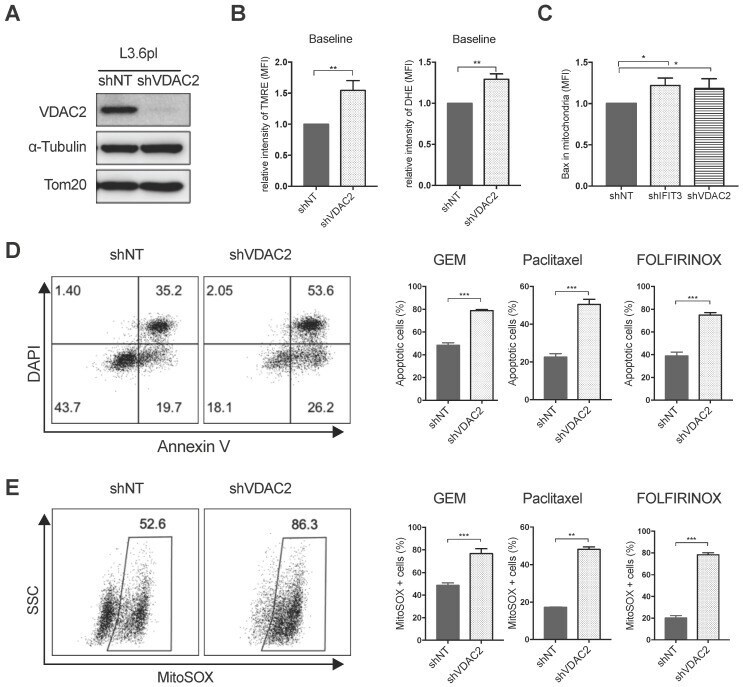
- Figure 5 VDAC2 protects PDAC cells from chemotherapy induced apoptosis. (A) VDAC2 Knockdown was confirmed with western blot in L3.6pl. alpha-Tubulin and Tom20 were probed as loading control. (B) VDAC2 knockdown significantly increased the mitochondrial membrane potential (DeltaPsim) and ROS production of L3.6pl in baseline. TMRE and DHE were used to determine the mitochondrial membrane potential (DeltaPsim) and ROS production. (C) Translocation of BAX to mitochondria was increased after knockdown of IFIT3 and VDAC2 in L3.6pl. Cells were treated with gemcitabine for 48h before permeabilization and fixation. Samples were analyzed with flow cytometry. (D-E) VDAC2 knockdown increased sensitivity of L3.6pl to chemotherapy, as indicated by apoptotic assay (D) and MitoSOX staining (E). Representative FACS dot plot and bar graph are shown. Data are presented as mean +- SEM of three independent experiments. * p < 0.05, ** p < 0.01, *** p < 0.001.
- Submitted by
- Invitrogen Antibodies (provider)
- Main image
- Experimental details
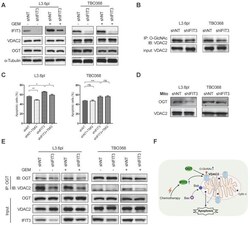
- Figure 6 IFIT3 modulates the O-GlcNAc level of VDAC2 through OGT. (A) IFIT3 knockdown did not alter the protein level of VDAC2 in both L3.6pl and TBO368. Membranes were probed with IFIT3, VDAC2 and OGT, then stripped and re-probed with alpha-Tubulin as loading control. (B) IFIT3 knockdown decreased the O-GlcNAc modification level of VDAC2. O-GlcNAc modified proteins were immunoprecipitated with anti-O-GlcNAc (RL2) antibody and blot was probed with anti-VDAC2 antibody. Input of VDAC2 was probed for loading control. (C) TMG reduced gemcitabine induced apoptosis in L3.6pl while show no difference in TBO368. Cells were treated as indicated for 48 h and 72 h, in L3.6pl and TBO368, respectively. TMG, 5 uM. Data are presented as mean +- SEM of three independent experiments. (D) OGT level in mitochondrial fraction was decreased in IFIT3 knockdown cells compared to non-target control cells. Mitochondria were isolated as indicated in methods section. VDAC2 was used as loading control. (E) Immunoprecipitation of OGT showed less binding of VDAC2 after knockdown of IFIT3 in both L3.6pl and TBO368, with or without gemcitabine treatment. (E) Schematic picture of IFIT3 regulating the O-GlcNAc modification of VDAC2 and protecting PDAC cells from chemotherapy induced apoptosis. * p < 0.05, ** p < 0.01, *** p < 0.001, ns: non-significant, p > 0.05.

- Submitted by
- Invitrogen Antibodies (provider)
- Main image

- Experimental details
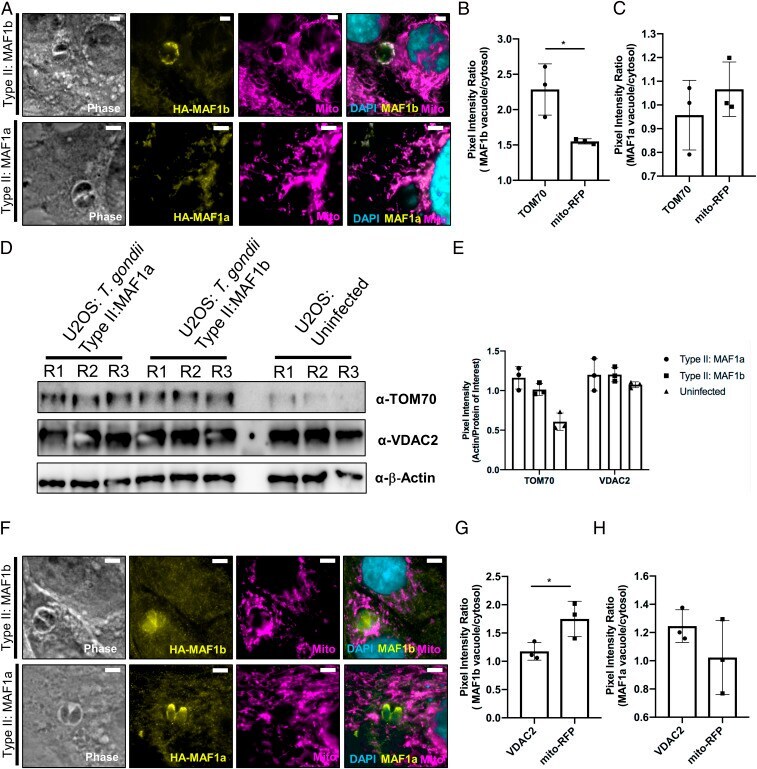
- Fig. 4. TOM70 is enriched and redistributed at the parasitophorous vacuole membrane. ( A ) Normal rat kidney cells expressing RFP-labeled mitochondria were infected with type II:MAF1b or type II:MAF1a parasites. Cells were fixed and visualized with epifluorescence microscopy. Immunofluorescence staining was performed with antibodies against TOM70. ( B ) Enrichment of either RFP-mitochondria or TOM70 at the parasitophorous vacuole was performed by quantifying pixel intensity of either the TOM70 or the mitochondria channel in a selected region on the vacuole membrane and a region off of the vacuole membrane. The ratio of these two areas was then calculated to measure enrichment of mito-RFP or TOM70 protein at the type II:MAF1b vacuole. * P = 0.0250, unpaired two-tailed t test. ( C ) Similar to B , enrichment ratios were calculated in cells infected with type II:MAF1a parasites. ( D ) U2OS cells were infected with type II:MAF1b or type II:MAF1a parasites for 24 h (MOI 2) in triplicate. Cells were lysed at 24 h in IP lysis buffer and boiled in lithium dodecyl sulfate sample buffer. Western blot analysis was performed with the listed primary antibodies and HRP-conjugated secondary antibodies. ( E ) Densitometric actin/TOM70 quantification of Western blots depicted in D using FIJI ImageJ software (NIH). ( F ) MitoRFP NRK cells were treated as in A and immunofluorescence staining was performed with antibodies against VDAC2. ( G ) VDAC2 raw pixel intensity values were measured as pre
- Submitted by
- Invitrogen Antibodies (provider)
- Main image
- Experimental details
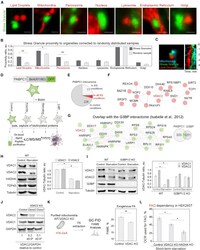
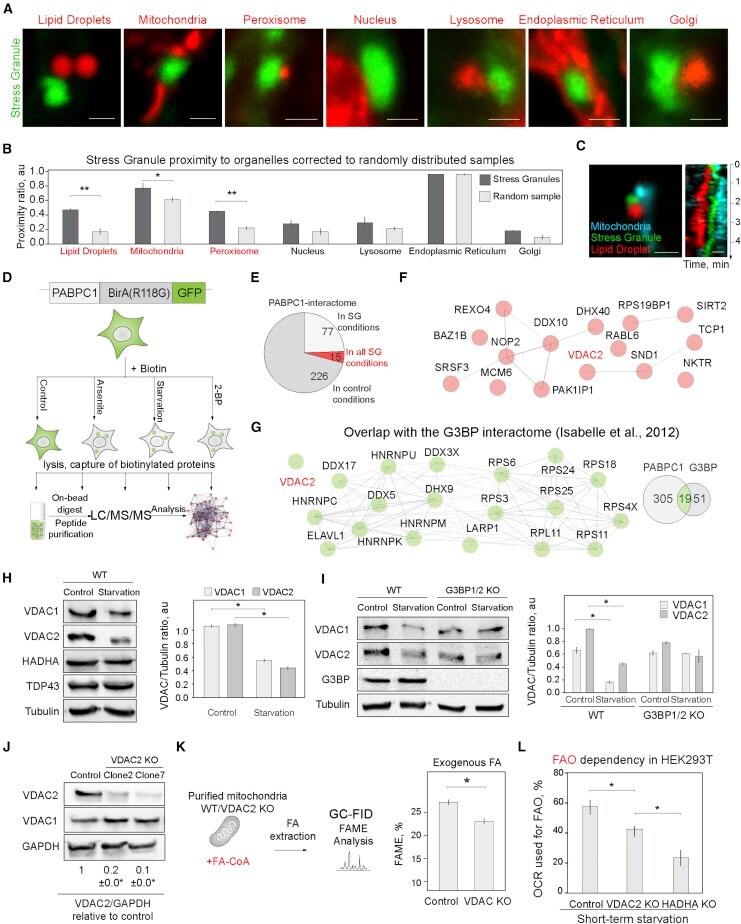
- Figure 3 SGs interactome reveals mitochondrial association (A) Confocal microscopy of SG-organelle proximity in HEK293T cells expressing CRISPR-Cas9-tagged PABPC1-DDR2 starved for 9 h. Organelles were visualized with live cell dyes (added 30 min prior to the imaging) or plasmid-encoded markers: LDs (Bodipy-C12), mitochondria (Mito Red), peroxisomes (mCH-SKL), nucleus (Hoechst), lysosome (Lamp1-mCH), endoplasmic reticulum (CALR21-mCH-KDEL), and Golgi apparatus (B4GALT182-mCH). Scale bar, 1 mum. (B) Quantification of SG proximity to membrane-bound organelles showing absolute SG proximity compared with proximity of randomly generated SG sample. Graphs show the ratio of proximal SGs in a sample, mean +- SEM, n = 30. (C) Confocal microscopy of the tripartite association between SG (PABPC1-DDR2), LD (Bodipy-C12), and mitochondria (Rhodamine800) in HEK293T cells expressing CRISPR-Cas9-tagged PABPC1-DDR2 starved for 9 h. Organelles were visualized with live cell dyes (added 30 min prior to the imaging). Kymograph was recorded with 2 s interval between frames for 5 min. Scale bar, 1 mum. (D) Schematic of protein identification by mass spectrometry. (E) Circle diagram shows PABPC1 interactome identified in all conditions. (F) Network of proteins that are present in all SG conditions, but not in the control conditions. Mitochondrial membrane protein is indicated in red. (G) Analysis of SG-enriched fraction by comparison with G3BP-interacting proteins (). Mitochondrial membrane protein V
- Submitted by
- Invitrogen Antibodies (provider)
- Main image

- Experimental details
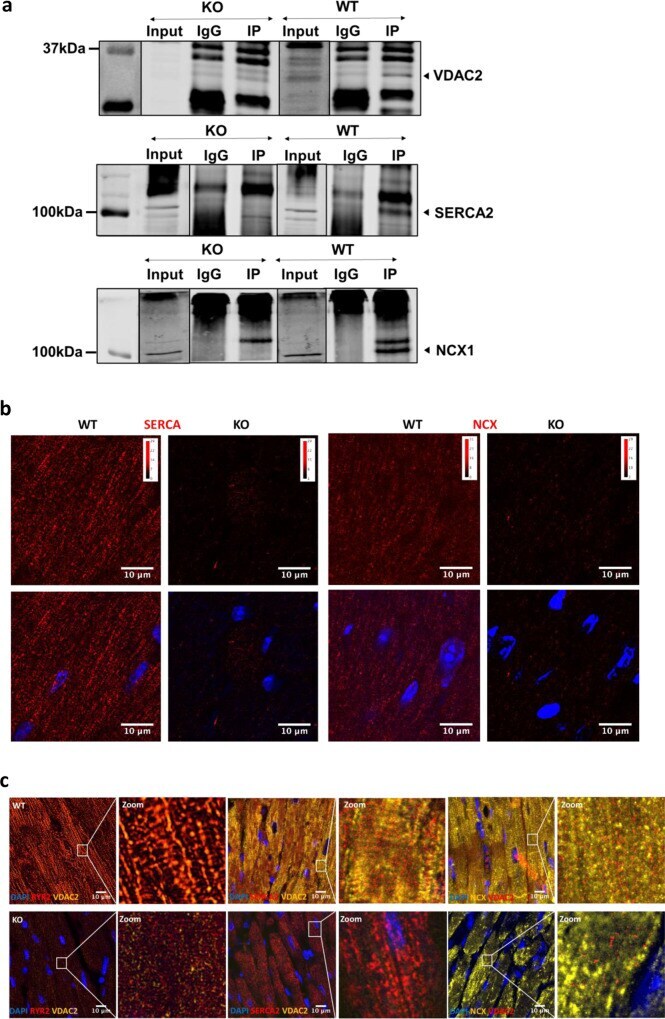
- Fig. 4 Cross-talk between mitochondria and ER/SR facilitates mitochondrial calcium cycling. a Representative co-immunoprecipitation image from a cardiac ventricular sample of 8-week-old mice ( n = 3) in WT and KO (Input--non-IP sample; IgG--control antibody; IP--VDAC2 protein pull-down); b Representative proximity ligation assay image for VDAC2-SERCA2 and VDAC2-NCX1 interaction in 8-week-old mice (scale bar, 10 mum) ( n = 3); c Representative immunofluorescence image from 16-week-old mice heart (scale bar, 10 mum) ( n = 3).