Explore
 Validate
 Learn
Learn Western blot
 ELISA
ELISA Other assay
Antibody data
- Antibody Data
- Antigen structure
- References [18]
- Comments [0]
- Validations
- Other assay [21]
Submit
Validation data
Reference
Comment
Report error
- Product number
- 33-4200 - Provider product page

- Provider
- Invitrogen Antibodies
- Product name
- SRSF3 Monoclonal Antibody (7B4 (7B4A12))
- Antibody type
- Monoclonal
- Antigen
- Synthetic peptide
- Reactivity
- Human
- Host
- Mouse
- Isotype
- IgG
- Antibody clone number
- 7B4 (7B4A12)
- Vial size
- 100 μg
- Concentration
- 0.5 mg/mL
- Storage
- -20°C
Submitted references SRSF9 Regulates Cassette Exon Splicing of Caspase-2 by Interacting with Its Downstream Exon.
The Thiazole-5-Carboxamide GPS491 Inhibits HIV-1, Adenovirus, and Coronavirus Replication by Altering RNA Processing/Accumulation.
FGF-2 promotes angiogenesis through a SRSF1/SRSF3/SRPK1-dependent axis that controls VEGFR1 splicing in endothelial cells.
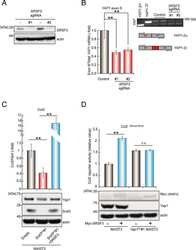
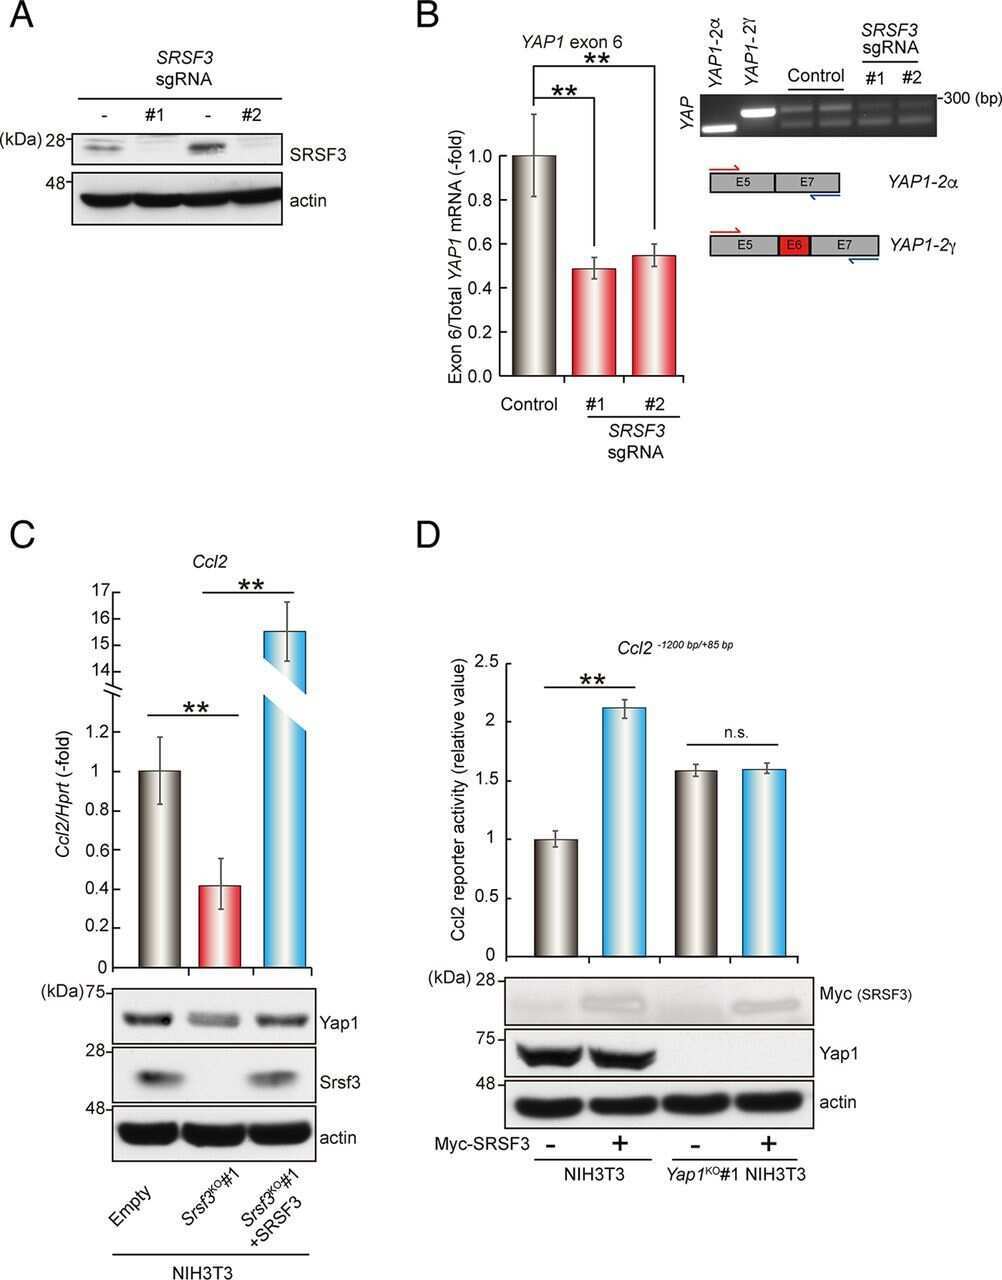
Alternative splicing reverses the cell-intrinsic and cell-extrinsic pro-oncogenic potentials of YAP1.
Splicing events in the control of genome integrity: role of SLU7 and truncated SRSF3 proteins.
The TIA1 RNA-Binding Protein Family Regulates EIF2AK2-Mediated Stress Response and Cell Cycle Progression.
HnRNP L is important for the expression of oncogene SRSF3 and oncogenic potential of oral squamous cell carcinoma cells.
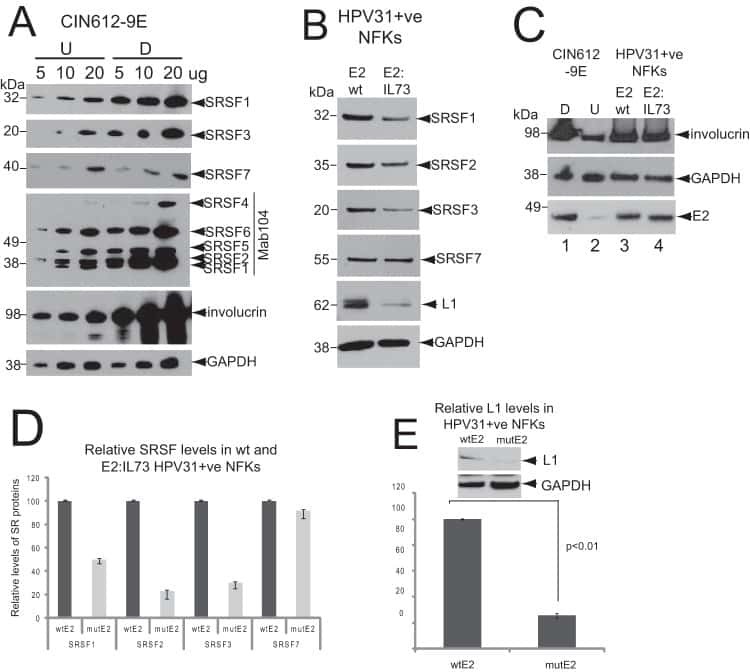
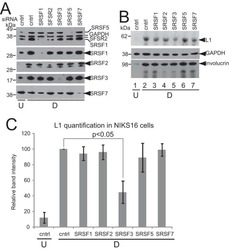
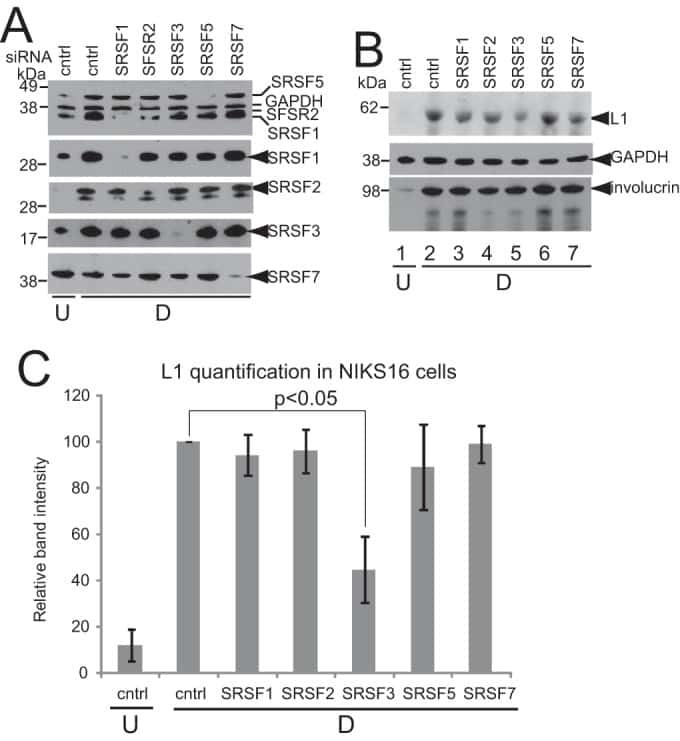
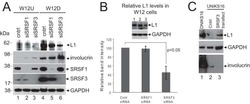
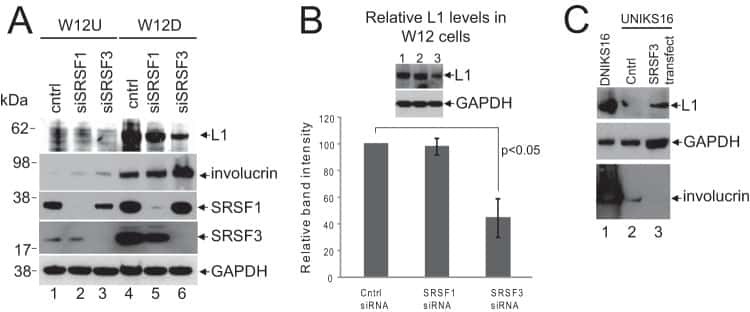
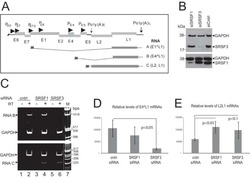
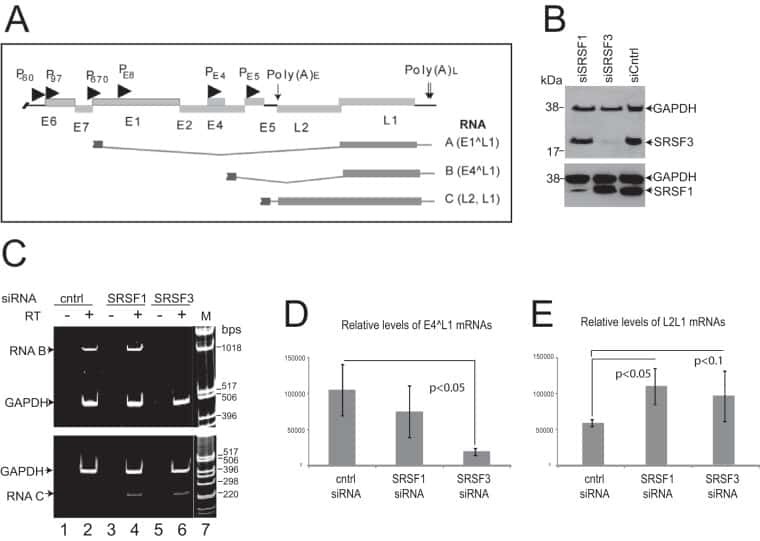
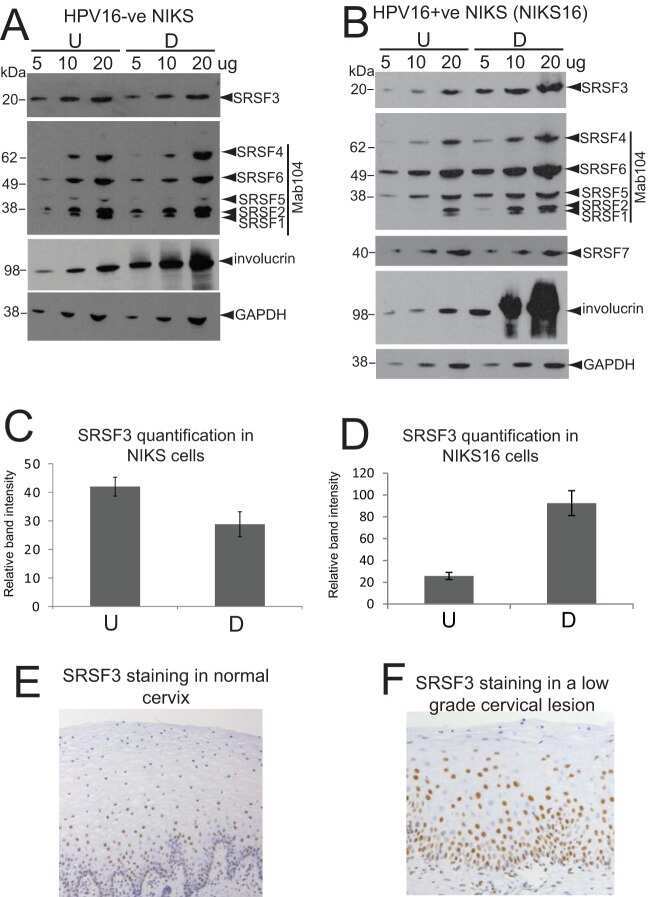
Human Papillomavirus E2 Regulates SRSF3 (SRp20) To Promote Capsid Protein Expression in Infected Differentiated Keratinocytes.
SRSF3 represses the expression of PDCD4 protein by coordinated regulation of alternative splicing, export and translation.
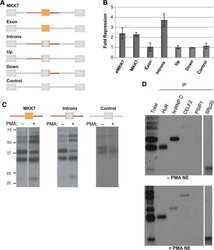
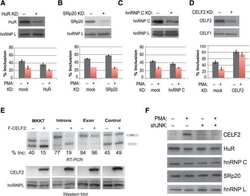
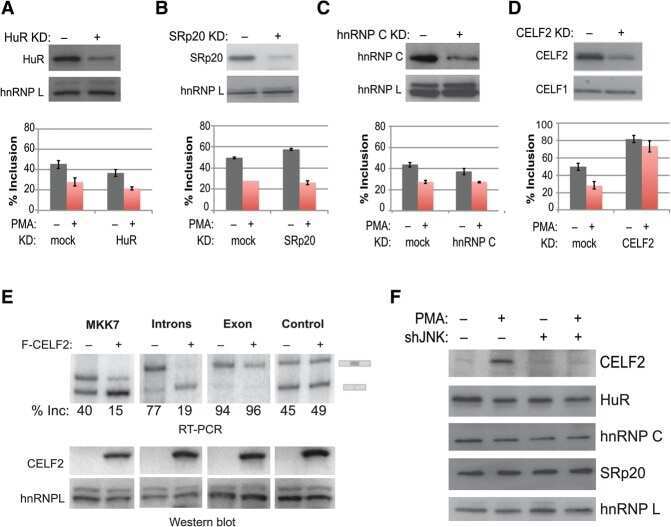
Widespread JNK-dependent alternative splicing induces a positive feedback loop through CELF2-mediated regulation of MKK7 during T-cell activation.
Splicing factor transformer-2β (Tra2β) regulates the expression of regulator of G protein signaling 4 (RGS4) gene and is induced by morphine.
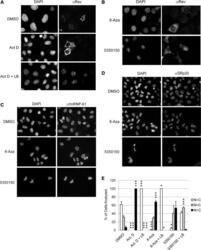
Characterization of novel inhibitors of HIV-1 replication that function via alteration of viral RNA processing and rev function.
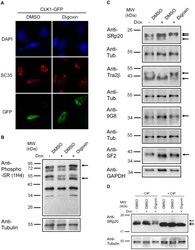
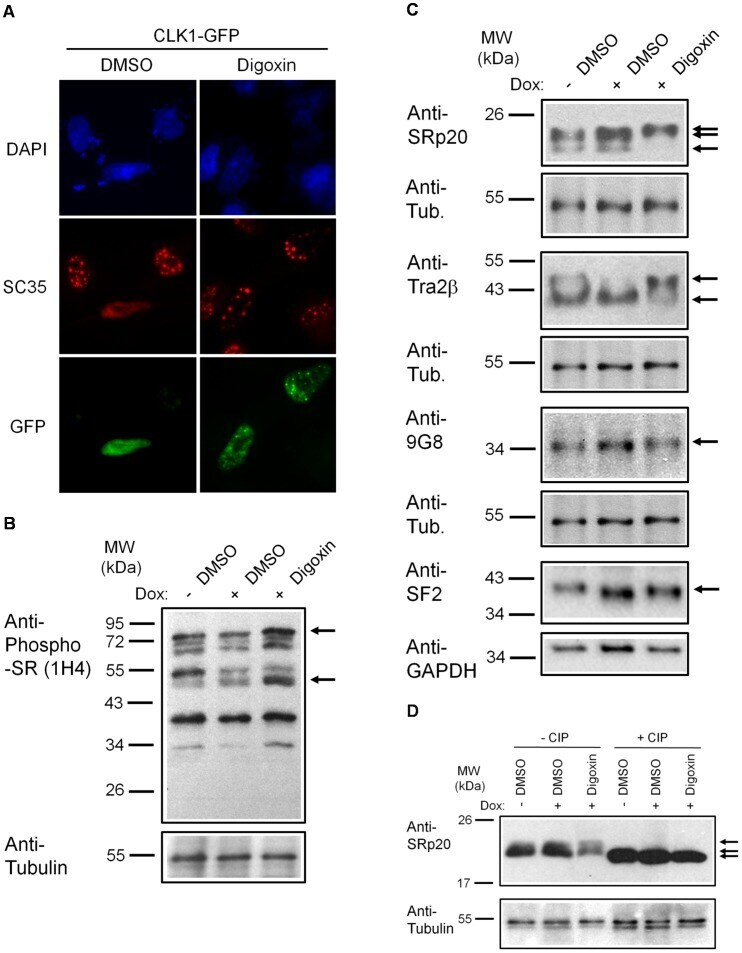
Digoxin suppresses HIV-1 replication by altering viral RNA processing.
The cardiotonic steroid digitoxin regulates alternative splicing through depletion of the splicing factors SRSF3 and TRA2B.
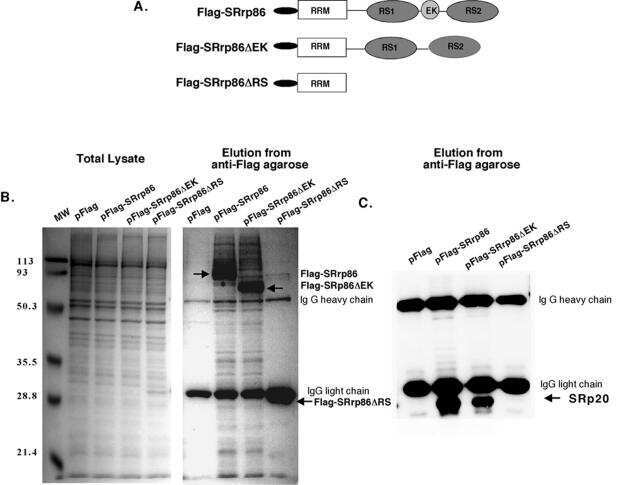
Regulation of alternative splicing by SRrp86 and its interacting proteins.
Regulation of alternative splicing by SRrp86 and its interacting proteins.
SR splicing factors serve as adapter proteins for TAP-dependent mRNA export.
ICP27 interacts with SRPK1 to mediate HSV splicing inhibition by altering SR protein phosphorylation.
Ha J, Jang H, Choi N, Oh J, Min C, Pradella D, Jung DW, Williams DR, Park D, Ghigna C, Zheng X, Shen H
Cells 2021 Mar 19;10(3)
Cells 2021 Mar 19;10(3)
The Thiazole-5-Carboxamide GPS491 Inhibits HIV-1, Adenovirus, and Coronavirus Replication by Altering RNA Processing/Accumulation.
Dahal S, Cheng R, Cheung PK, Been T, Malty R, Geng M, Manianis S, Shkreta L, Jahanshahi S, Toutant J, Chan R, Park S, Brockman MA, Babu M, Mubareka S, Mossman K, Banerjee A, Gray-Owen S, Brown M, Houry WA, Chabot B, Grierson D, Cochrane A
Viruses 2021 Dec 30;14(1)
Viruses 2021 Dec 30;14(1)
FGF-2 promotes angiogenesis through a SRSF1/SRSF3/SRPK1-dependent axis that controls VEGFR1 splicing in endothelial cells.
Jia T, Jacquet T, Dalonneau F, Coudert P, Vaganay E, Exbrayat-Héritier C, Vollaire J, Josserand V, Ruggiero F, Coll JL, Eymin B
BMC biology 2021 Aug 25;19(1):173
BMC biology 2021 Aug 25;19(1):173
Alternative splicing reverses the cell-intrinsic and cell-extrinsic pro-oncogenic potentials of YAP1.
Ben C, Wu X, Takahashi-Kanemitsu A, Knight CT, Hayashi T, Hatakeyama M
The Journal of biological chemistry 2020 Oct 9;295(41):13965-13980
The Journal of biological chemistry 2020 Oct 9;295(41):13965-13980
Splicing events in the control of genome integrity: role of SLU7 and truncated SRSF3 proteins.
Jiménez M, Urtasun R, Elizalde M, Azkona M, Latasa MU, Uriarte I, Arechederra M, Alignani D, Bárcena-Varela M, Álvarez-Sola G, Colyn L, Santamaría E, Sangro B, Rodriguez-Ortigosa C, Fernández-Barrena MG, Ávila MA, Berasain C
Nucleic acids research 2019 Apr 23;47(7):3450-3466
Nucleic acids research 2019 Apr 23;47(7):3450-3466
The TIA1 RNA-Binding Protein Family Regulates EIF2AK2-Mediated Stress Response and Cell Cycle Progression.
Meyer C, Garzia A, Mazzola M, Gerstberger S, Molina H, Tuschl T
Molecular cell 2018 Feb 15;69(4):622-635.e6
Molecular cell 2018 Feb 15;69(4):622-635.e6
HnRNP L is important for the expression of oncogene SRSF3 and oncogenic potential of oral squamous cell carcinoma cells.
Jia R, Zhang S, Liu M, Zhang Y, Liu Y, Fan M, Guo J
Scientific reports 2016 Nov 3;6:35976
Scientific reports 2016 Nov 3;6:35976
Human Papillomavirus E2 Regulates SRSF3 (SRp20) To Promote Capsid Protein Expression in Infected Differentiated Keratinocytes.
Klymenko T, Hernandez-Lopez H, MacDonald AI, Bodily JM, Graham SV
Journal of virology 2016 May 15;90(10):5047-58
Journal of virology 2016 May 15;90(10):5047-58
SRSF3 represses the expression of PDCD4 protein by coordinated regulation of alternative splicing, export and translation.
Park SK, Jeong S
Biochemical and biophysical research communications 2016 Feb 5;470(2):431-438
Biochemical and biophysical research communications 2016 Feb 5;470(2):431-438
Widespread JNK-dependent alternative splicing induces a positive feedback loop through CELF2-mediated regulation of MKK7 during T-cell activation.
Martinez NM, Agosto L, Qiu J, Mallory MJ, Gazzara MR, Barash Y, Fu XD, Lynch KW
Genes & development 2015 Oct 1;29(19):2054-66
Genes & development 2015 Oct 1;29(19):2054-66
Splicing factor transformer-2β (Tra2β) regulates the expression of regulator of G protein signaling 4 (RGS4) gene and is induced by morphine.
Li SJ, Li Y, Cui SC, Qi Y, Zhao JJ, Liu XY, Xu P, Chen XH
PloS one 2013;8(8):e72220
PloS one 2013;8(8):e72220
Characterization of novel inhibitors of HIV-1 replication that function via alteration of viral RNA processing and rev function.
Wong RW, Balachandran A, Haaland M, Stoilov P, Cochrane A
Nucleic acids research 2013 Nov;41(20):9471-83
Nucleic acids research 2013 Nov;41(20):9471-83
Digoxin suppresses HIV-1 replication by altering viral RNA processing.
Wong RW, Balachandran A, Ostrowski MA, Cochrane A
PLoS pathogens 2013 Mar;9(3):e1003241
PLoS pathogens 2013 Mar;9(3):e1003241
The cardiotonic steroid digitoxin regulates alternative splicing through depletion of the splicing factors SRSF3 and TRA2B.
Anderson ES, Lin CH, Xiao X, Stoilov P, Burge CB, Black DL
RNA (New York, N.Y.) 2012 May;18(5):1041-9
RNA (New York, N.Y.) 2012 May;18(5):1041-9
Regulation of alternative splicing by SRrp86 and its interacting proteins.
Li J, Hawkins IC, Harvey CD, Jennings JL, Link AJ, Patton JG
Molecular and cellular biology 2003 Nov;23(21):7437-47
Molecular and cellular biology 2003 Nov;23(21):7437-47
Regulation of alternative splicing by SRrp86 and its interacting proteins.
Li J, Hawkins IC, Harvey CD, Jennings JL, Link AJ, Patton JG
Molecular and cellular biology 2003 Nov;23(21):7437-47
Molecular and cellular biology 2003 Nov;23(21):7437-47
SR splicing factors serve as adapter proteins for TAP-dependent mRNA export.
Huang Y, Gattoni R, Stévenin J, Steitz JA
Molecular cell 2003 Mar;11(3):837-43
Molecular cell 2003 Mar;11(3):837-43
ICP27 interacts with SRPK1 to mediate HSV splicing inhibition by altering SR protein phosphorylation.
Sciabica KS, Dai QJ, Sandri-Goldin RM
The EMBO journal 2003 Apr 1;22(7):1608-19
The EMBO journal 2003 Apr 1;22(7):1608-19
No comments: Submit comment
Supportive validation
- Submitted by
- Invitrogen Antibodies (provider)
- Main image
- Experimental details
- NULL
- Submitted by
- Invitrogen Antibodies (provider)
- Main image
- Experimental details
- NULL
- Submitted by
- Invitrogen Antibodies (provider)
- Main image
- Experimental details
- NULL
- Submitted by
- Invitrogen Antibodies (provider)
- Main image
- Experimental details
- NULL
- Submitted by
- Invitrogen Antibodies (provider)
- Main image

- Experimental details
- NULL
- Submitted by
- Invitrogen Antibodies (provider)
- Main image
- Experimental details
- NULL
- Submitted by
- Invitrogen Antibodies (provider)
- Main image
- Experimental details
- NULL
- Submitted by
- Invitrogen Antibodies (provider)
- Main image
- Experimental details
- NULL
- Submitted by
- Invitrogen Antibodies (provider)
- Main image

- Experimental details
- NULL
- Submitted by
- Invitrogen Antibodies (provider)
- Main image
- Experimental details
- Figure 6 Digoxin alters the activity of SR protein kinases and induces modification of a subset of SR proteins. (A) To assess the effect of digoxin on CLK kinase function, HeLa rtTA-HIV-Delta Mls cells were transfected with vectors expressing GFP-tagged CLK1. Twenty-four hours post-transfection, cells were treated with DMSO or 100 nM digoxin. After 24 h of treatment, cells were fixed, stained for SC35/SRSF2 nuclear speckles (Texas Red), and nuclei stained with DAPI. Images are representative of the localization patterns observed from >=5 independent experiments. Magnification 630x. (B, C, D) Western blot analysis of the effect of digoxin treatment on SR proteins. Lysates were harvested from HeLa rtTA-HIV-Delta Mls cells treated with 100 nM digoxin or DMSO and were induced with Dox (+) or left uninduced (-) as described in Fig. 1 . Immunoblots were probed by specific antibody for (B) phospho-SR proteins (1H4) or (C) SRp20, Tra2beta1, 9G8, or SF2/ASF (SF2). (D) Cell lysates from above were dephosphorylated by treatment with (+) and without (-) calf intestinal alkaline phosphatase (CIP), then immunoblotted with a SRp20-specific antibody. Arrows on the right indicate the protein specie(s) detected and their modified/unmodified isoform(s). Anti-tubulin (Anti-Tub.) blots for each experiment served as an internal loading control for the relative amount of protein lysate per lane. Immunoblots are representative of >=4 independent trials.
- Submitted by
- Invitrogen Antibodies (provider)
- Main image
- Experimental details
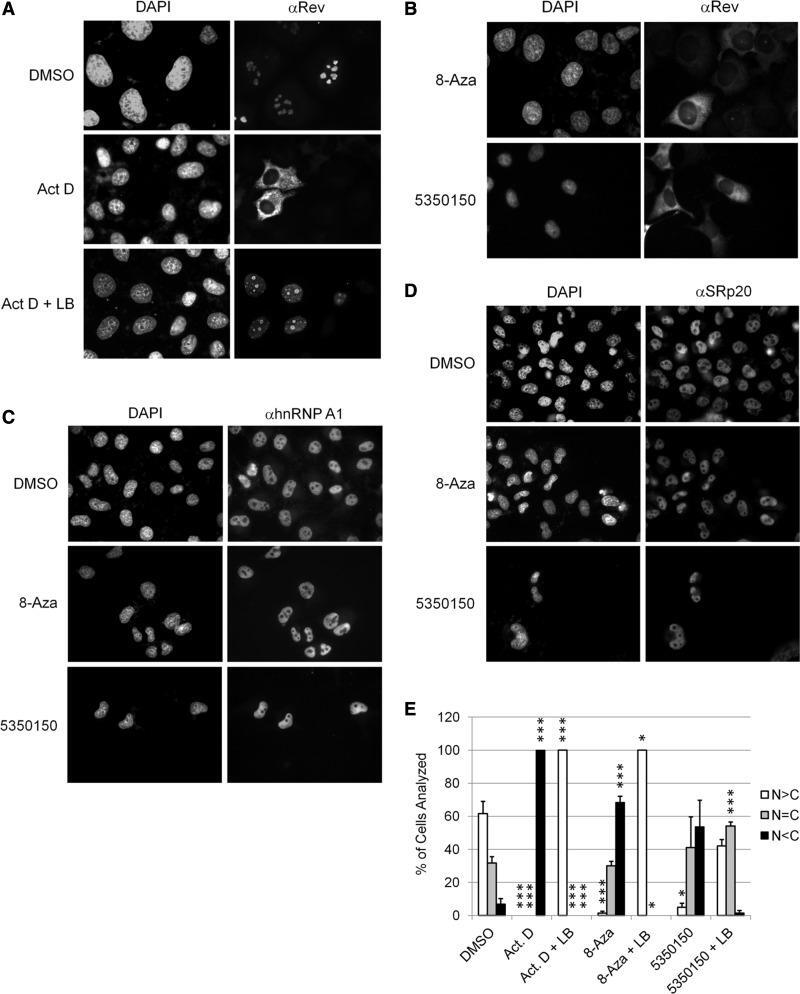
- Figure 5. Both 8-Aza and 5350150 alter the subcellular distribution of HIV-1 Rev but not nuclear proteins of the host cell. HeLa Rev cells stably expressing HIV-1 Rev were ( A ) control treated (DMSO) or incubated with 4 ug/ml of Act. D with (+) or without LB for 2 h or ( B ) treated with compounds overnight with 45 uM 8-Aza or 2 uM 5350150 as described in Figure 1 . After fixation and permeabilization, localization of Rev was detected by immunofluorescence using a rabbit anti-Rev antibody followed by either a FITC- or Cy5-conjugated anti-rabbit IgG antibody. In parallel, cells were stained with antibodies for ( C ) hnRNP A1 or ( D ) SRp20 as detailed in 'Materials and Methods' section. Shown are representative images (gray scale) from three independent trials. Cells were stained with DAPI to allow imaging of the nuclei. Magnification 400x. ( E ) To determine whether 8-Aza or 5350150 were altering Rev localization by affecting Rev import, HeLa Rev cells were treated with DMSO, 2 h with Act. D (as a control that induces Rev cytoplasmic accumulation) or overnight with either 45 uM 8-Aza or 2 uM 5350150, and then left untreated or treated with LB (+LB) for 2 h before fixation. Rev distribution was assessed in individual cells by immunofluorescent staining using a rabbit anti-Rev antibody as detailed in 'Materials and Methods' section. Individual cells were scored as having predominately nuclear (N > C, white), whole cell (N = C, grey) or predominately cytopla
- Submitted by
- Invitrogen Antibodies (provider)
- Main image
- Experimental details
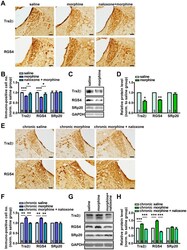
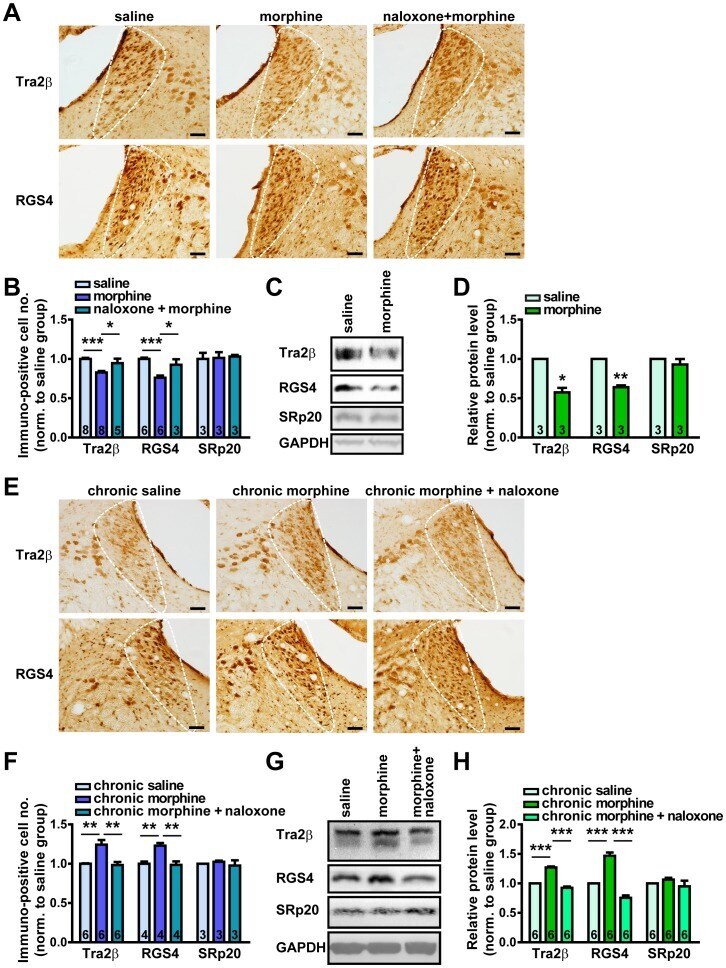
- Figure 6 Regulation of RGS4, Tra2beta and SRp20 levels in rat LC after acute and chronic morphine administration. (A) Representative IHC images of Tra2beta and RGS4 in rat LC slices after acute saline, morphine and naloxone+morphine administration. Scale bars: 80 um. (B) Quantitative analysis of Tra2beta (acute saline, 1.00+-0.01; acute morphine, 0.83+-0.02; naloxone+morphine, 0.95+-0.06), RGS4 (acute saline, 1.00+-0.02; acute morphine, 0.76+-0.03; naloxone+morphine, 0.93+-0.07) and SRp20 (acute saline, 1.00+-0.08; acute morphine, 1.01+-0.07; naloxone+morphine, 1.03+-0.02) positive cell number per cubic millimeter in rat LC slices. (C-D) Representative immunoblot images (C) and data statistics (D) showing the relative protein level (%GAPDH) of Tra2beta, RGS4 and SRp20 in rat LC after acute morphine administration, normalized to that of acute saline group (Tra2beta, 0.57+-0.06; RGS4, 0.64+-0.02; SRp20, 0.93+-0.07; * p
- Submitted by
- Invitrogen Antibodies (provider)
- Main image
- Experimental details
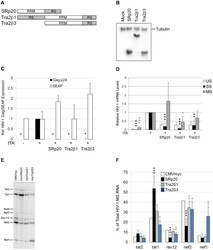
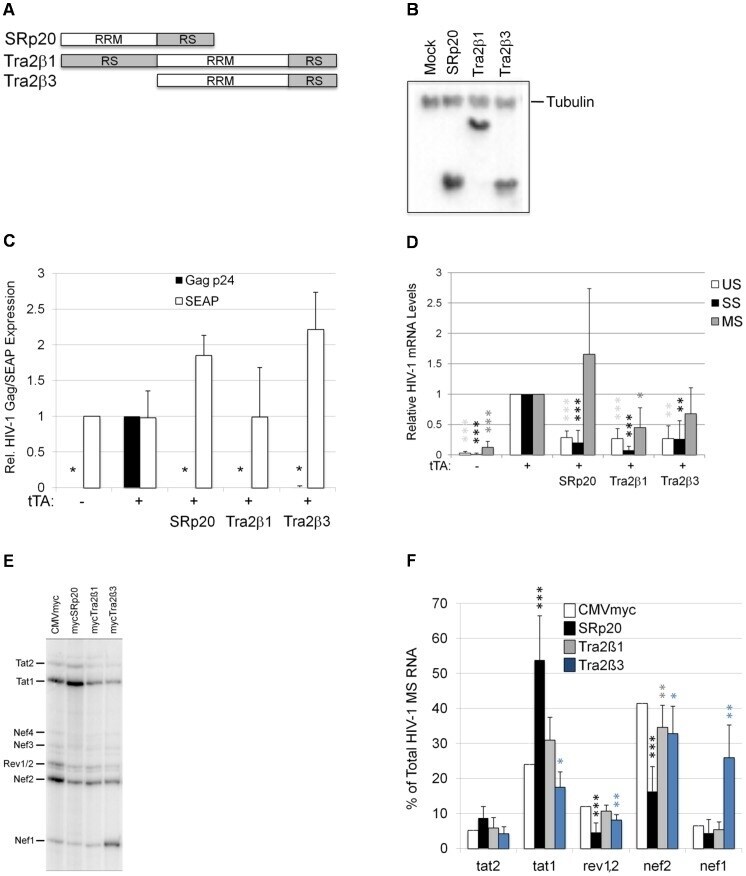
- Figure 7 Overexpression of SRp20, Tra2beta1, or Tra2beta3 suppress HIV-1 expression. (A) Diagram of SRp20, Tra2beta1, and Tra2beta3 protein domain structure. (B) Cells were transfected with the vectors CMVmyc (mock), CMVmyc SRp20 (SRp20), CMVmyc Tra2beta1 (Tra2beta1), or CMVmyc Tra2beta3 (Tra2beta3). Forty-eight hours post-transfection, cells were harvested, lysed in RIPA buffer, and proteins analyzed by western blot with anti-myc antibody followed by anti-tubulin (Tubulin) antibody to indicate loading. (C) HeLa rtTA-HIV-Delta Mls cells were transfected with (+) (or without, -) CMVtTApA (tTA) to activate the endogenous HIV-1 provirus along with CMV PLAP and either CMVmyc, CMVmyc SRp20, CMVmyc Tra2beta1, or CMVmyc Tra2beta3. Forty-eight hours post transfection, cell media was harvested and assayed by p24 CA ELISA for expression of HIV-1 Gag (black) and production of SEAP (white). Results are averaged from 6 independent assays, error bars are SEM, and asterisks indicate values deemed significant from CMVmyc (+tTA) as detailed in "" Materials & Methods "". (D) In parallel, total RNA was extracted from transfected cells and the abundance of individual viral RNA (unspliced, US; singly spliced, SS; multiply spliced, MS) were determined by qRT-PCR. Shown are results averaged from 6 independent assays, error bars are SEM, and asterisks indicate significance as noted above. (E, F) MS HIV-1 RNAs from transfected cells were amplified by RT-PCR as described in Fig. 4 . Amplicons were fra
- Submitted by
- Invitrogen Antibodies (provider)
- Main image

- Experimental details
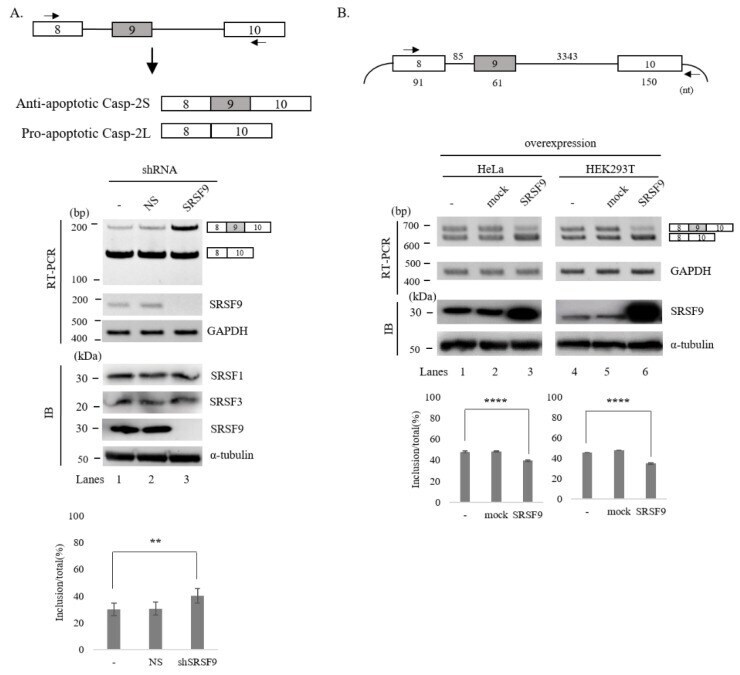
- Figure 1 SRSF9 regulates AS of Caspase-2 pre-mRNA. ( A )-(Upper) Schematic AS representation of endogenous Caspase-2 pre-mRNA. Primers used in RT-PCR are shown with arrows. (Middle) RT-PCR analysis of endogenous Caspase-2 pre-mRNA from untreated, ns- and SRSF9 shRNA treated cells. GAPDH was used as a loading control. Results of immunoblotting with anti-SRSF9 in these cells are shown, with alpha-tubulin, SRSF1 and SRSF3 as a controls. (Lower) Statistical differences of RT-PCR with p values are shown, ****, p < 0.0001 and **, p < 0.01. ( B )-(Upper) Schematic representation of Caspase-2 minigene. Exons are shown with boxes and introns are shown with lines. Lengths of each part are shown. Primers used in RT-PCR analysis are shown with arrows. (Middle) RT-PCR analysis of Caspase-2 minigene from untreated, empty vector treated and SRSF9 expression plasmid treated HeLa and HEK293T cells. GAPDH was used as a loading control. Immunoblotting with anti-SRSF9 antibody is shown, with alpha-tubulin as a control. (Lower) Statistical differences of RT-PCR analysis are shown, ****, p < 0.0001; and **, p < 0.01.
- Submitted by
- Invitrogen Antibodies (provider)
- Main image
- Experimental details
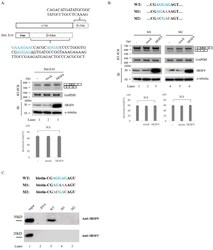
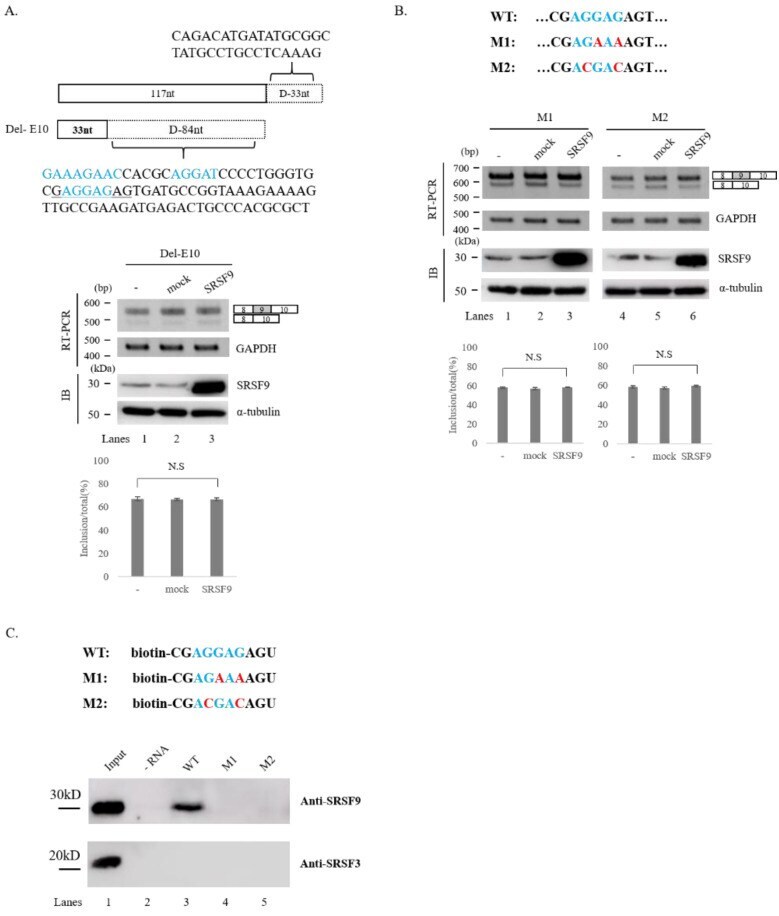
- Figure 3 SRSF9 targets downstream exon to regulate AS of Caspase-2. ( A )-(Upper) Schematic representation of D-10 minigene. Deleted sequences in the minigene are shown. D-10 was produced based on the deletion mutant of D9-2. (Middle) RT-PCR analysis of D-10 minigene in untreated, empty vector treated and SRSF9 expression plasmids treated HeLa cells. (Lower) Statistical differences are shown. ( B )-(Upper) Sequences of wild type, M1 and M2 minigenes are shown. (Middle) RT-PCR analysis of M1 and M2 minigenes untreated, empty vector treated and SRSF9 expression plasmids treated HeLa cells are shown. (Lower) Statistical differences of RT-PCR analysis are shown. ( C )-(Upper) Sequences of biotin-labeled oligonucleotides (wild type, M1 and M2) are shown. (Lower) Results of RNA-pulldown and immunoblotting for wild type, M1 and M2 with anti-SRSF9 and anti-SRSF3 antibodies are shown.
- Submitted by
- Invitrogen Antibodies (provider)
- Main image
- Experimental details
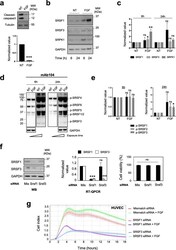
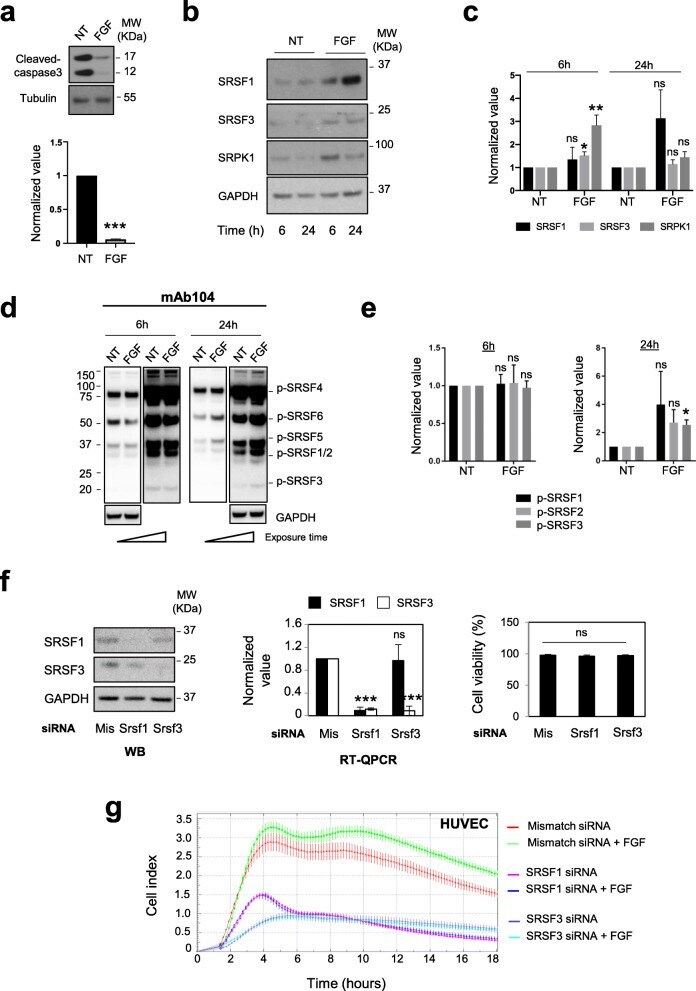
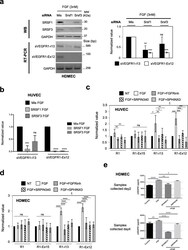
- Fig. 2 FGF-2-mediated HUVEC survival requires SR proteins accumulation and phosphorylation. a HUVEC were plated for 24 h in full medium, then cultured for 6 additional hours in EBM-2 basal medium supplemented (FGF) or not (-FGF/NT) with 3nM FGF-2 as indicated. Upper panel: immunoblot for cleaved-caspase 3. Tubulin was used as a loading control. Lower panel: semi-quantification of cleaved-caspase 3 signal relative to tubulin signals versus the values of the NT group by ImageJ ( n =3, unpaired t test, *** p
- Submitted by
- Invitrogen Antibodies (provider)
- Main image
- Experimental details
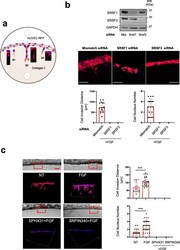
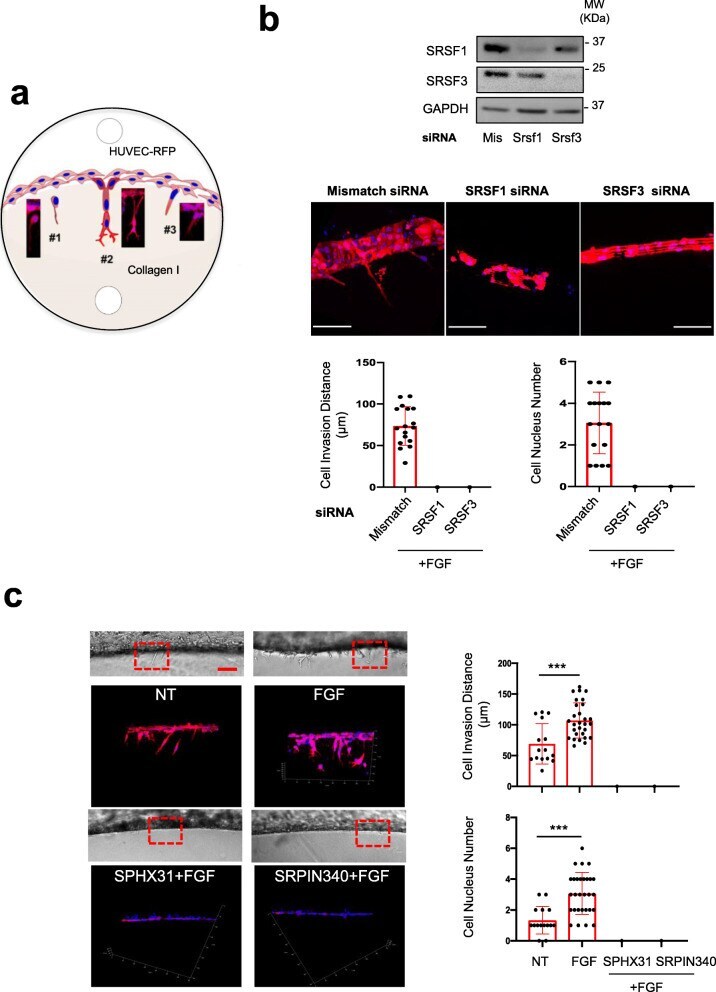
- Fig. 4 SRSF1/SRSF3 knockdown and SRPK1 inhibitors abrogate HUVEC-RFP invasion and sprouting in 3D collagen matrix. a Schematic representation of 3 different types of endothelial cell HUVEC-RFP behavior. #1: aborted endothelial cell sprouting, endothelial cells invade the collagen matrix without being followed by stalk cells; #2: capillary formation, complete process of endothelial cell invasion and sprouting. Filopodia projecting from the tip cells are observed; #3 early step of endothelial cell responses. For quantification, cell responses were scored according to these 3 types of cell behavior. b HUVEC-RFP were transfected for 48 h with control siRNA (mismatch) or a 50:50 mixture of two different SRSF1 (SRSF1) or SRSF3 (SRSF3) siRNAs before being analyzed in 3D invasion assay. Upper panel: immunoblots showing the efficient knockdown of SRSF1 or SRSF3 in HUVEC-RFP. GAPDH was used as a loading control. Lower panels : mosaic of confocal images covering around 300 mum of matrices border for different HUVEC-RFP post-transfection with indicated siRNA. HUVEC-RFP cells are in red and nuclei in blue. Scale bar = 100mum. Bar charts represent the quantifications of the invading distance of HUVEC-RFP within the 3D collagen matrices and the number of invading cells (nuclei) per 300 mum of gel border. Each black dot indicates one invading sprout. c HUVEC-RFP cells were treated or not (NT) with 3nM FGF-2 for 24 h in the presence or absence of 5muM SPHINX31 or 10muM SRPIN340 before perform
- Submitted by
- Invitrogen Antibodies (provider)
- Main image

- Experimental details
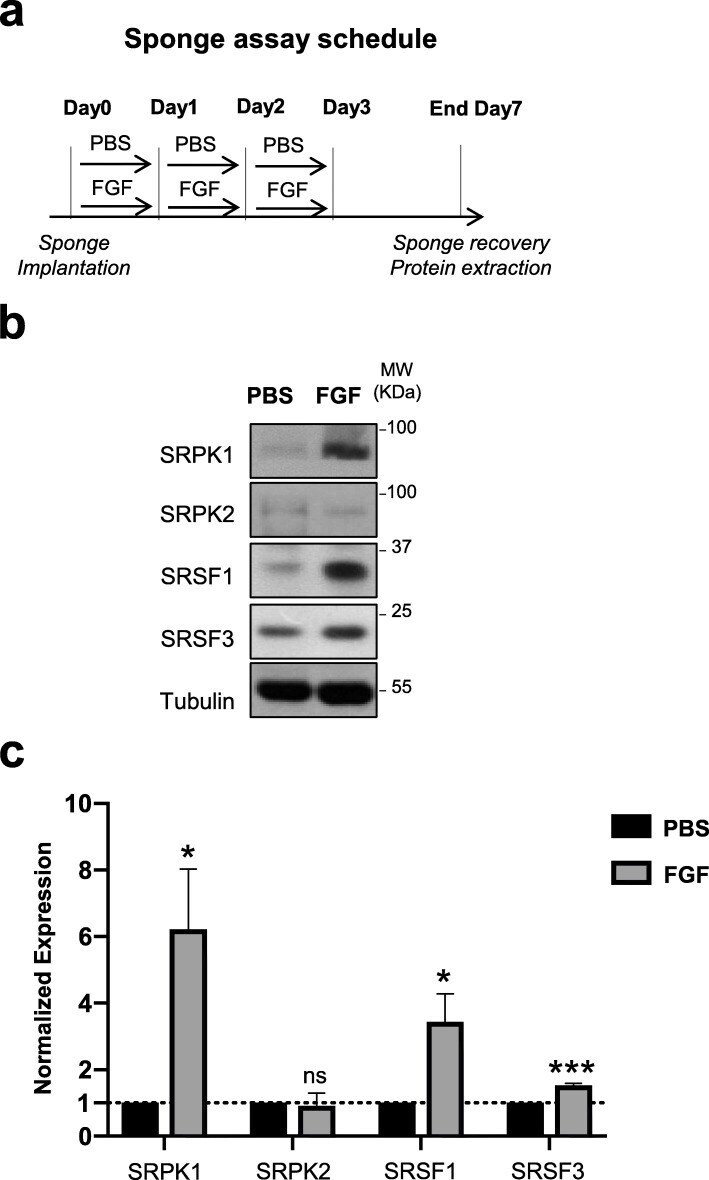
- Fig. 5 Endothelial cells accumulate SRSF1/3 and SRPK1 proteins upon FGF-2 treatment in an in vivo sponge assay. a Cellulose sponges loaded with FGF-2 or with PBS were engrafted under the skin of mice ( n =6/group). As indicated in the graph, cellulose sponges were repeatedly injected. After 7 days, the sponges were collected and lysed for total protein extraction. b Representative immunoblots of SRPK1, SRPK2, SRSF1, and SRSF3 proteins from sponges treated with PBS or FGF-2. Tubulin was used as a loading control. c Semi-quantification using ImageJ software of FGF-2 effects on the indicated proteins relative to tubulin signals. The ratio obtained in PBS condition was arbitrarily assessed the value 1. Graphs represent mean values +- SD of 3 independent protein extracts ( t test, * p
- Submitted by
- Invitrogen Antibodies (provider)
- Main image
- Experimental details
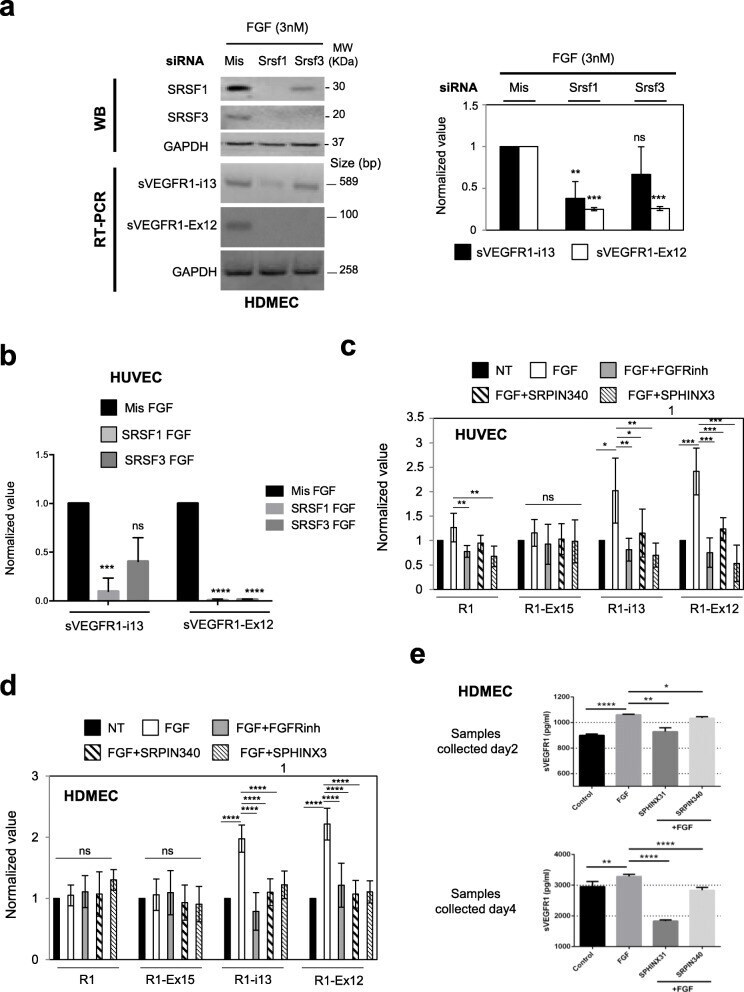
- Fig. 8 FGF-2 mediates accumulation of sVEGFR1 splice variants through a SRSF1/SRSF3/SRPK1-dependent axis. a HDMEC were transfected with control siRNA (mis) or specific SRSF1 (Srsf1) or SRSF3 (Srsf3) siRNA and treated with 3nM FGF-2 for 72 h. Left panel: representative immunoblots of SRSF1 or SRSF3 protein (WB) or PCR analyses (RT-PCR) of sVEGFR1-i13 and sVEGFR1-ex12 mRNA levels. GAPDH was used as a loading/internal control. Right panel: PCR data semi-quantification by ImageJ software. The sVEGFR1/GAPDH ratio obtained in control condition was arbitrarily assigned the value 1. Data are the mean +- SD of 3 and 4 biological replicates for sVEGFR1-ex12 and sVEGFR1-i13, respectively (unpaired t test, ** p
- Submitted by
- Invitrogen Antibodies (provider)
- Main image
- Experimental details
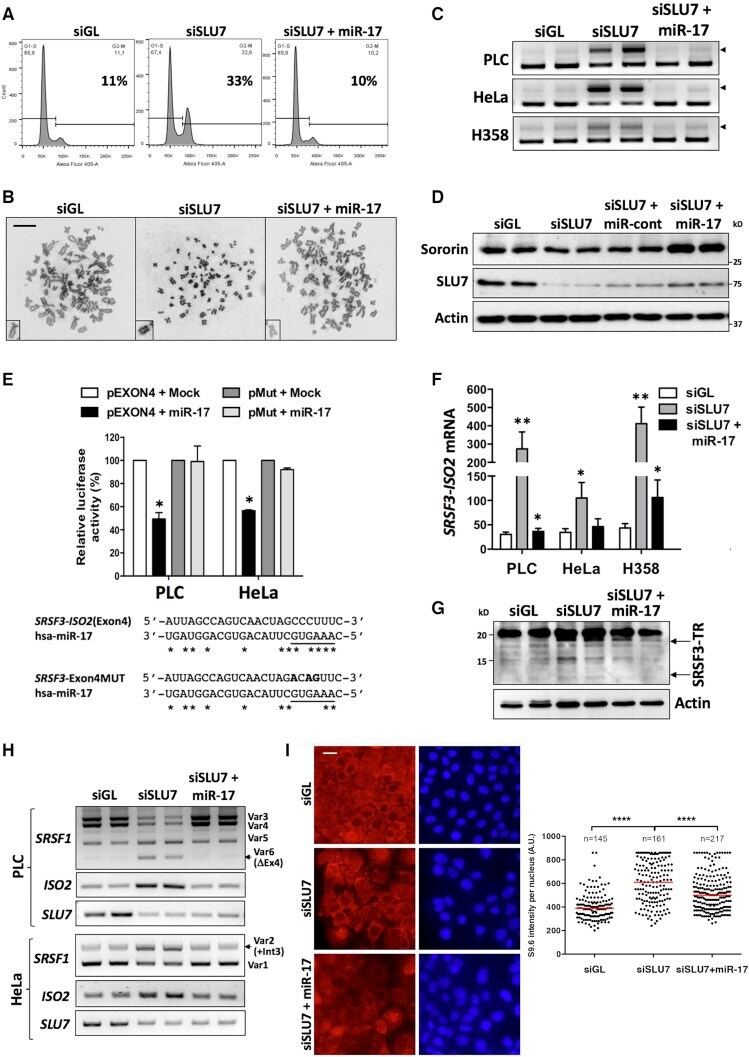
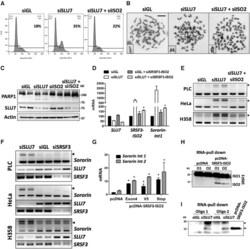
- Figure 6. SLU7 knockdown-induced SRSF3-TR impair cell-cycle progression and SCC, promote apoptosis and modulate sororin splicing. ( A - C ) Cell-cycle arrest A, loss of SCC as detected by chromosome spreads B (scale bar: 10 mum) and apoptosis as detected by the cleavage of PARP C induced in PLC/PRF/5 cells 48 h after SLU7 knockdown were prevented by co-transfection with siISO2. ( D and E ) The aberrant incorporation of intron 1 in sororin transcripts after SLU7 knockdown in PLC/PRF/5 cells, detected by real time PCR1 D or gel electrophoresis (PCR3) E was prevented after co-transfection with siISO2. The expression of SLU7 and SRSF3-ISO2 is also shown in D as control. ( F ) PCR detection (PCR3 in Figure 2D ) of the aberrant splicing of sororin (arrowheads) in PLC/PRF/5, HeLa and H358 cells 48 h after SLU7 (siSLU7) or SRSF3 (siSRSF3) knockdown. The expression of SLU7 and SRSF3 is shown as control. ( G ) PLC/PRF/5 cells were transfected with a control plasmid (pcDNA) or three constructs (Exon4, V5 and Stop) that overexpress SRSF3-ISO2 mRNA (see Supplementary Figure S4E and F ). The incorporation of intron 1 and intron 2 into the mRNA of sororin was analyzed by real time PCR1 and PCR2 (from Figure 2D ). ( H ) Western blot analysis of SRSF3 after RNA-pull down using two biotinylated RNA oligos (O1 and O2) from sororin intron 1 containing two putative binding motifs for SRSF3. Extracts using in pull down assays were from PLC/PRF/5 cells transfected with the

- Submitted by
- Invitrogen Antibodies (provider)
- Main image

- Experimental details
- Figure 7. miR-17 rescues cell-cycle arrest and prevents the induction of SRSF3-TR proteins upon SLU7 knockdown. ( A and B ) Cell-cycle arrest A and loss of SCC detected by chromosome spreads B (scale bar: 10 mum) induced in PLC/PRF/5 cells 48 h after SLU7 knockdown was prevented by co-transfection with miR-17. ( C ) The aberrant splicing of sororin induced in PLC/PRF/5, HeLa and H358 cells 48 h after SLU7 knockdown was also prevented by co-transfection with miR-17. ( D ) Co-transfection of miR-17 with siSLU7 recovered sororin protein levels downregulated by siSLU7 in PLC/PRF/5 cells. ( E ) SRSF3 exon 4 was cloned as 3'UTR in the pMIR-REPORT luciferase plasmid (pEXON4). The same sequence with the mutations at the miR-17 recognition motif marked in bold was also cloned (pMut) as control. PLC/PRF/5 and HeLa cells were transfected with pEXON4 or pMut plasmids and miR-17 or a control miRNA (Mock). Luciferase activity was analyzed 48 h after transfection. * P < 0.05. ( F ) The expression of SRSF3-ISO2 was measured by real time PCR in PLC/PRF/5, HeLa and H358 cells 48 h after transfection with siGL, siSLU7 or siSLU7 + miR-17. * P < 0.05, ** P < 0.01. ( G ) Western blot analysis of SRSF3 in H358 cells 48 h after transfection with siGL, siSLU7 or siSLU7 + miR-17. The truncated forms of SRSF3 are indicated by arrows. ( H ) The generation of aberrant splice variants of SRSF1 induced upon SLU7 knockdown (siSLU7) in PLC/PRF/5 and HeLa cells is prevented by co-transfection with