Explore
 Validate
 Learn
Learn Western blot
 Immunohistochemistry
Antibody data
- Antibody Data
- Antigen structure
- References [1]
- Comments [0]
- Validations
- Immunohistochemistry [1]
- Other assay [3]
Submit
Validation data
Reference
Comment
Report error
- Product number
- PA5-68911 - Provider product page

- Provider
- Invitrogen Antibodies
- Product name
- E2F7 Polyclonal Antibody
- Antibody type
- Polyclonal
- Antigen
- Synthetic peptide
- Description
- This target displays homology in the following species: Cow: 93%; Dog: 86%; Horse: 85%; Human: 86%; Mouse: 100%; Pig: 92%; Rabbit: 79%; Rat: 86%
- Reactivity
- Human, Mouse
- Host
- Rabbit
- Isotype
- IgG
- Vial size
- 100 μL
- Concentration
- 0.5 mg/mL
- Storage
- -20°C, Avoid Freeze/Thaw Cycles
Submitted references MicroRNA-302a/d inhibits the self-renewal capability and cell cycle entry of liver cancer stem cells by targeting the E2F7/AKT axis.
Ma YS, Lv ZW, Yu F, Chang ZY, Cong XL, Zhong XM, Lu GX, Zhu J, Fu D
Journal of experimental & clinical cancer research : CR 2018 Oct 16;37(1):252
Journal of experimental & clinical cancer research : CR 2018 Oct 16;37(1):252
No comments: Submit comment
Supportive validation
- Submitted by
- Invitrogen Antibodies (provider)
- Main image
- Experimental details
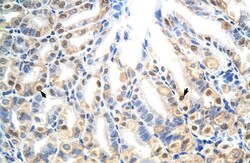
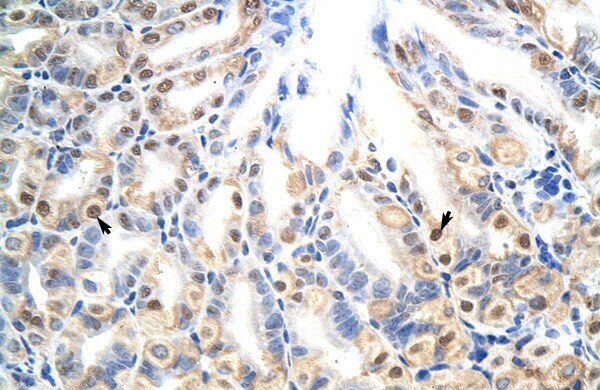
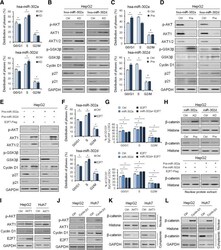
- Immunohistochemistry was performed on mouse stomach tissue using a E2F7 polyclonal antibody (Product # PA5-68911).
Supportive validation
- Submitted by
- Invitrogen Antibodies (provider)
- Main image
- Experimental details
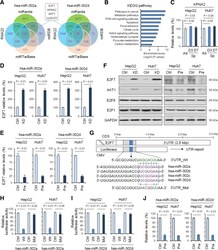
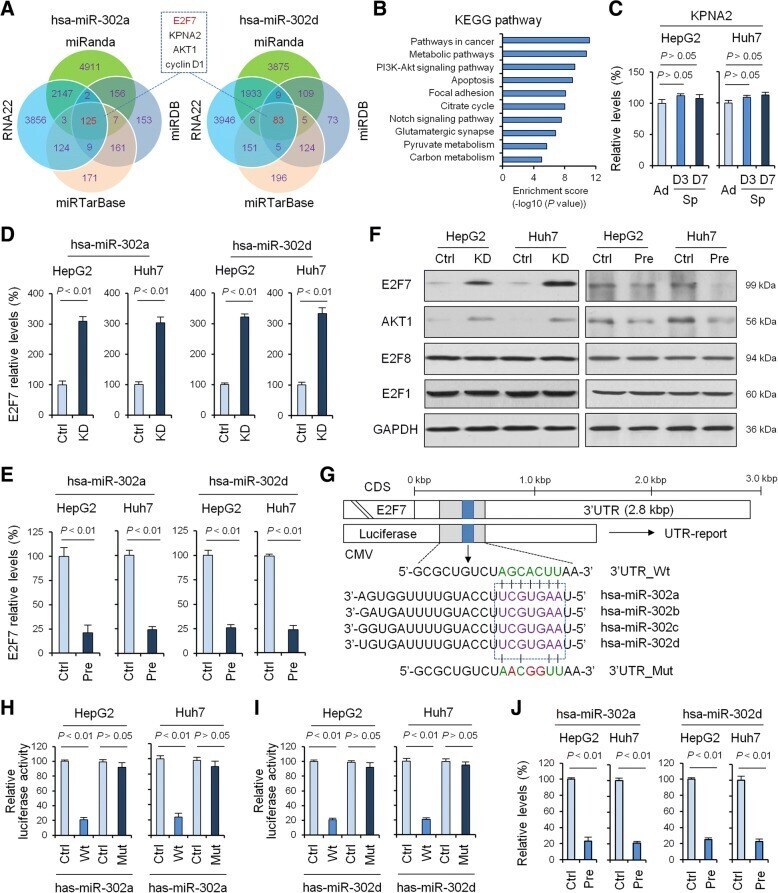
- Fig. 3 Validation of E2F7 as a direct target of miRNA-302a/d. a , miRNA-302a and miRNA-302d target prediction using four target genes prediction programs. b , KEGG analysis of 208 common predicted target genes. c , qRT-PCR to quantify KPNA2 level in adherent and tumor spheres of HepG2 and Huh7 cells after 3 days cultured in stem cell medium containing EGF and bFGF. qRT-PCR was used to measure the mRNA level of E2F7 after treatment of miRNA-302a/d knockdown ( d ) or overexpression ( e ). f , Western blotting was used to measure the protein levels of potential target genes after treatment of miRNA-302a/d knockdown or overexpression. AKT1 was used as a positive control for miRNA-302a/d target. g , A schematic diagram of the miRNA-302 family of 3 'UTR in E2F7 binding site and mutation site. Luciferase activity assay of pGL3-E2F7-3'UTR reporter co-transfected with miRNA-302a ( h ) and -302d ( i ) mimic or mutational oligonucleotides in HepG2 and Huh7 cells. j , RIP-IP assays were performed to co-IP the Ago2 complexes from HepG2 and Huh7 cells transfected with either hsa-miR-302a/d mimic or negative control mimic. Real-time PCR assays were performed on RNA samples isolated from the Ago2 co-IP fractions to measure the relative enrichment of the E2F7 mRNA. Data shown are the means +- SD of three independent experiments. Statistical analyses were performed with one-way ANOVA (** = P < 0.01, *** = P < 0.001)
- Submitted by
- Invitrogen Antibodies (provider)
- Main image
- Experimental details
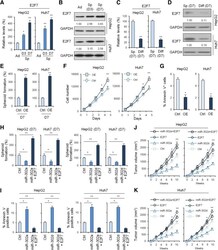
- Fig. 4 Biological role of miRNA-302a/d and E2F7 in HCC in vitro and in vivo. qRT-PCR ( a ) and Western blot ( b ) to quantify E2F7 levels in adherent and tumor spheres of HepG2 and Huh7 cells after 3 and 7 days cultured in stem cell medium containing EGF and bFGF. GAPDH was used as loading control. qRT-PCR ( c ) and Western blot ( d ) to quantify E2F7 levels in tumor spheres of HepG2 and Huh7 cells at Day 7 cultured in stem cell medium and differentiated liver cancer cells. e , Tumor sphere Assays of HepG2 and Huh7 cells before and after overexpression of E2F7. f , HepG2 and Huh7 cell counts in 96-well plate after transfection with negative control and E2F7 overexpression plasmids at the indicated day. g , HepG2 and Huh7 cell apoptosis was examined by flow cytometry analysis before and after overexpression of E2F7. Statistical analyses were performed with one-way ANOVA (*P < 0.05, **P < 0.01, and ***P < 0.001 vs. normal). h , Tumor sphere assays of HepG2 and Huh7 cells before and after overexpression of miRNA-302a/d and/or E2F7. i , HepG2 and Huh7 cell apoptosis was examined by flow cytometry analysis before and after overexpression of miRNA-302a/d and/or E2F7. The subcutaneous tumor capacity of HepG2 and Huh7 cells before and after overexpression of miRNA-302a ( j ) and miRNA-302d ( k ) and/or E2F7 was detected. Statistical analyses were performed with one-way ANOVA (*P < 0.05, **P < 0.01, and ***P < 0.001 vs. normal)
- Submitted by
- Invitrogen Antibodies (provider)
- Main image
- Experimental details
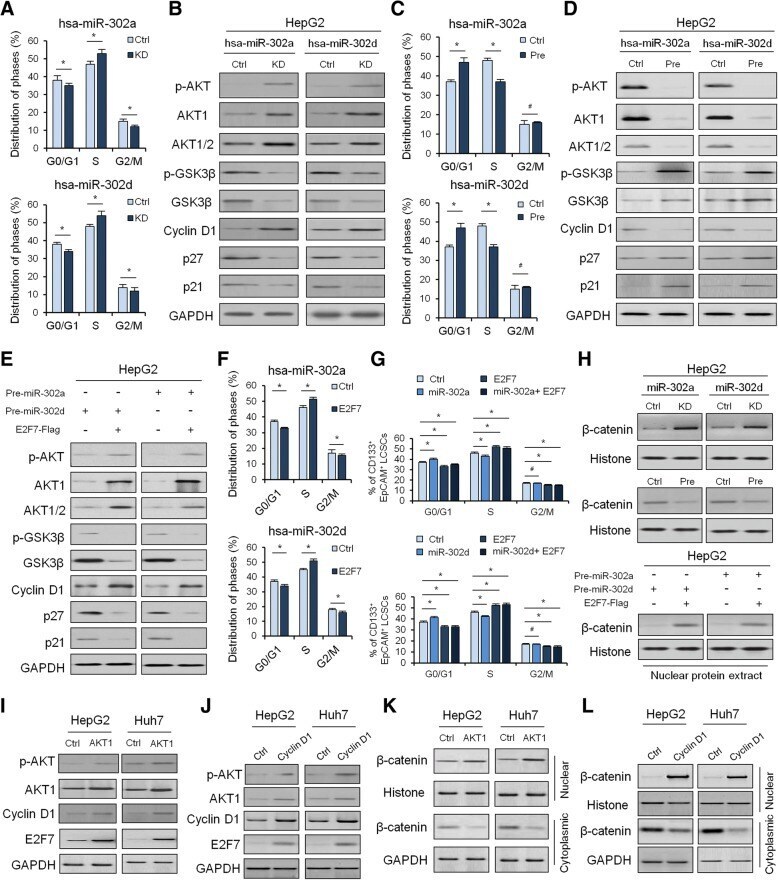
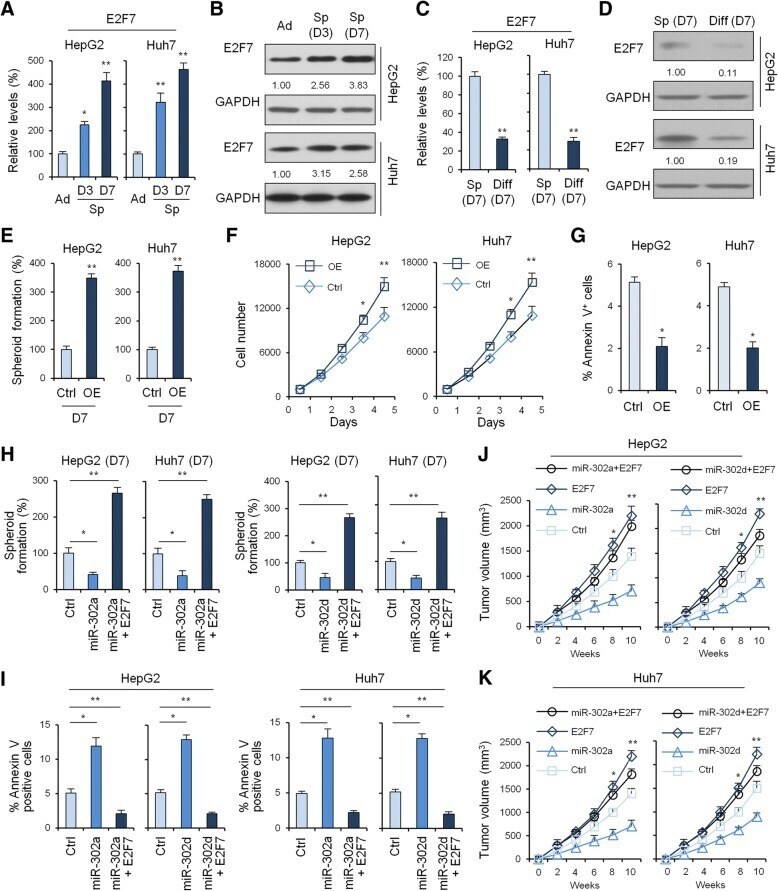
- Fig. 5 The effect of miRNA-302a/d and/or E2F7 on AKT1-cyclin D1 signaling and downstream cell cycle. a , Cell cycle quantitative analysis of HepG2 cells transfected with the miRNA-302a/d knockdown or the control vector. b , Western blot to quantify the effect of miRNA-302a/d knockdown on AKT1-cyclin D1 signaling in HepG2 cells. c , Cell cycle quantitative analysis of HepG2 cells transfected with the miRNA-302a/d overexpression or the control vector. d , Western blot to quantify the effect of miRNA-302a/d overexpression on AKT1-cyclin D1 signaling in HepG2 cells. e , Western blot to quantify the effect of miRNA-302a/d and E2F7 overexpression on AKT1-cyclin D1 signaling in HepG2 cells. f , Cell cycle quantitative analysis of HepG2 cells transfected with the miRNA-302a/d and E2F7 overexpression or the control vector. g , Cell cycle quantitative analysis of CD133 + EpCAM + HepG2 cells transfected with the miRNA-302a/d and/or E2F7 overexpression or the control vector. h , Western blot to quantify the effect of miRNA-302a/d and/or E2F7 on protein levels of intranuclear beta-catenin level in HepG2 cells. Western blot to quantify the effect of AKT1 ( i ) and Cyclin D1 ( j ) on E2F7 protein level in HepG2 and Huh7 cells. Western blot to quantify the effect of AKT1 ( k ) and Cyclin D1 ( l ) on intranuclear beta-catenin level in HepG2 and Huh7 cells