 Explore
 Validate
 Learn
Learn Western blot
 ELISA
ELISA Immunohistochemistry
Antibody data
- Antibody Data
- Antigen structure
- References [2]
- Comments [0]
- Validations
- Immunohistochemistry [2]
- Other assay [3]
Submit
Validation data
Reference
Comment
Report error
- Product number
- PA5-72834 - Provider product page

- Provider
- Invitrogen Antibodies
- Product name
- SESN2 Polyclonal Antibody
- Antibody type
- Polyclonal
- Antigen
- Synthetic peptide
- Reactivity
- Human, Mouse, Rat
- Host
- Rabbit
- Isotype
- IgG
- Vial size
- 100 μg
- Concentration
- 1 mg/mL
- Storage
- Store at 4°C short term. For long term storage, store at -20°C, avoiding freeze/thaw cycles.
Submitted references Sestrin Proteins Protect Against Lipotoxicity-Induced Oxidative Stress in the Liver via Suppression of C-Jun N-Terminal Kinases.
Sestrin 2 attenuates sepsis-associated encephalopathy through the promotion of autophagy in hippocampal neurons.
Fang Z, Kim HG, Huang M, Chowdhury K, Li MO, Liangpunsakul S, Dong XC
Cellular and molecular gastroenterology and hepatology 2021;12(3):921-942
Cellular and molecular gastroenterology and hepatology 2021;12(3):921-942
Sestrin 2 attenuates sepsis-associated encephalopathy through the promotion of autophagy in hippocampal neurons.
Luo L, Wu J, Qiao L, Lu G, Li J, Li D
Journal of cellular and molecular medicine 2020 Jun;24(12):6634-6643
Journal of cellular and molecular medicine 2020 Jun;24(12):6634-6643
No comments: Submit comment
Supportive validation
- Submitted by
- Invitrogen Antibodies (provider)
- Main image
- Experimental details
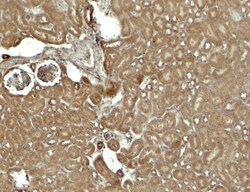
- Immunohistochemistry of SESTRIN2 in mouse kidney tissue with SESN2 Polyclonal Antibody (Product # PA5-72834) at 5 µg/mL.

- Submitted by
- Invitrogen Antibodies (provider)
- Main image

- Experimental details
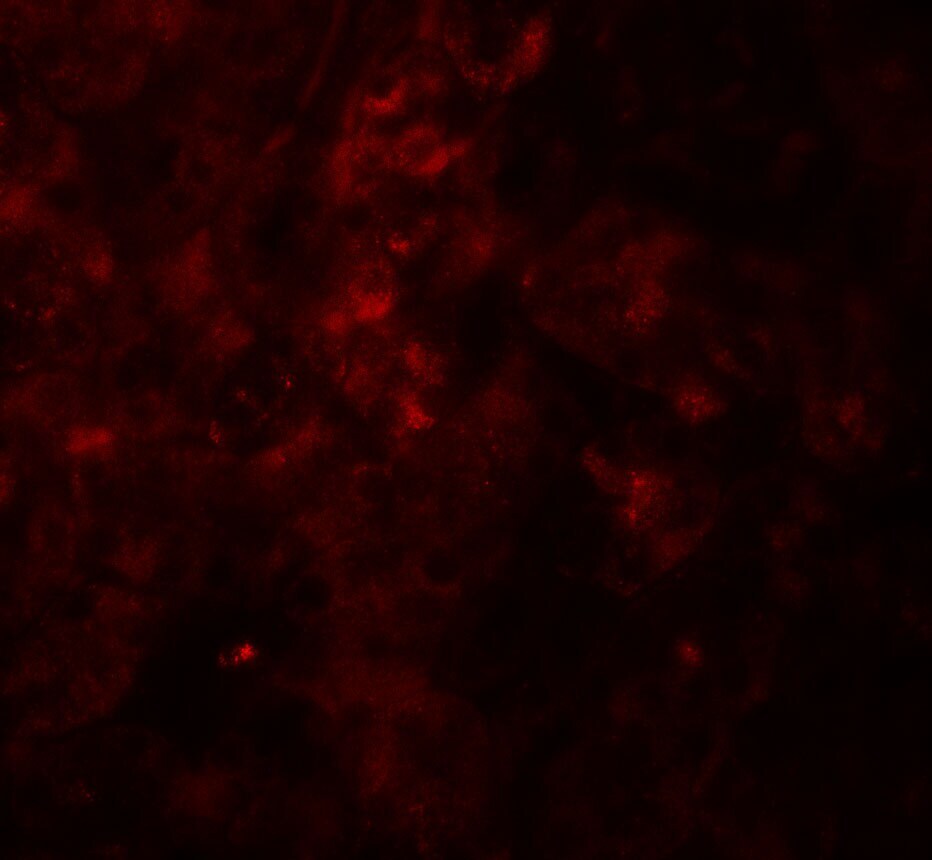
- Immunofluorescence of SESTRIN2 in mouse kidney tissue with SESN2 Polyclonal Antibody (Product # PA5-72834) at 20 µg/mL.
Supportive validation
- Submitted by
- Invitrogen Antibodies (provider)
- Main image
- Experimental details
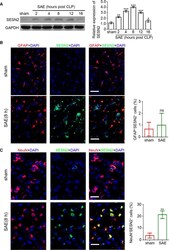
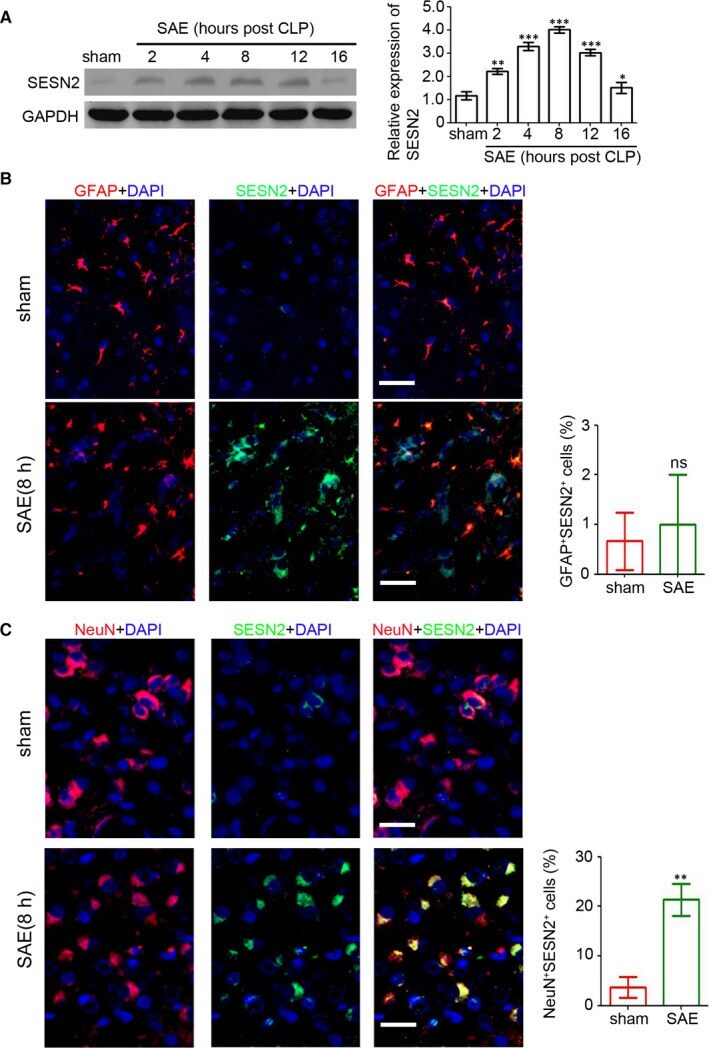
- Figure 1 Up-regulation of SESN2 in neurons following SAE. The SAE model was established in C57 mice by ligation and puncture (CLP). The brain tissues were collected at 0, 2, 4, 8, 12 and 16 hours following CLP. A, SESN2 expression in the brain tissues was determined by Western blotting. GAPDH was used as loading control. The relative expression of SESN2 was analysed (n = 4, ** P < 0.01; *** P < 0.001, compared with the sham group; independent t test). Immunofluorescence staining of SESN2 (green) and either GFAP (red, B) or NeuN (red, C) in the brain tissues of C57 mice with CLP. The percentage of double-positive cells was assessed. Scale bar = 100 mum. (n = 6, ns, no significant difference; ** P < 0.01, compared with the sham group; independent t test)
- Submitted by
- Invitrogen Antibodies (provider)
- Main image
- Experimental details
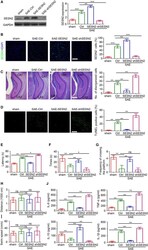
- Figure 2 Overexpression of SESN2 inhibits SAE-related damage. The AAV2-Ctrl, AAV2-SESN2 and AAV2-shSESN2 were separately injected into the hippocampus of C57 mice at two hours prior to the CLP operation. A, SESN2 expression in the brain tissues was determined by Western blotting. GAPDH was used as loading control. The relative expression of SESN2 was analysed (n = 4, ** P < 0.01). B, Immunofluorescence staining of SESN2 (green) in the brain tissues. The percentage of SESN2-positive cells was assessed. Scale bar = 200 mum (n = 6, ** P < 0.01; *** P < 0.001. C, Light microscopy of the brain tissues in different groups (haematoxylin and eosin (H&E), scale bar = 500 mum). The number of disorganized cells in whole hippocampus (CA1 and CA3) was counted and evaluated (n = 6, ** P < 0.01). D, Detection of apoptotic cells in the hippocampus of mice by TUNEL assay. The per cent of TUNEL-positive cells were assessed. Scale bar = 200 mum (n = 6, ** P < 0.01). E, The time required by mice to reach the platform was measured in the Morris water maze task (n = 4, ** P < 0.01). F, The time spent in the target quadrant was measured to assess the memory retention capabilities in Morris water maze task (n = 4, * P < 0.05; ** P < 0.01). G, The frequency of mice crossing the platform area was recorded (n = 4, ns, no significant difference;** P < 0.01). H, The distance travelled of mice in 60 s was recorded (n = 4, ns, no significant difference). I, The swim speed of mice in 60 s was recorded (n =

- Submitted by
- Invitrogen Antibodies (provider)
- Main image
- Experimental details
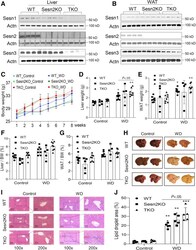
- Figure 2 Genotyping and general characterization of Sesn1/2/3 TKO mice. ( A and B ) Western blot analysis of Sesn1, Sesn2, and Sesn3 proteins in liver and white adipose tissue (WAT) of WT, Sesn2KO, and TKO mice. ( C-G ) Measurements of body weight, liver weight, WAT weight, liver to body weight ratio, and WAT to body weight ratio, respectively. ( H ) Liver images collected at end of the experiment. ( I ) H&E staining of liver sections. ( J ) Quantification of lipid droplet areas in liver sections of control diet or WD treated mice. Data are expressed as mean +- SD (n = 5-8). * P < .05, ** P < .01, *** P < .001 for WD vs control diet for the respective genotypes.
