Explore
 Validate
 Learn
LearnPA1-023
antibody from Invitrogen Antibodies
Targeting: NFAT5
KIAA0827, NF-AT5, NFATL1, NFATZ, OREBP, TONEBP
 Western blot
 Immunocytochemistry
 Gel shift
Antibody data
- Antibody Data
- Antigen structure
- References [34]
- Comments [0]
- Validations
- Immunocytochemistry [8]
- Immunoprecipitation [1]
- Immunohistochemistry [2]
- Other assay [29]
Submit
Validation data
Reference
Comment
Report error
- Product number
- PA1-023 - Provider product page

- Provider
- Invitrogen Antibodies
- Product name
- NFAT5 Polyclonal Antibody
- Antibody type
- Polyclonal
- Antigen
- Synthetic peptide
- Description
- PA1-023 detects nuclear factor of activated T-cells 5 (NFAT5) from human and mouse cells as well as recombinant human protein. PA1-023 has been successfully used in Western blot, immunofluorescence, immunoprecipitation, gel shift and immunocytochemistry procedures. By Western blot, this antibody detects an ~170 kDa protein representing NFAT5 in HEK293 cells transfected with the human NFAT5 gene. Immunocytochemical staining of NFAT5 in HEK293 cells transfected with the human NFAT5 gene with PA1-023 results in primarily cytoplasmic staining. The PA1-023 immunogen is a synthetic peptide corresponding to residues C D(1439) L L V S L Q N Q G N N L T G S F(1455) of human NFAT5. This sequence is 94% conserved in the mouse protein. PA1-023 immunizing peptide (Cat. # PEP-123) is available for use in neutralization and control experiments.
- Reactivity
- Human, Mouse
- Host
- Rabbit
- Isotype
- IgG
- Vial size
- 50 μg
- Concentration
- 1 mg/mL
- Storage
- -20°C, Avoid Freeze/Thaw Cycles
Submitted references Interleukin-20 is involved in dry eye disease and is a potential therapeutic target.
Transcription Factor TonEBP Stimulates Hyperosmolality-Dependent Arginine Vasopressin Gene Expression in the Mouse Hypothalamus.
Na(+) (i)/K(+) (i) imbalance contributes to gene expression in endothelial cells exposed to elevated NaCl.
Aestivation motifs explain hypertension and muscle mass loss in mice with psoriatic skin barrier defect.
NFAT5 Amplifies Antipathogen Responses by Enhancing Chromatin Accessibility, H3K27 Demethylation, and Transcription Factor Recruitment.
Impact of salt and the osmoprotective transcription factor NFAT-5 on macrophages during mechanical strain.
Dietary Salt Accelerates Orthodontic Tooth Movement by Increased Osteoclast Activity.
NCX1 represents an ionic Na+ sensing mechanism in macrophages.
Recurrent Amplification of the Osmotic Stress Transcription Factor NFAT5 in Adrenocortical Carcinoma.
HIF1A and NFAT5 coordinate Na(+)-boosted antibacterial defense via enhanced autophagy and autolysosomal targeting.
Hyperosmotic stress enhances cytotoxicity of SMAC mimetics.
Renal Sodium Gradient Orchestrates a Dynamic Antibacterial Defense Zone.
Tumour exosome integrins determine organotropic metastasis.
Arterial wall stress controls NFAT5 activity in vascular smooth muscle cells.
Calcium/calcineurin synergizes with prostratin to promote NF-κB dependent activation of latent HIV.
NFAT5 represses canonical Wnt signaling via inhibition of β-catenin acetylation and participates in regulating intestinal cell differentiation.
NFAT5 is activated by hypoxia: role in ischemia and reperfusion in the rat kidney.
NFAT5 regulates the canonical Wnt pathway and is required for cardiomyogenic differentiation.
Dual role of the ddx5/ddx17 RNA helicases in the control of the pro-migratory NFAT5 transcription factor.
Intrauterine growth restriction modifies the normal gene expression in kidney from rabbit fetuses.
Mediator of DNA damage checkpoint 1 (MDC1) contributes to high NaCl-induced activation of the osmoprotective transcription factor TonEBP/OREBP.
Contribution of SHP-1 protein tyrosine phosphatase to osmotic regulation of the transcription factor TonEBP/OREBP.
The transcription factor NFAT5 is required for cyclin expression and cell cycle progression in cells exposed to hypertonic stress.
Macrophages regulate salt-dependent volume and blood pressure by a vascular endothelial growth factor-C-dependent buffering mechanism.
Integrin alpha6beta4 controls the expression of genes associated with cell motility, invasion, and metastasis, including S100A4/metastasin.
Analysis of the transcriptional activity of endogenous NFAT5 in primary cells using transgenic NFAT-luciferase reporter mice.
Discovery of osmosensitive transcriptional regulation of human cytochrome P450 3As by the tonicity-responsive enhancer binding protein (nuclear factor of activated T cells 5).
Proteomic identification of proteins associated with the osmoregulatory transcription factor TonEBP/OREBP: functional effects of Hsp90 and PARP-1.
Neuropathy target esterase catalyzes osmoprotective renal synthesis of glycerophosphocholine in response to high NaCl.
Phosphatidylinositol 3-kinase mediates activation of ATM by high NaCl and by ionizing radiation: Role in osmoprotective transcriptional regulation.
Up-regulation of human myo-inositol oxygenase by hyperosmotic stress in renal proximal tubular epithelial cells.
Expression of osmotic stress-related genes in tissues of normal and hyposmotic rats.
The role of NFAT transcription factors in integrin-mediated carcinoma invasion.
Activity of the TonEBP/OREBP transactivation domain varies directly with extracellular NaCl concentration.
Wang HH, Chen WY, Huang YH, Hsu SM, Tsao YP, Hsu YH, Chang MS
Journal of biomedical science 2022 Jun 9;29(1):36
Journal of biomedical science 2022 Jun 9;29(1):36
Transcription Factor TonEBP Stimulates Hyperosmolality-Dependent Arginine Vasopressin Gene Expression in the Mouse Hypothalamus.
Kim DH, Kim KK, Lee TH, Eom H, Kim JW, Park JW, Jeong JK, Lee BJ
Frontiers in endocrinology 2021;12:627343
Frontiers in endocrinology 2021;12:627343
Na(+) (i)/K(+) (i) imbalance contributes to gene expression in endothelial cells exposed to elevated NaCl.
Fedorov DA, Sidorenko SV, Yusipovich AI, Parshina EY, Tverskoi AM, Abramicheva PA, Maksimov GV, Orlov SN, Lopina OD, Klimanova EA
Heliyon 2021 Sep;7(9):e08088
Heliyon 2021 Sep;7(9):e08088
Aestivation motifs explain hypertension and muscle mass loss in mice with psoriatic skin barrier defect.
Wild J, Jung R, Knopp T, Efentakis P, Benaki D, Grill A, Wegner J, Molitor M, Garlapati V, Rakova N, Markó L, Marton A, Mikros E, Münzel T, Kossmann S, Rauh M, Nakano D, Kitada K, Luft F, Waisman A, Wenzel P, Titze J, Karbach S
Acta physiologica (Oxford, England) 2021 May;232(1):e13628
Acta physiologica (Oxford, England) 2021 May;232(1):e13628
NFAT5 Amplifies Antipathogen Responses by Enhancing Chromatin Accessibility, H3K27 Demethylation, and Transcription Factor Recruitment.
Lunazzi G, Buxadé M, Riera-Borrull M, Higuera L, Bonnin S, Huerga Encabo H, Gaggero S, Reyes-Garau D, Company C, Cozzuto L, Ponomarenko J, Aramburu J, López-Rodríguez C
Journal of immunology (Baltimore, Md. : 1950) 2021 Jun 1;206(11):2652-2667
Journal of immunology (Baltimore, Md. : 1950) 2021 Jun 1;206(11):2652-2667
Impact of salt and the osmoprotective transcription factor NFAT-5 on macrophages during mechanical strain.
Schröder A, Leikam A, Käppler P, Neubert P, Jantsch J, Neuhofer W, Deschner J, Proff P, Kirschneck C
Immunology and cell biology 2021 Jan;99(1):84-96
Immunology and cell biology 2021 Jan;99(1):84-96
Dietary Salt Accelerates Orthodontic Tooth Movement by Increased Osteoclast Activity.
Schröder A, Gubernator J, Leikam A, Nazet U, Cieplik F, Jantsch J, Neubert P, Titze J, Proff P, Kirschneck C
International journal of molecular sciences 2021 Jan 9;22(2)
International journal of molecular sciences 2021 Jan 9;22(2)
NCX1 represents an ionic Na+ sensing mechanism in macrophages.
Neubert P, Homann A, Wendelborn D, Bär AL, Krampert L, Trum M, Schröder A, Ebner S, Weichselbaum A, Schatz V, Linz P, Veelken R, Schulte-Schrepping J, Aschenbrenner AC, Quast T, Kurts C, Geisberger S, Kunzelmann K, Hammer K, Binger KJ, Titze J, Müller DN, Kolanus W, Schultze JL, Wagner S, Jantsch J
PLoS biology 2020 Jun;18(6):e3000722
PLoS biology 2020 Jun;18(6):e3000722
Recurrent Amplification of the Osmotic Stress Transcription Factor NFAT5 in Adrenocortical Carcinoma.
Brown TC, Nicolson NG, Man J, Gibson CE, Stenman A, Juhlin CC, Korah R, Carling T
Journal of the Endocrine Society 2020 Jul 1;4(7):bvaa060
Journal of the Endocrine Society 2020 Jul 1;4(7):bvaa060
HIF1A and NFAT5 coordinate Na(+)-boosted antibacterial defense via enhanced autophagy and autolysosomal targeting.
Neubert P, Weichselbaum A, Reitinger C, Schatz V, Schröder A, Ferdinand JR, Simon M, Bär AL, Brochhausen C, Gerlach RG, Tomiuk S, Hammer K, Wagner S, van Zandbergen G, Binger KJ, Müller DN, Kitada K, Clatworthy MR, Kurts C, Titze J, Abdullah Z, Jantsch J
Autophagy 2019 Nov;15(11):1899-1916
Autophagy 2019 Nov;15(11):1899-1916
Hyperosmotic stress enhances cytotoxicity of SMAC mimetics.
Bittner S, Knoll G, Ehrenschwender M
Cell death & disease 2017 Aug 3;8(8):e2967
Cell death & disease 2017 Aug 3;8(8):e2967
Renal Sodium Gradient Orchestrates a Dynamic Antibacterial Defense Zone.
Berry MR, Mathews RJ, Ferdinand JR, Jing C, Loudon KW, Wlodek E, Dennison TW, Kuper C, Neuhofer W, Clatworthy MR
Cell 2017 Aug 24;170(5):860-874.e19
Cell 2017 Aug 24;170(5):860-874.e19
Tumour exosome integrins determine organotropic metastasis.
Hoshino A, Costa-Silva B, Shen TL, Rodrigues G, Hashimoto A, Tesic Mark M, Molina H, Kohsaka S, Di Giannatale A, Ceder S, Singh S, Williams C, Soplop N, Uryu K, Pharmer L, King T, Bojmar L, Davies AE, Ararso Y, Zhang T, Zhang H, Hernandez J, Weiss JM, Dumont-Cole VD, Kramer K, Wexler LH, Narendran A, Schwartz GK, Healey JH, Sandstrom P, Labori KJ, Kure EH, Grandgenett PM, Hollingsworth MA, de Sousa M, Kaur S, Jain M, Mallya K, Batra SK, Jarnagin WR, Brady MS, Fodstad O, Muller V, Pantel K, Minn AJ, Bissell MJ, Garcia BA, Kang Y, Rajasekhar VK, Ghajar CM, Matei I, Peinado H, Bromberg J, Lyden D
Nature 2015 Nov 19;527(7578):329-35
Nature 2015 Nov 19;527(7578):329-35
Arterial wall stress controls NFAT5 activity in vascular smooth muscle cells.
Scherer C, Pfisterer L, Wagner AH, Hödebeck M, Cattaruzza M, Hecker M, Korff T
Journal of the American Heart Association 2014 Mar 10;3(2):e000626
Journal of the American Heart Association 2014 Mar 10;3(2):e000626
Calcium/calcineurin synergizes with prostratin to promote NF-κB dependent activation of latent HIV.
Chan JK, Bhattacharyya D, Lassen KG, Ruelas D, Greene WC
PloS one 2013;8(10):e77749
PloS one 2013;8(10):e77749
NFAT5 represses canonical Wnt signaling via inhibition of β-catenin acetylation and participates in regulating intestinal cell differentiation.
Wang Q, Zhou Y, Rychahou P, Liu C, Weiss HL, Evers BM
Cell death & disease 2013 Jun 13;4(6):e671
Cell death & disease 2013 Jun 13;4(6):e671
NFAT5 is activated by hypoxia: role in ischemia and reperfusion in the rat kidney.
Villanueva S, Suazo C, Santapau D, Pérez F, Quiroz M, Carreño JE, Illanes S, Lavandero S, Michea L, Irarrazabal CE
PloS one 2012;7(7):e39665
PloS one 2012;7(7):e39665
NFAT5 regulates the canonical Wnt pathway and is required for cardiomyogenic differentiation.
Adachi A, Takahashi T, Ogata T, Imoto-Tsubakimoto H, Nakanishi N, Ueyama T, Matsubara H
Biochemical and biophysical research communications 2012 Sep 28;426(3):317-23
Biochemical and biophysical research communications 2012 Sep 28;426(3):317-23
Dual role of the ddx5/ddx17 RNA helicases in the control of the pro-migratory NFAT5 transcription factor.
Germann S, Gratadou L, Zonta E, Dardenne E, Gaudineau B, Fougère M, Samaan S, Dutertre M, Jauliac S, Auboeuf D
Oncogene 2012 Oct 18;31(42):4536-49
Oncogene 2012 Oct 18;31(42):4536-49
Intrauterine growth restriction modifies the normal gene expression in kidney from rabbit fetuses.
Figueroa H, Lozano M, Suazo C, Eixarch E, Illanes SE, Carreño JE, Villanueva S, Hernández-Andrade E, Gratacós E, Irarrazabal CE
Early human development 2012 Nov;88(11):899-904
Early human development 2012 Nov;88(11):899-904
Mediator of DNA damage checkpoint 1 (MDC1) contributes to high NaCl-induced activation of the osmoprotective transcription factor TonEBP/OREBP.
Kunin M, Dmitrieva NI, Gallazzini M, Shen RF, Wang G, Burg MB, Ferraris JD
PloS one 2010 Aug 11;5(8):e12108
PloS one 2010 Aug 11;5(8):e12108
Contribution of SHP-1 protein tyrosine phosphatase to osmotic regulation of the transcription factor TonEBP/OREBP.
Zhou X, Gallazzini M, Burg MB, Ferraris JD
Proceedings of the National Academy of Sciences of the United States of America 2010 Apr 13;107(15):7072-7
Proceedings of the National Academy of Sciences of the United States of America 2010 Apr 13;107(15):7072-7
The transcription factor NFAT5 is required for cyclin expression and cell cycle progression in cells exposed to hypertonic stress.
Drews-Elger K, Ortells MC, Rao A, López-Rodriguez C, Aramburu J
PloS one 2009;4(4):e5245
PloS one 2009;4(4):e5245
Macrophages regulate salt-dependent volume and blood pressure by a vascular endothelial growth factor-C-dependent buffering mechanism.
Machnik A, Neuhofer W, Jantsch J, Dahlmann A, Tammela T, Machura K, Park JK, Beck FX, Müller DN, Derer W, Goss J, Ziomber A, Dietsch P, Wagner H, van Rooijen N, Kurtz A, Hilgers KF, Alitalo K, Eckardt KU, Luft FC, Kerjaschki D, Titze J
Nature medicine 2009 May;15(5):545-52
Nature medicine 2009 May;15(5):545-52
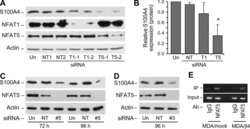
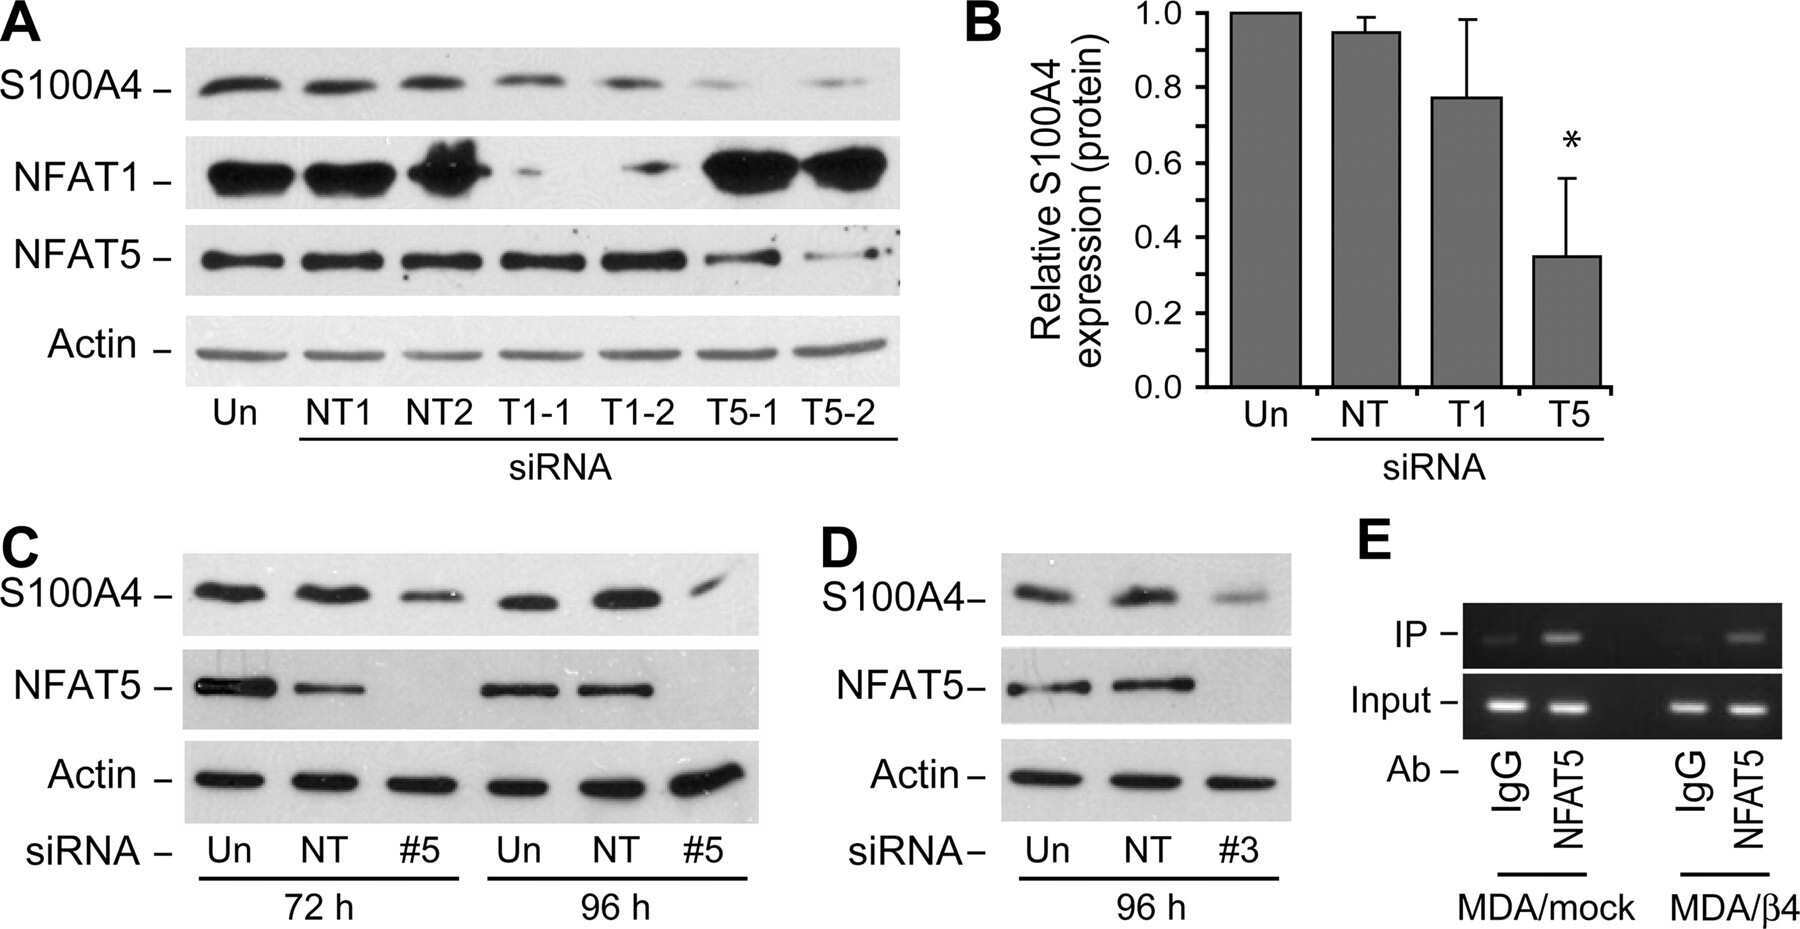
Integrin alpha6beta4 controls the expression of genes associated with cell motility, invasion, and metastasis, including S100A4/metastasin.
Chen M, Sinha M, Luxon BA, Bresnick AR, O'Connor KL
The Journal of biological chemistry 2009 Jan 16;284(3):1484-94
The Journal of biological chemistry 2009 Jan 16;284(3):1484-94
Analysis of the transcriptional activity of endogenous NFAT5 in primary cells using transgenic NFAT-luciferase reporter mice.
Morancho B, Minguillón J, Molkentin JD, López-Rodríguez C, Aramburu J
BMC molecular biology 2008 Jan 25;9:13
BMC molecular biology 2008 Jan 25;9:13
Discovery of osmosensitive transcriptional regulation of human cytochrome P450 3As by the tonicity-responsive enhancer binding protein (nuclear factor of activated T cells 5).
Kosuge K, Chuang AI, Uematsu S, Tan KP, Ohashi K, Ko BC, Ito S
Molecular pharmacology 2007 Oct;72(4):826-37
Molecular pharmacology 2007 Oct;72(4):826-37
Proteomic identification of proteins associated with the osmoregulatory transcription factor TonEBP/OREBP: functional effects of Hsp90 and PARP-1.
Chen Y, Schnetz MP, Irarrazabal CE, Shen RF, Williams CK, Burg MB, Ferraris JD
American journal of physiology. Renal physiology 2007 Mar;292(3):F981-92
American journal of physiology. Renal physiology 2007 Mar;292(3):F981-92
Neuropathy target esterase catalyzes osmoprotective renal synthesis of glycerophosphocholine in response to high NaCl.
Gallazzini M, Ferraris JD, Kunin M, Morris RG, Burg MB
Proceedings of the National Academy of Sciences of the United States of America 2006 Oct 10;103(41):15260-5
Proceedings of the National Academy of Sciences of the United States of America 2006 Oct 10;103(41):15260-5
Phosphatidylinositol 3-kinase mediates activation of ATM by high NaCl and by ionizing radiation: Role in osmoprotective transcriptional regulation.
Irarrazabal CE, Burg MB, Ward SG, Ferraris JD
Proceedings of the National Academy of Sciences of the United States of America 2006 Jun 6;103(23):8882-7
Proceedings of the National Academy of Sciences of the United States of America 2006 Jun 6;103(23):8882-7
Up-regulation of human myo-inositol oxygenase by hyperosmotic stress in renal proximal tubular epithelial cells.
Prabhu KS, Arner RJ, Vunta H, Reddy CC
The Journal of biological chemistry 2005 May 20;280(20):19895-901
The Journal of biological chemistry 2005 May 20;280(20):19895-901
Expression of osmotic stress-related genes in tissues of normal and hyposmotic rats.
Zhang Z, Ferraris JD, Brooks HL, Brisc I, Burg MB
American journal of physiology. Renal physiology 2003 Oct;285(4):F688-93
American journal of physiology. Renal physiology 2003 Oct;285(4):F688-93
The role of NFAT transcription factors in integrin-mediated carcinoma invasion.
Jauliac S, López-Rodriguez C, Shaw LM, Brown LF, Rao A, Toker A
Nature cell biology 2002 Jul;4(7):540-4
Nature cell biology 2002 Jul;4(7):540-4
Activity of the TonEBP/OREBP transactivation domain varies directly with extracellular NaCl concentration.
Ferraris JD, Williams CK, Persaud P, Zhang Z, Chen Y, Burg MB
Proceedings of the National Academy of Sciences of the United States of America 2002 Jan 22;99(2):739-44
Proceedings of the National Academy of Sciences of the United States of America 2002 Jan 22;99(2):739-44
No comments: Submit comment
Supportive validation
- Submitted by
- Invitrogen Antibodies (provider)
- Main image
- Experimental details
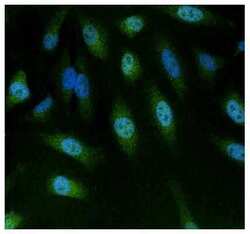
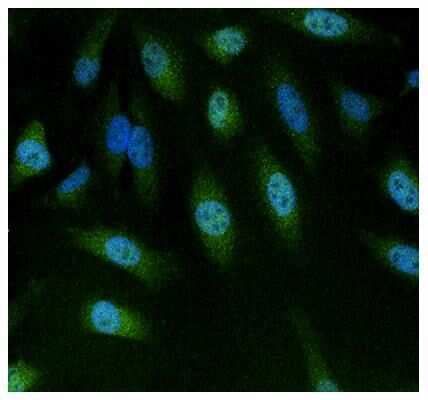
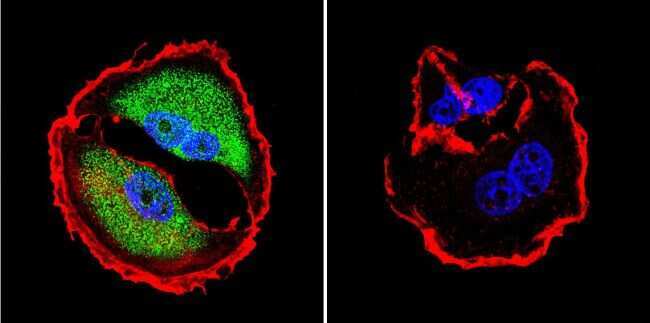
- Immunofluorescent analysis of NFAT5 using anti-NFAT5 polyclonal antibody (Product # PA1-023) (shown in green) in HeLa cells. Formalin fixed cells were permeabilized with 0.1% Triton X-100 in TBS for 10 minutes at room temperature. Cells were then blocked with 1% Blocker BSA (Product # 37525) for 15 minutes at room temperature. Cells were probed with a rabbit polyclonal antibody recognizing NFAT5 (Product # PA1-023), at a dilution of 1:100 for at least 1 hour at room temperature. Cells were washed with PBS and incubated with DyLight 488 goat-anti-rabbit secondary antibody (Product # 35552) at a dilution of 1:400 for 30 minutes at room temperature. Nuclei (blue) were stained with Hoechst 33342 dye (Product # 62249). Images were taken on a Thermo Scientific ArrayScan at 20X magnification.
- Submitted by
- Invitrogen Antibodies (provider)
- Main image
- Experimental details
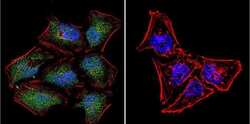
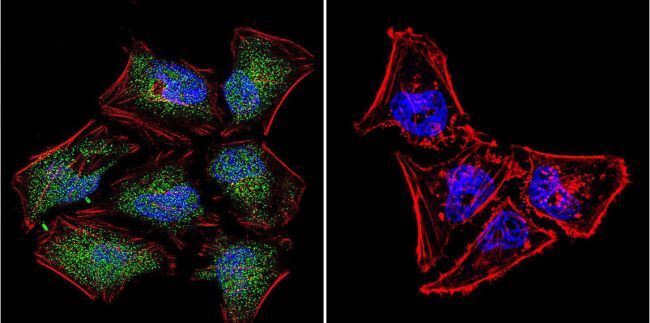
- Immunofluorescent analysis of NFAT5 in HeLa Cells. Cells were grown on chamber slides and fixed with formaldehyde prior to staining. Cells were probed without (control) or with a NFAT5 polyclonal antibody (Product # PA1-023) at a dilution of 1:20 overnight at 4 C, washed with PBS and incubated with a DyLight-488 conjugated secondary antibody (Product # 35552). NFAT5 staining (green), F-Actin staining with Phalloidin (red) and nuclei with DAPI (blue) is shown. Images were taken at 60X magnification.

- Submitted by
- Invitrogen Antibodies (provider)
- Main image

- Experimental details
- Immunofluorescent analysis of NFAT5 in MCF-7 Cells. Cells were grown on chamber slides and fixed with formaldehyde prior to staining. Cells were probed without (control) or with a NFAT5 polyclonal antibody (Product # PA1-023) at a dilution of 1:200 overnight at 4 C, washed with PBS and incubated with a DyLight-488 conjugated secondary antibody (Product # 35552). NFAT5 staining (green), F-Actin staining with Phalloidin (red) and nuclei with DAPI (blue) is shown. Images were taken at 60X magnification.
- Submitted by
- Invitrogen Antibodies (provider)
- Main image

- Experimental details
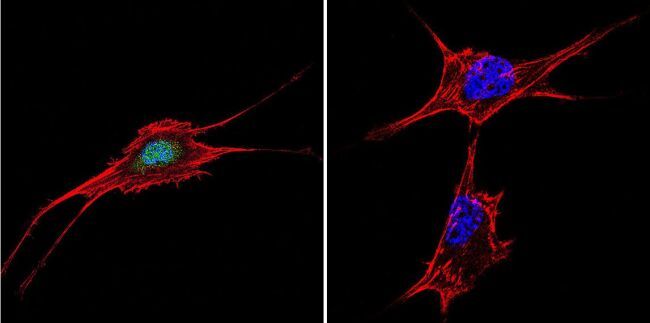
- Immunofluorescent analysis of NFAT5 in NIH-3T3 Cells. Cells were grown on chamber slides and fixed with formaldehyde prior to staining. Cells were probed without (control) or with a NFAT5 polyclonal antibody (Product # PA1-023) at a dilution of 1:20 overnight at 4 C, washed with PBS and incubated with a DyLight-488 conjugated secondary antibody (Product # 35552). NFAT5 staining (green), F-Actin staining with Phalloidin (red) and nuclei with DAPI (blue) is shown. Images were taken at 60X magnification.

- Submitted by
- Invitrogen Antibodies (provider)
- Main image

- Experimental details
- Immunofluorescent analysis of NFAT5 in HeLa Cells. Cells were grown on chamber slides and fixed with formaldehyde prior to staining. Cells were probed without (control) or with a NFAT5 polyclonal antibody (Product # PA1-023) at a dilution of 1:20 overnight at 4 C, washed with PBS and incubated with a DyLight-488 conjugated secondary antibody (Product # 35552). NFAT5 staining (green), F-Actin staining with Phalloidin (red) and nuclei with DAPI (blue) is shown. Images were taken at 60X magnification.
- Submitted by
- Invitrogen Antibodies (provider)
- Main image

- Experimental details
- Immunofluorescent analysis of NFAT5 in MCF-7 Cells. Cells were grown on chamber slides and fixed with formaldehyde prior to staining. Cells were probed without (control) or with a NFAT5 polyclonal antibody (Product # PA1-023) at a dilution of 1:200 overnight at 4 C, washed with PBS and incubated with a DyLight-488 conjugated secondary antibody (Product # 35552). NFAT5 staining (green), F-Actin staining with Phalloidin (red) and nuclei with DAPI (blue) is shown. Images were taken at 60X magnification.

- Submitted by
- Invitrogen Antibodies (provider)
- Main image

- Experimental details
- Immunofluorescent analysis of NFAT5 in NIH-3T3 Cells. Cells were grown on chamber slides and fixed with formaldehyde prior to staining. Cells were probed without (control) or with a NFAT5 polyclonal antibody (Product # PA1-023) at a dilution of 1:20 overnight at 4 C, washed with PBS and incubated with a DyLight-488 conjugated secondary antibody (Product # 35552). NFAT5 staining (green), F-Actin staining with Phalloidin (red) and nuclei with DAPI (blue) is shown. Images were taken at 60X magnification.
- Submitted by
- Invitrogen Antibodies (provider)
- Main image

- Experimental details
- Immunofluorescent analysis of NFAT5 using anti-NFAT5 polyclonal antibody (Product # PA1-023) (shown in green) in HeLa cells. Formalin fixed cells were permeabilized with 0.1% Triton X-100 in TBS for 10 minutes at room temperature. Cells were then blocked with 1% Blocker BSA (Product # 37525) for 15 minutes at room temperature. Cells were probed with a rabbit polyclonal antibody recognizing NFAT5 (Product # PA1-023), at a dilution of 1:100 for at least 1 hour at room temperature. Cells were washed with PBS and incubated with DyLight 488 goat-anti-rabbit secondary antibody (Product # 35552) at a dilution of 1:400 for 30 minutes at room temperature. Nuclei (blue) were stained with Hoechst 33342 dye (Product # 62249). Images were taken on a Thermo Scientific ArrayScan at 20X magnification.

Supportive validation
- Submitted by
- Invitrogen Antibodies (provider)
- Main image
- Experimental details
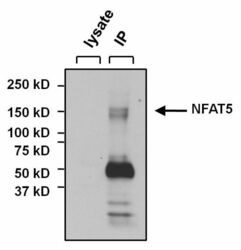
- Immunoprecipitation of NFAT5 was performed on U2OS cells. The antigen:antibody complex was formed by incubating 500 µg whole cell lysate with 3 µg of rabbit polyclonal antibody recognizing NFAT5 (Product # PA1-023) overnight on a rocking platform at 4°C. The immune-complex was captured on 50 µL Protein A/G Plus Agarose (Product # 20423). Captured immune-complexes were washed and proteins eluted with 5X Reducing Sample Loading Dye (Product # 39000). Samples were resolved on a 4-20% Tris-HCl polyacrylamide gel. Proteins were transferred to PVDF membrane and blocked with 5% Milk/TBS-0.1%Tween for at least 1 hour. Membranes were washed in TBS-0.1%Tween 20 and probed with a goat anti-rabbit-HRP secondary antibody (Product # 31460) at a dilution of 1:20,000 for at least one hour. Membranes were washed and chemiluminescent detection performed using Pierce Super Signal West Dura (Product # 34075).

Supportive validation
- Submitted by
- Invitrogen Antibodies (provider)
- Main image
- Experimental details
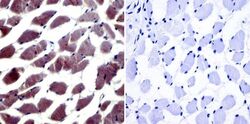
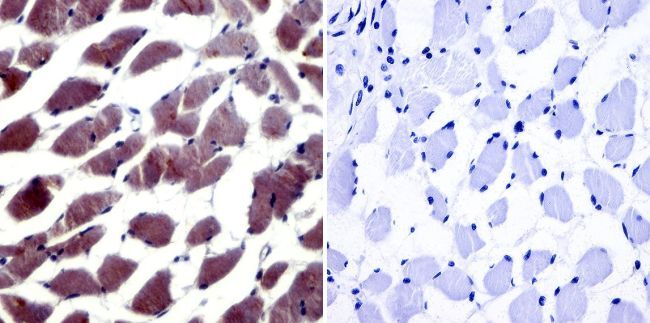
- Immunohistochemistry was performed on normal biopsies of deparaffinized human skeletal muscle tissue. To expose target proteins, heat induced antigen retrieval was performed using 10mM sodium citrate (pH6.0) buffer, microwaved for 8-15 minutes. Following antigen retrieval tissues were blocked in 3% BSA-PBS for 30 minutes at room temperature. Tissues were then probed at a dilution of 1:20 with a Rabbit Polyclonal Antibody recognizing NFAT5 (Product # PA1-023) or without primary antibody (negative control) overnight at 4°C in a humidified chamber. Tissues were washed extensively with PBST and endogenous peroxidase activity was quenched with a peroxidase suppressor. Detection was performed using a biotin-conjugated secondary antibody and SA-HRP, followed by colorimetric detection using DAB. Tissues were counterstained with hematoxylin and prepped for mounting.
- Submitted by
- Invitrogen Antibodies (provider)
- Main image
- Experimental details
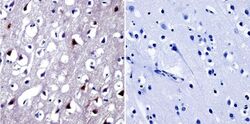
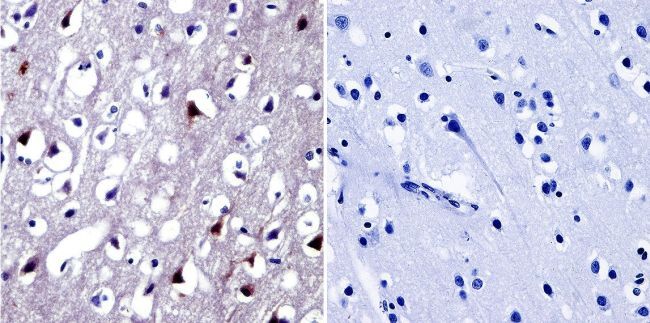
- Immunohistochemistry was performed on normal biopsies of deparaffinized human brain tissue. To expose target proteins, heat induced antigen retrieval was performed using 10mM sodium citrate (pH6.0) buffer, microwaved for 8-15 minutes. Following antigen retrieval tissues were blocked in 3% BSA-PBS for 30 minutes at room temperature. Tissues were then probed at a dilution of 1:20 with a Rabbit Polyclonal Antibody recognizing NFAT5 (Product # PA1-023) or without primary antibody (negative control) overnight at 4°C in a humidified chamber. Tissues were washed extensively with PBST and endogenous peroxidase activity was quenched with a peroxidase suppressor. Detection was performed using a biotin-conjugated secondary antibody and SA-HRP, followed by colorimetric detection using DAB. Tissues were counterstained with hematoxylin and prepped for mounting.
Supportive validation
- Submitted by
- Invitrogen Antibodies (provider)
- Main image

- Experimental details
- Immunoprecipitation of NFAT5 was performed on U2OS cells. The antigen:antibody complex was formed by incubating 500 µg whole cell lysate with 3 µg of rabbit polyclonal antibody recognizing NFAT5 (Product # PA1-023) overnight on a rocking platform at 4°C. The immune-complex was captured on 50 µL Protein A/G Plus Agarose (Product # 20423). Captured immune-complexes were washed and proteins eluted with 5X Reducing Sample Loading Dye (Product # 39000). Samples were resolved on a 4-20% Tris-HCl polyacrylamide gel. Proteins were transferred to PVDF membrane and blocked with 5% Milk/TBS-0.1%Tween for at least 1 hour. Membranes were washed in TBS-0.1%Tween 20 and probed with a goat anti-rabbit-HRP secondary antibody (Product # 31460) at a dilution of 1:20,000 for at least one hour. Membranes were washed and chemiluminescent detection performed using Pierce Super Signal West Dura (Product # 34075).

- Submitted by
- Invitrogen Antibodies (provider)
- Main image
- Experimental details
- NULL
- Submitted by
- Invitrogen Antibodies (provider)
- Main image

- Experimental details
- NULL
- Submitted by
- Invitrogen Antibodies (provider)
- Main image

- Experimental details
- NULL
- Submitted by
- Invitrogen Antibodies (provider)
- Main image
- Experimental details
- NULL

- Submitted by
- Invitrogen Antibodies (provider)
- Main image
- Experimental details
- NULL
- Submitted by
- Invitrogen Antibodies (provider)
- Main image

- Experimental details
- NULL
- Submitted by
- Invitrogen Antibodies (provider)
- Main image
- Experimental details
- NULL
- Submitted by
- Invitrogen Antibodies (provider)
- Main image
- Experimental details
- NULL
- Submitted by
- Invitrogen Antibodies (provider)
- Main image

- Experimental details
- Immunoprecipitation of NFAT5 was performed on U2OS cells. The antigen:antibody complex was formed by incubating 500 µg whole cell lysate with 3 µg of rabbit polyclonal antibody recognizing NFAT5 (Product # PA1-023) overnight on a rocking platform at 4øC. The immune-complex was captured on 50 µL Protein A/G Plus Agarose (Product # 20423). Captured immune-complexes were washed and proteins eluted with 5X Reducing Sample Loading Dye (Product # 39000). Samples were resolved on a 4-20% Tris-HCl polyacrylamide gel. Proteins were transferred to PVDF membrane and blocked with 5% Milk/TBS-0.1%Tween for at least 1 hour. Membranes were washed in TBS-0.1%Tween 20 and probed with a goat anti-rabbit-HRP secondary antibody (Product # 31460) at a dilution of 1:20,000 for at least one hour. Membranes were washed and chemiluminescent detection performed using Pierce Super Signal West Dura (Product # 34075).

- Submitted by
- Invitrogen Antibodies (provider)
- Main image

- Experimental details
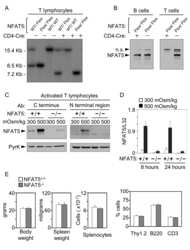
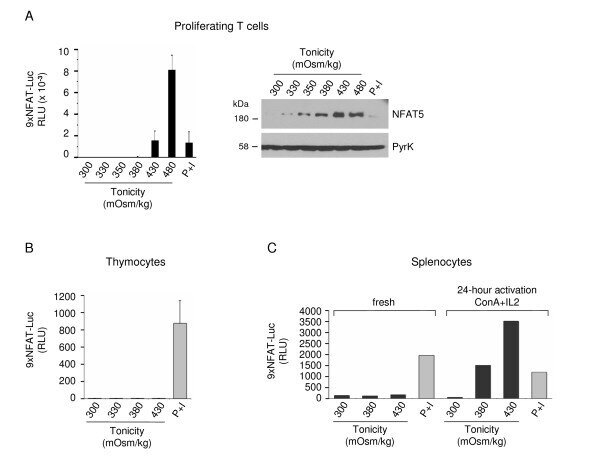
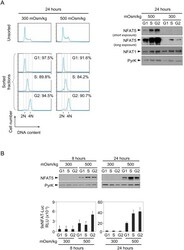
- Figure 3 Activation of the transgenic 9xNFAT-Luc reporter in fresh and mitogen-activated lymphocytes . A) Proliferating transgenic 9xNFAT-Luc T cells were exposed to increasingly hypertonic media in the presence of FK506, or stimulated with PMA plus ionomycin during 24 hours. Left panel: luciferase activity (RLU) shown is the mean +- S.E.M of five independent experiments. Right panel: NFAT5 and pyruvate kinase (protein loading control) were detected by Western blotting. One representative experiment is shown out of three performed independently. B) Luciferase activity in 9xNFAT-Luc transgenic thymocytes exposed to increasingly hypertonic media in the presence of FK506, or stimulated with PMA plus ionomycin during 24 hours. Mean +- S.E.M of three independent experiments is shown. C) Luciferase activity in 9xNFAT-Luc transgenic splenocytes stimulated during 24 hours with hypertonicity or PMA plus ionomycin, either immediately after their purification, or after a 24-hour preactivation with concanavalin A plus IL2. One representative experiment is shown out of three performed independently.
- Submitted by
- Invitrogen Antibodies (provider)
- Main image
- Experimental details
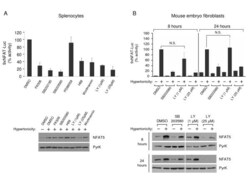
- Figure 5 Sensitivity of NFAT5 transcriptional activity and expression to pharmacological inhibitors . A) Transgenic 9xNFAT-Luc splenocytes preactivated during 24 hours with concanavalin plus IL2 were treated with hypertonicity (400 mOsm/kg, 24 hours) in the absence or presence of FK506 (100 nM), SB203580 or SB202190 (both at 10 muM), PD98059 (10 muM), H89 (2 muM), wortmannin (0.5 muM), or LY294002 (LY). Luciferase activity in the upper panel (mean +- S.D of three independent experiments) is shown as percentage of the activity in the absence of inhibitors (100%). Western blotting in the lower panelshows NFAT5 and pyruvate kinase expression. B) Transgenic MEF were stimulated for 8 or 24 hours with hypertonicity (460 mOsm/kg) in the absence or presence of SB203580 (10 muM) or LY294002 (LY). Luciferase activity is shown is the upper panel (mean +- S.E.M of three independent experiments). NFAT5 and pyruvate kinase expression are shown in the lower panel.

- Submitted by
- Invitrogen Antibodies (provider)
- Main image

- Experimental details
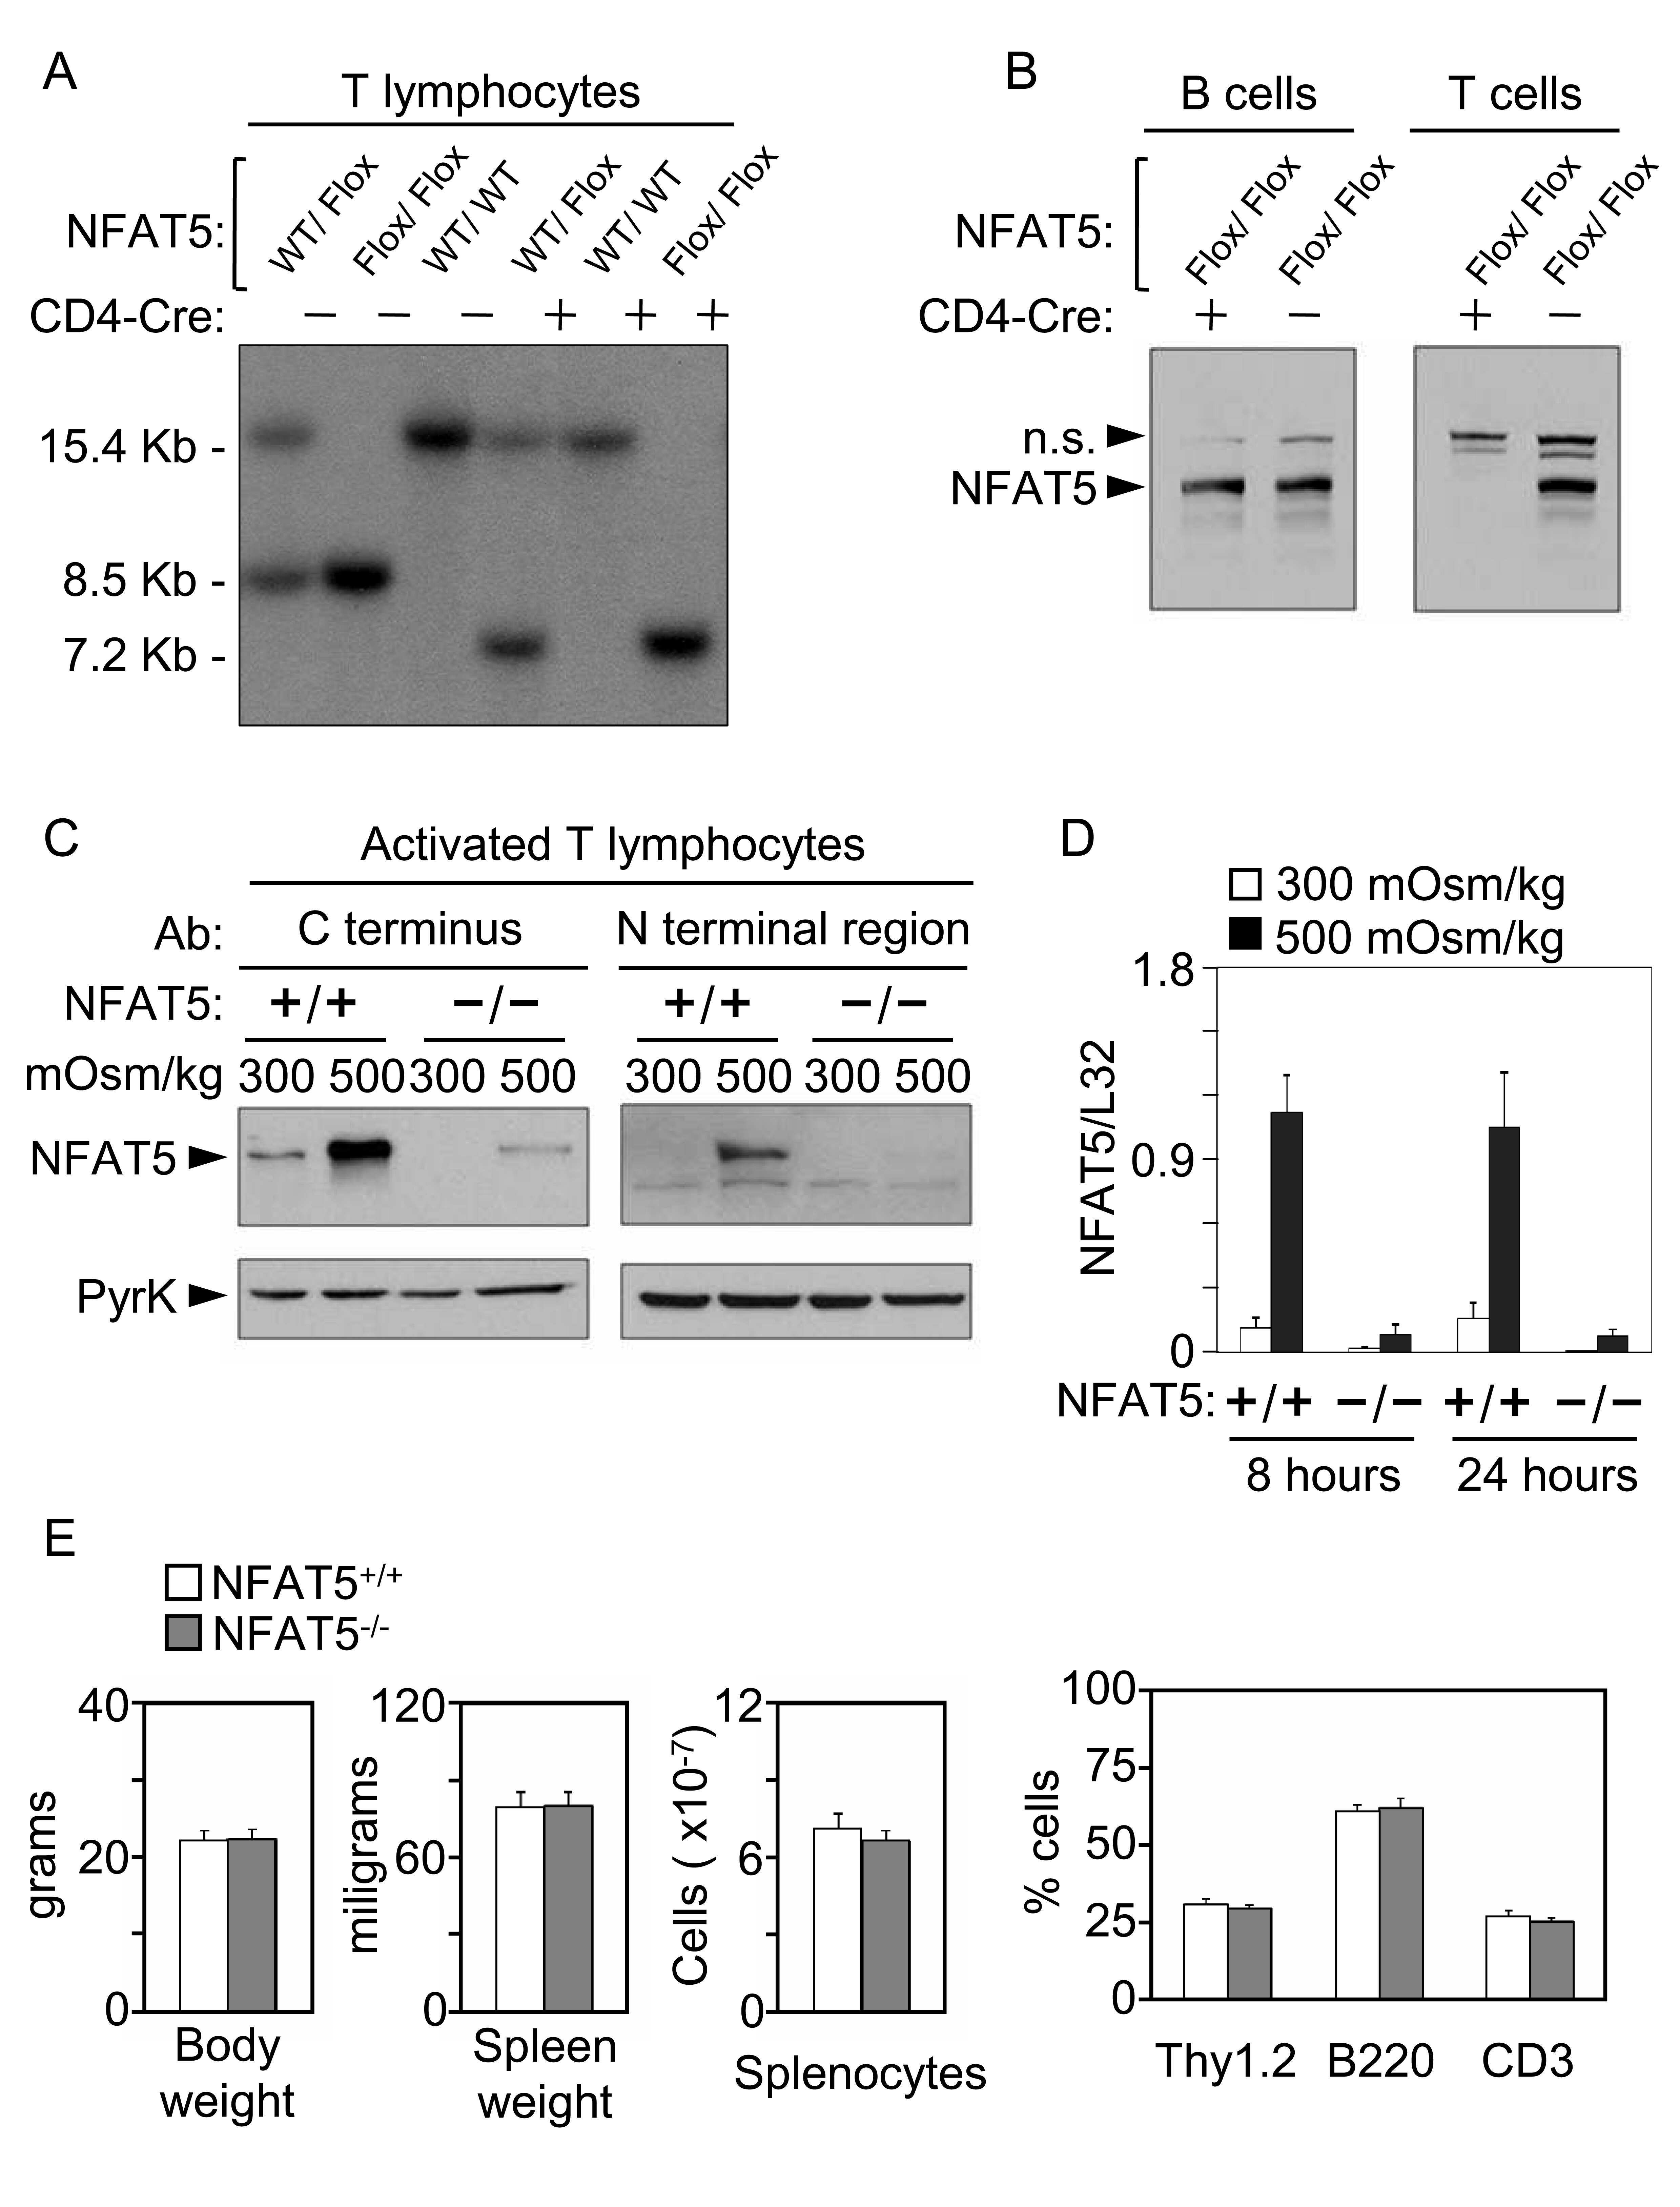
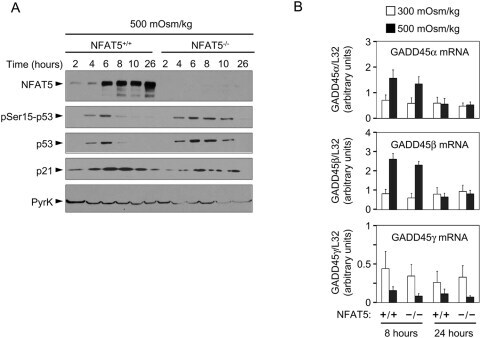
- Figure 2 Induction of p53, p21 and GADD45 in proliferating NFAT5 -/- lymphocytes exposed to hypertonic stress. A) Western blot shows the time course of p53-Ser15 phosphorylation, accumulation of total p53 and induction of p21 in NFAT5 +/+ and NFAT5 -/- cells in response to hypertonicity. The experiment shown is representative of three independently performed (see Fig. S4 ). B) RNA was isolated from NFAT5 +/+ and NFAT5 -/- proliferating T cells that were either maintained in isotonic conditions (300 mOsm/kg) or switched to hypertonic medium (500 mOsm/kg) for 8 and 24 hours. Relative mRNA abundance for each GADD45 isoform was determined by RT-qPCR and values were normalized to their respective L32 mRNA levels (bars are mean+-SEM of four independent experiments).
- Submitted by
- Invitrogen Antibodies (provider)
- Main image

- Experimental details
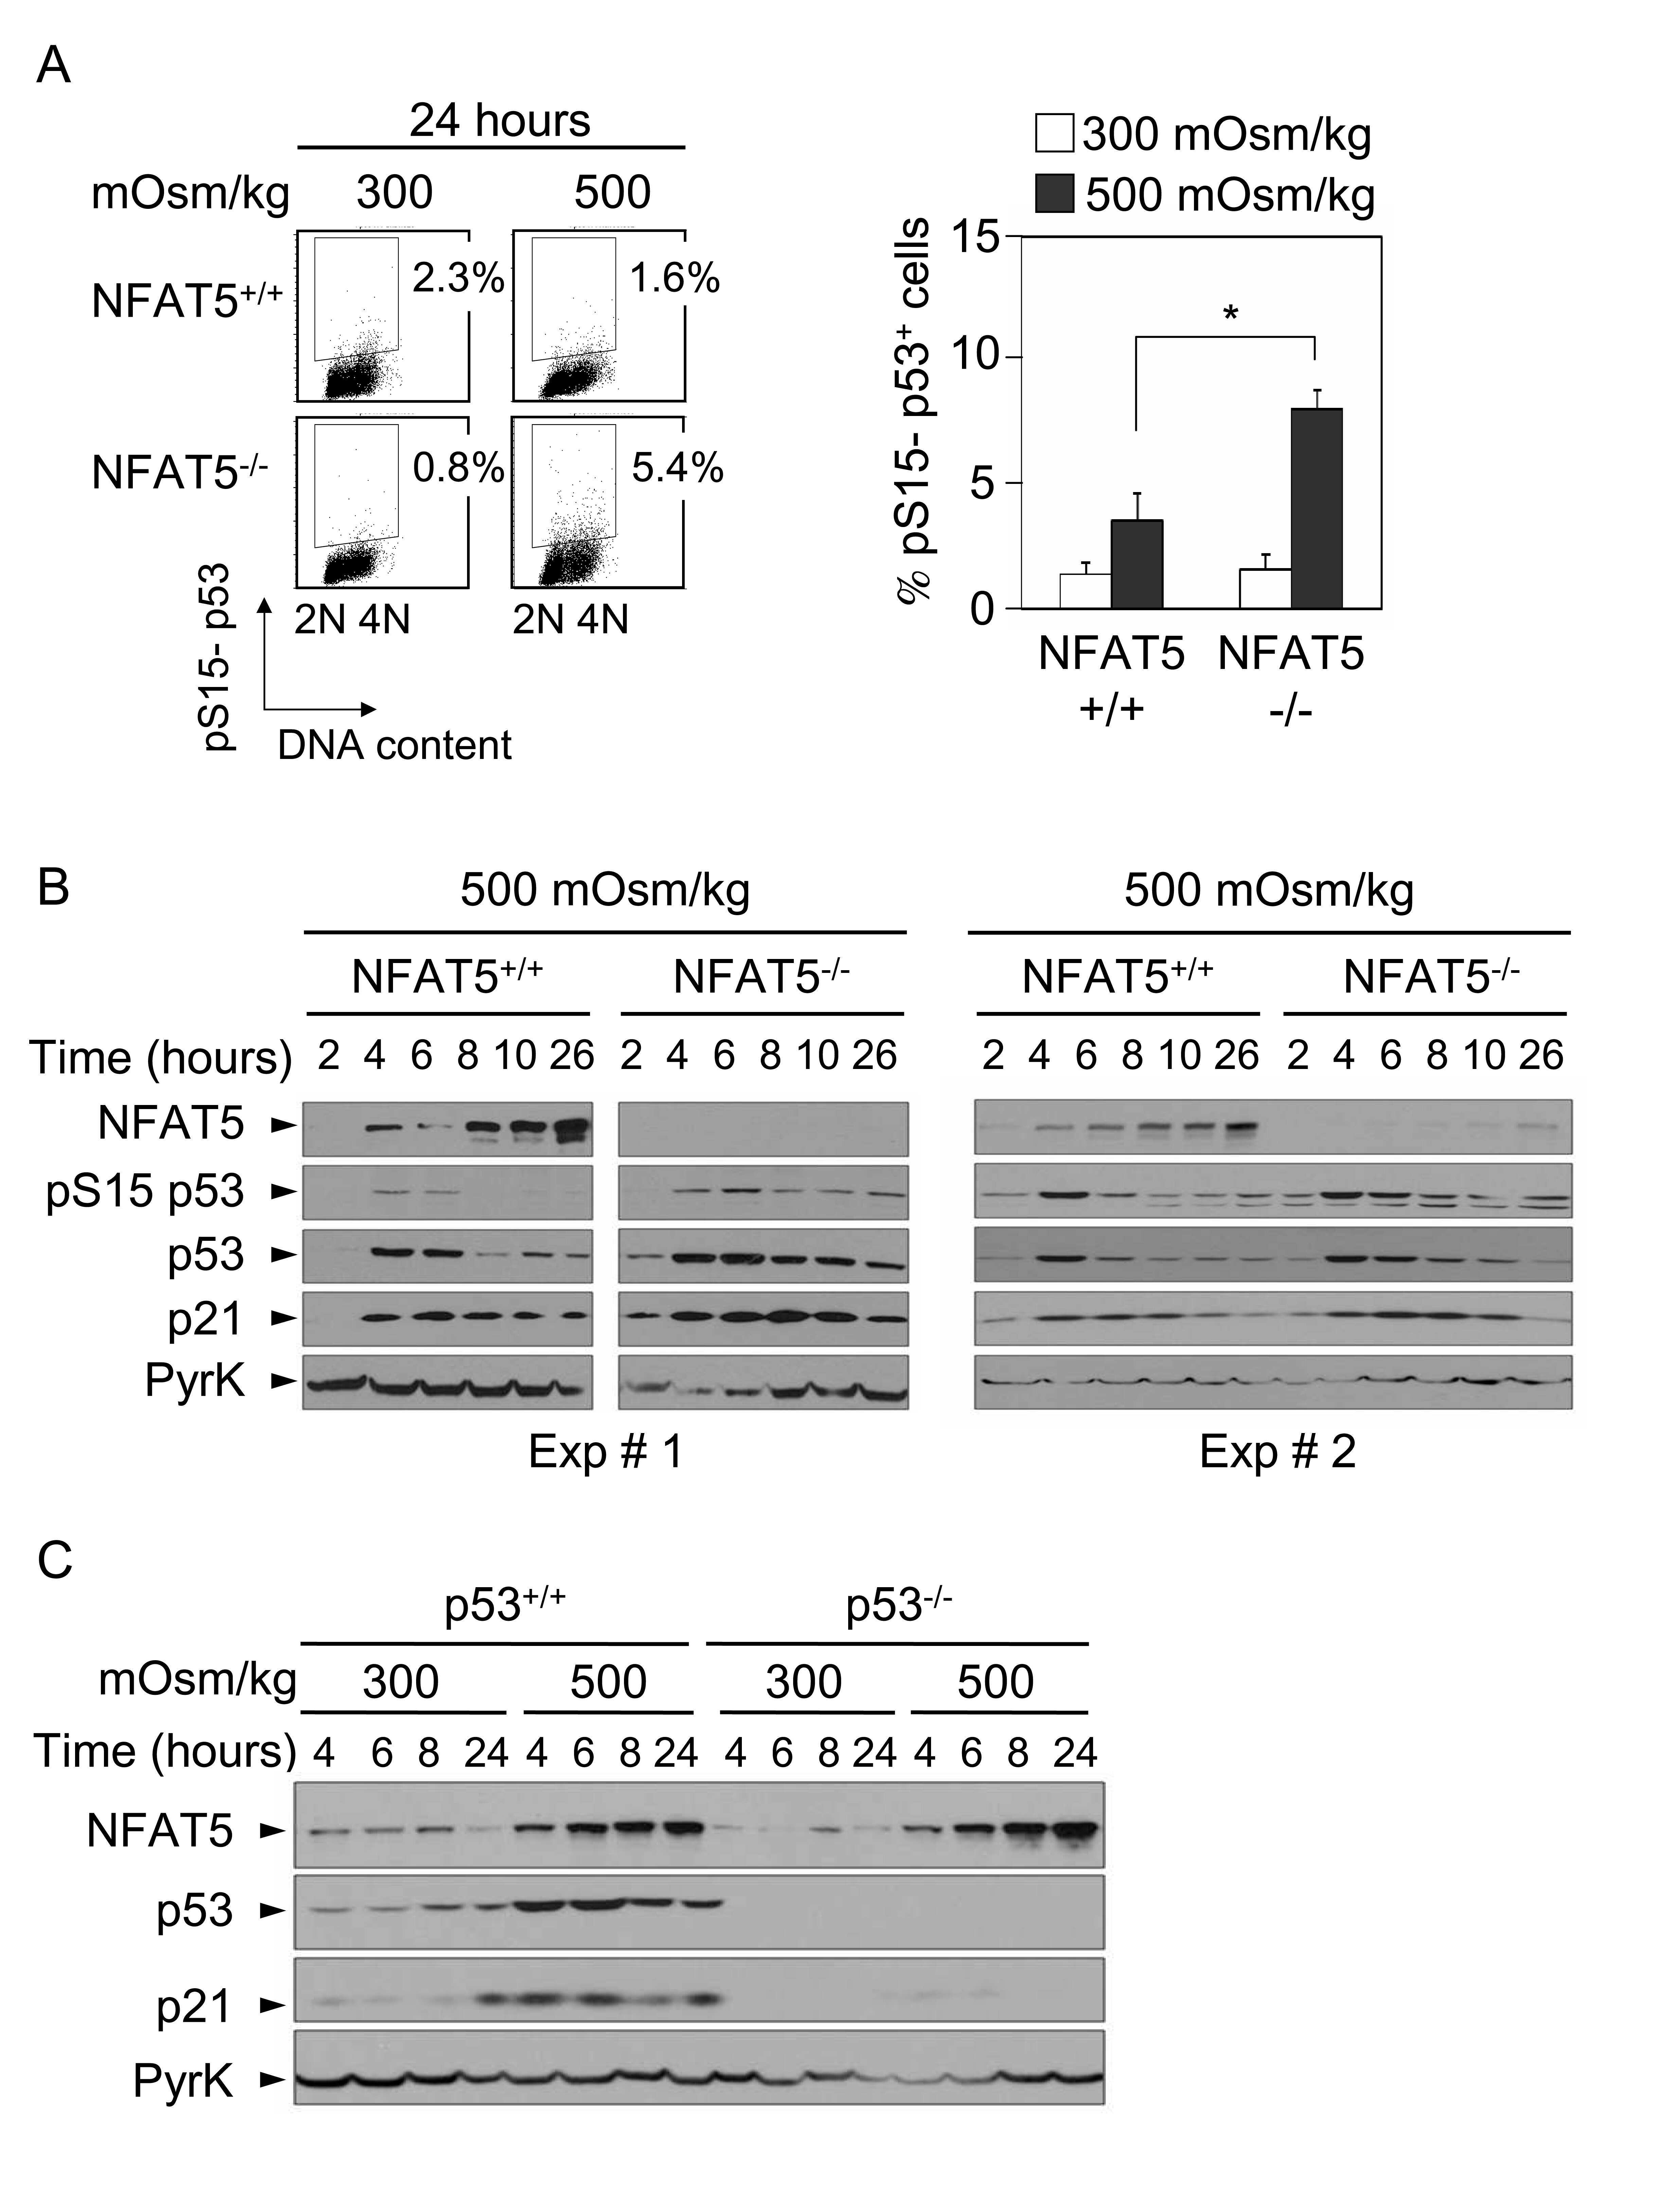
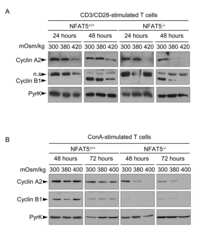
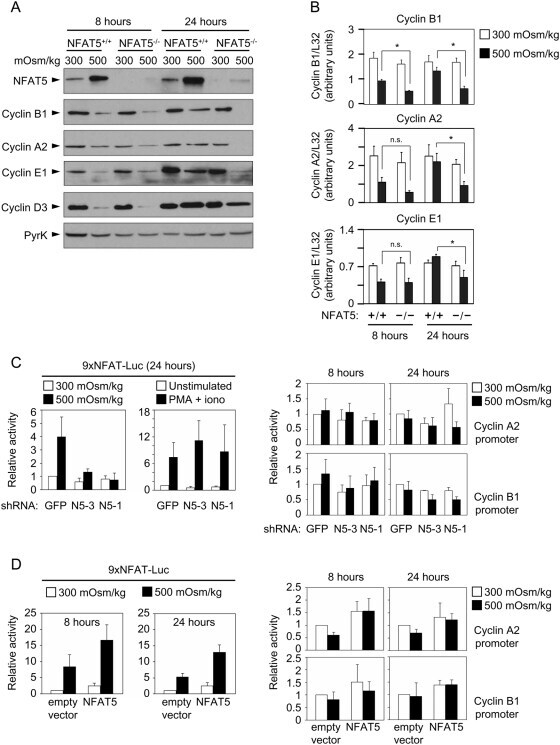
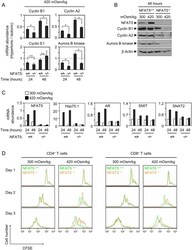
- Figure 4 Expression of cyclins in proliferating NFAT5 -/- T cells upon exposure to hypertonic conditions. A) Expression of cyclins D3, E1, A2 and B1 was analyzed by Western blot in lysates of proliferating NFAT5 +/+ and NFAT5 -/- T cells after 8 and 24 hours of hypertonicity treatment. Pyruvate kinase (PyrK) is shown as protein loading control. The result is representative of at least four independent experiments (see Fig. S5 ). B) mRNA abundance of cyclins was analyzed by RT-qPCR in proliferating NFAT5 +/+ and NFAT5 -/- T cells subjected to hypertonicity for 8 and 24 hours. Values were normalized to L32 mRNA levels in each respective sample (bars are the mean+-SEM of four independent experiments; * = p
- Submitted by
- Invitrogen Antibodies (provider)
- Main image
- Experimental details
- Figure 5 Expression and activity of NFAT5 throughout the cell cycle. A) Proliferating NFAT5 +/+ T cells cultured during 24 hours in isotonic (300 mOsm/kg) or hypertonic (500 mOsm/kg) conditions were labeled with Hoechst 33342 and sorted according to DNA content as G0/G1, S or G2/M phase. Cell cycle histograms in the left panel show the efficiency of the sorting. Sorted cells were lysed and equal amounts of protein from each lysate were analyzed by Western blot with anti-NFAT5 antibody. NFAT1 and anti-pyruvate kinase (PyrK) are shown as protein loading controls. The result is representative of three independent experiments. B) Transgenic 9xNFAT-Luc T cells were labeled with Hoechst 33342 and sorted after 8 and 24 hours of exposure to hypertonicity. Sorted cells were split for Western blot and luciferase activity assays. A representative Western blot analysis (upper panel) is shown of three independently performed. Pyruvate kinase (PyrK) is shown as protein loading control. 9xNFAT-Luc reporter activity normalized to endogenous LDH is shown in the lower panel. Results are the mean+-SEM of three independent experiments.

- Submitted by
- Invitrogen Antibodies (provider)
- Main image
- Experimental details
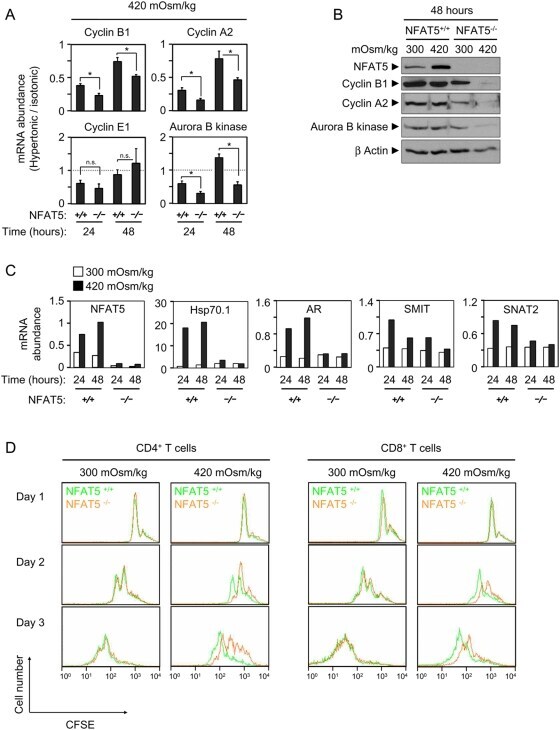
- Figure 6 Effect of pathologic hypertonicity on the induction of cyclins and aurora B kinase in response to T cell receptor stimulation in NFAT5 -/- T cells. A) Splenocytes were induced to proliferate with anti-CD3/CD28 antibodies plus IL-2 in isotonic or moderately hypertonic medium. Cultures were harvested at the indicated time points and depleted of B cells. RNA was isolated and analyzed by RT-qPCR. All values were normalized to each respective L32 mRNA level. Graphs represent the mRNA abundance of the indicated gene products in hypertonic relative to isotonic conditions. Values correspond to the mean+-SEM of three independent experiments (* = p
- Submitted by
- Invitrogen Antibodies (provider)
- Main image

- Experimental details
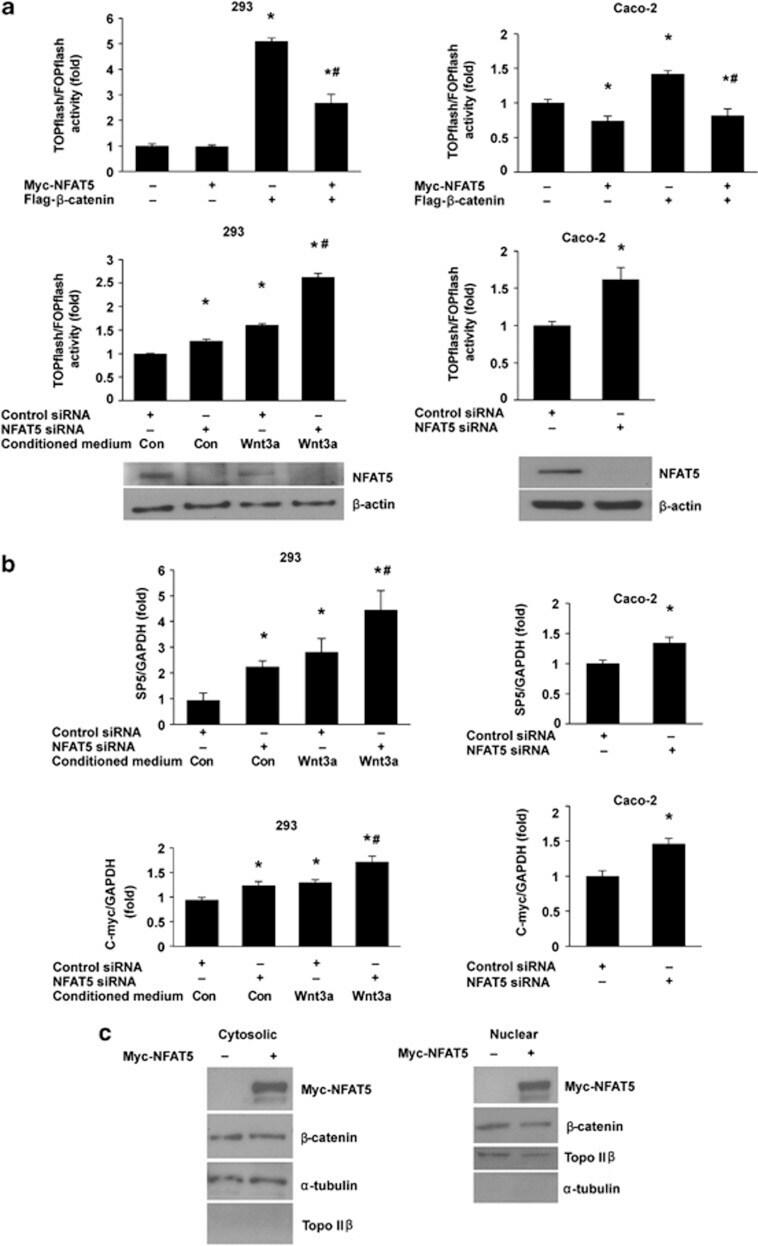
- Figure 1 NFAT5 regulates Wnt/ beta -catenin signaling. ( a ) Effects of NFAT5 on TCF/ beta -catenin reporter activity. HEK293 and Caco-2 cells were co-transfected with TOPflash reporter plasmid or FOPflash-negative control plasmid together with either empty vector, Myc-NFAT5 or Flag- beta -catenin alone or Myc-NFAT5 plus Flag- beta -catenin, and the transfected cells were incubated for 48 h (upper panels). HEK293 and Caco-2 cells were transfected with control siRNA or siRNA targeting NFAT5. After a 48-h incubation, cells were transfected with TOPflash reporter plasmid or FOPflash-negative control plasmid. Twenty-four hours after retransfection, cells were incubated with control-conditioned medium or Wnt3a-conditioned medium for additional 12 h (middle panels). Cells were harvested and luciferase activity was measured in the crude cell lysates, as described in Materials and Methods. All results were normalized for transfection efficiency using the pRL-Tk-luc plasmid (Promega). Fold induction corresponds to luciferase activity of positive TOPflash reporter over negative FOPflash reporter. (Data represent mean+-S.D.; * P
- Submitted by
- Invitrogen Antibodies (provider)
- Main image

- Experimental details
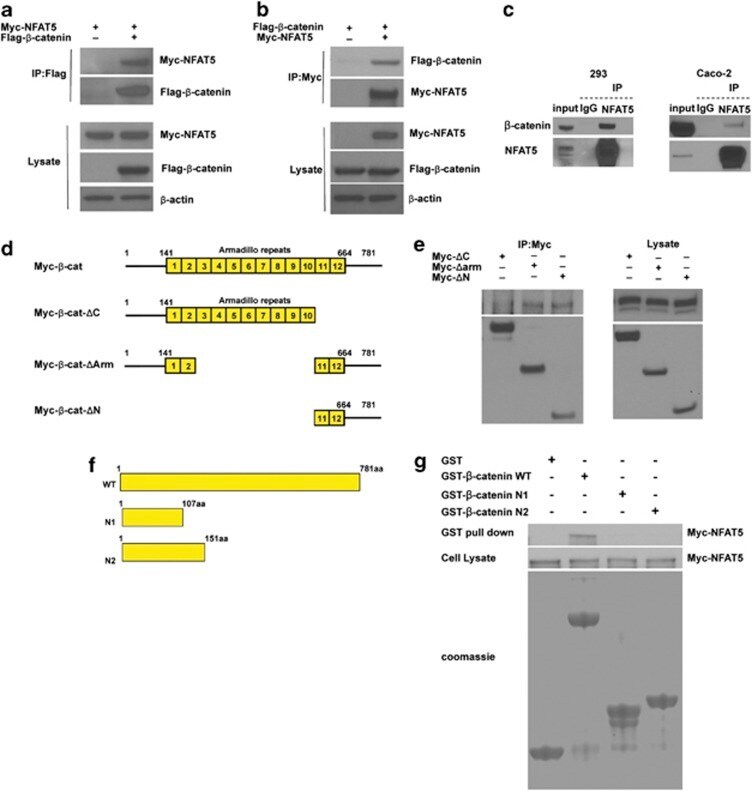
- Figure 2 NFAT5 interacts with beta -catenin. ( a and b ) NFAT5 interacts with beta -catenin. HEK293 cells were co-transfected with Myc-tagged NFAT5 and empty vector or Flag-tagged beta -catenin, and incubated for 48 h. After anti-Flag ( a ) or anti-Myc ( b ) immunoprecipitation, the presence of NFAT5 and beta -catenin were analyzed using anti-Myc and anti-Flag antibodies, respectively. Western blot was performed on cell lysate as a control. ( c ) Interaction between endogenous NFAT5 and beta -catenin. Endogenous NFAT5 was immunoprecipitated from HEK293 or Caco-2 cells, and Western blot was performed on the eluate. IgG was used as a negative control. ( d ) Schematic diagram of beta -catenin deletion constructs. The yellow boxes are armadillo repeats. ( e ) C-terminal-transactivating domains of beta -catenin bind NFAT5. HEK293 cells were co-transfected with Myc-tagged beta -catenin deletion mutants. Myc-tagged beta -catenin mutants were immunoprecipitated using an anti-Myc antibody. Expression of NFAT5 was analyzed by western blot with an anti-NFAT5 antibody. The expression of these beta -catenin mutants was analyzed by western blot with an anti-Myc antibody. Western blot was performed on cell lysate as a control. ( f ) Schematic diagram of the wild-type and mutant derivatives of GST- tagged beta -catenin. ( g ) NFAT5 directly interacts with beta -catenin. HEK293 cells were transfected with Myc-NFAT5 and after 48 h incubation, lysate was collected and incubated with the GST pro
- Submitted by
- Invitrogen Antibodies (provider)
- Main image

- Experimental details
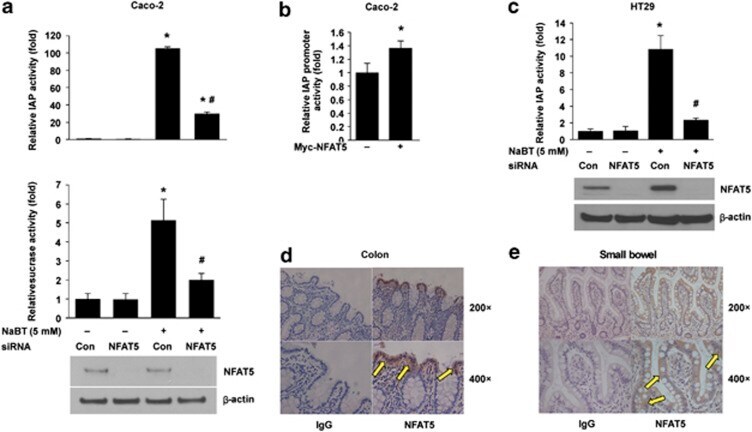
- Figure 5 NFAT5 regulation of intestinal cell differentiation. ( a ) Knockdown of NFAT5 attenuated NaBT-induced IAP and sucrase activities in Caco-2 cells. Caco-2 cells were transfected with control siRNA or siRNA targeting NFAT5. After a 24-h incubation, transfected cells were treated with NaBT (5 mM) for additional 72 h. Cells were lysed and alkaline phosphatase and sucrase activities were determined. (Data represent mean+-S.D.; * P
- Submitted by
- Invitrogen Antibodies (provider)
- Main image
- Experimental details
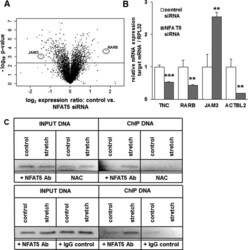
- Figure 11. Transcriptional targets of NFAT5 upon biomechanical stretch. Volcano plot analysis of transcriptome changes (fold expression level vs calculated probability value) in HUASMCs transfected with control or NFAT5 siRNA shows nearly 2000 differently regulated genes for P

- Submitted by
- Invitrogen Antibodies (provider)
- Main image
- Experimental details
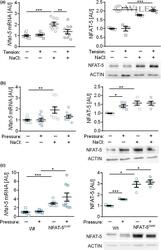
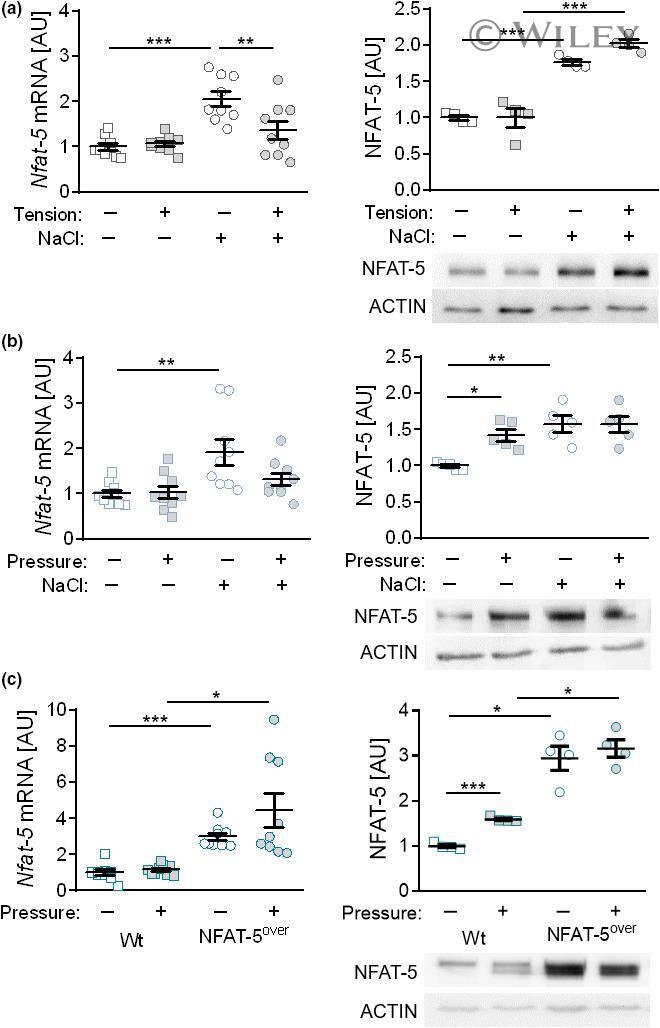
- 3 Figure NFAT-5 gene and protein expression after (a) tensile strain or (b) compressive strain of RAW264.7 macrophages during normal or high salt (NaCl) conditions for 4 h. (c) NFAT-5 gene and protein expression in RAW264.7 macrophages [wild type (Wt)] or NFAT-5-overexpressing macrophages (NFAT-5 over ). One representative immunoblot each. Data were analyzed by ANOVA followed by Holm-Sidak or Games-Howell multiple comparison tests. AU, arbitrary units; mRNA, messenger RNA; NFAT-5, nuclear factor of activated T cells-5; * P < 0.05; ** P < 0.01; *** P < 0.001.
- Submitted by
- Invitrogen Antibodies (provider)
- Main image
- Experimental details
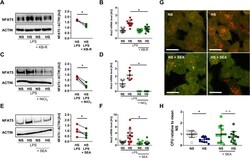
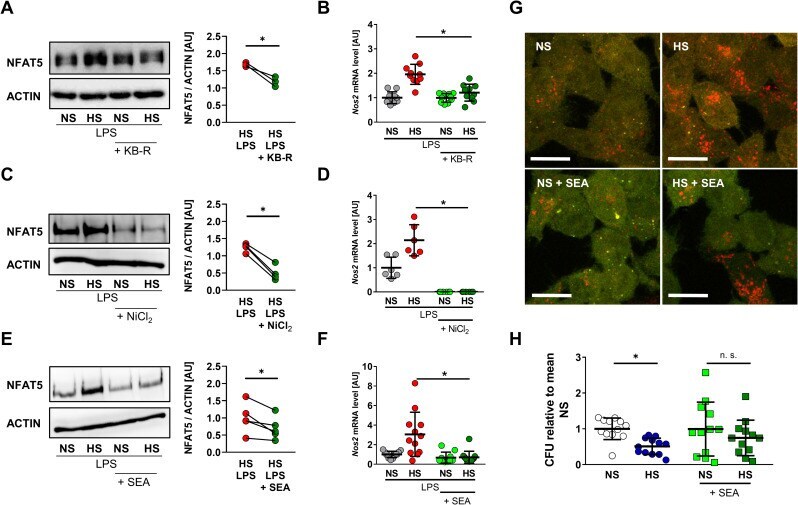
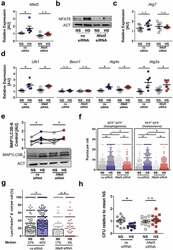
- Fig 7 Pharmacological inhibition of NCX activity blocks HS-boosted MPhi activity. (A) Immunoblotting and densitometry of NFAT5 6 h after LPS +- HS in RAW264.7 MPhis +- KB-R pretreatment ( n = 3; paired t test; * p < 0.05). (B) Nos2 levels in RAW264.7 MPhis 4 h after LPS +- HS +- KB-R pretreatment (means +- SD; n = 10; Student t test; * p < 0.05). (C) Immunoblotting and densitometry of NFAT5 in RAW264.7 MPhis 4 h after LPS +- HS +- NiCl 2 pretreatment ( n = 4; paired t tests; * p < 0.05). (D) Nos2 levels in RAW264.7 MPhis 4 h after LPS +- HS +- NiCl 2 pretreatment (means +- SD; n = 6; Student t test + Welch correction; * p < 0.05). (E) Immunoblotting and densitometry of NFAT5 in RAW264.7 MPhis 4 h after LPS +- HS +- SEA pretreatment ( n = 5; paired t test; * p < 0.05). (F) Nos2 in RAW264.7 MPhis 4 h after LPS +- HS +- SEA pretreatment (means +- SD; n = 10-12; Mann-Whitney test; * p < 0.05). (G) RFP-GFP-mLC3 RAW264.7 MPhis were infected with Escherichia coli +- HS +- SEA pretreatment. Representative images 2 h after infection (RFP: red; GFP: green; scale bar: 10 mum). (H) Relative E . coli load at 2 h after infection of RAW264.7 MPhis +- HS +- SEA pretreatment (means +- SD; n = 12; Student t tests; * p < 0.05). For numerical raw data, please see S1 Data . For raw immunoblots, please see S1 Blots . CFU, colony forming unit; GFP, green fluorescent protein; HS, high salt; KB-R, KB-R7943 mesylate; LPS, lipopolysaccharide; mLC3, microtubule-associated protein 1 light chain 3; MPhi,
- Submitted by
- Invitrogen Antibodies (provider)
- Main image

- Experimental details
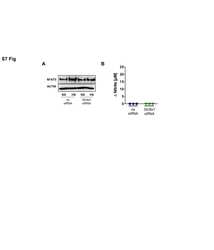
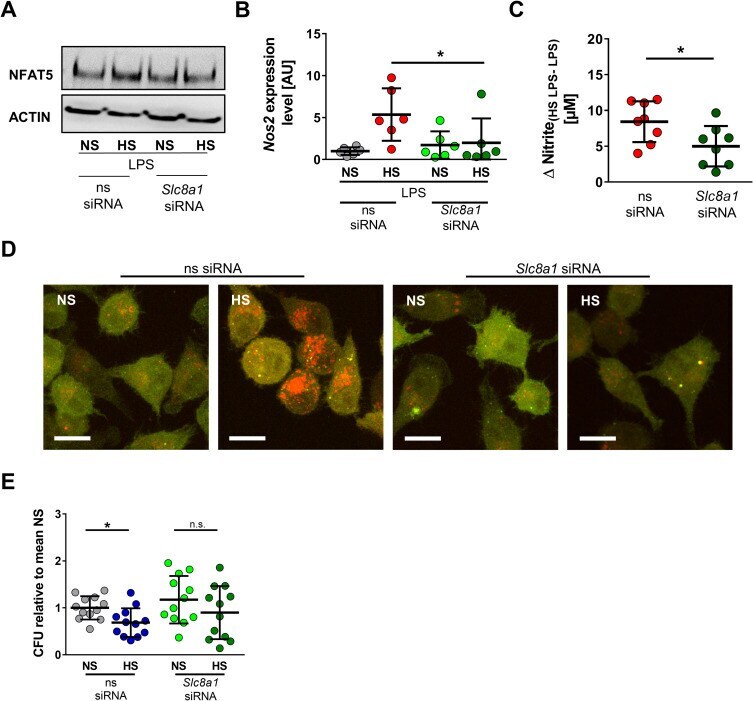
- Fig 9 Slc8a1 silencing abrogates HS-augmented MPhi activity. (A) ns siRNA and Slc8a1 siRNA RAW264.7 were treated with LPS +- HS. Representative NFAT5 and ACTIN immunoblot 4 h after stimulation from two experiments. (B) As in (A), but Nos2 in BMDMs 4 h after LPS +- HS (means +- SD; n = 6; Mann-Whitney test; * p < 0.05). (C) As in (B), but Delta nitrite HS LPS-LPS after 24 h (means +- SD; n = 8; Student t test). (D) ns siRNA and Slc8a1 siRNA-treated RFP-GFP-mLC3 RAW264.7 MPhis were infected with E . coli +- HS. Representative images 2 h after infection from three experiments (RFP: red; GFP: green; scale bar: 10 mum). (E) ns siRNA and Slc8a1 siRNA-treated BMDMs were infected with E . coli +- HS. E . coli load at 2 h infection (means +- SD; n = 12; Student t tests; * p < 0.05). For numerical raw data, please see S1 Data . For raw immunoblots, please see S1 Blots . BMDM, bone marrow-derived MPhi; CFU, colony forming unit; GFP, green fluorescent protein; HS, high salt; LPS, lipopolysaccharide; mLC3, microtubule-associated protein 1 light chain 3; MPhi, monocyte/macrophage-like cell; NFAT5, nuclear factor of activated T cells 5; Nos2 , nitric oxide synthase 2; NS, normal salt; ns, nonsilencing; n.s., not significant; RFP, red fluorescent protein; siRNA, small interfering RNA; Slc8 , solute carrier family 8.
- Submitted by
- Invitrogen Antibodies (provider)
- Main image
- Experimental details
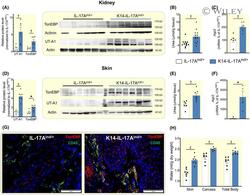
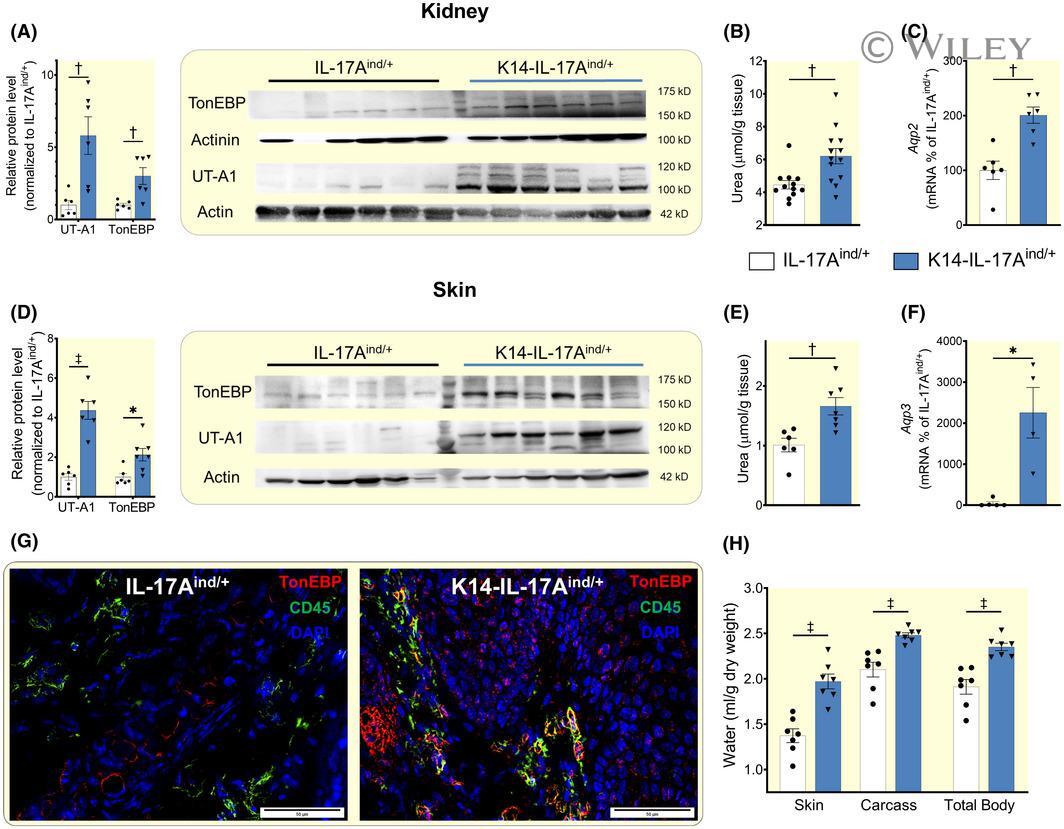
- 3 FIGURE K14-IL-17A ind/+ mice utilize urea- and water transport mechanisms in kidney and skin to successfully prevent body dehydration. A, Urea transporter A1 (UT-A1) and tonicity enhancer binding protein (TonEBP) protein expression in the kidney of IL-17A ind/+ (n = 6) and K14-IL-17A ind/+ mice (n = 6). B, Urea content in the kidney of IL-17A ind/+ (n = 12) and K14-IL-17A ind/+ mice (n = 12). C, Expression of Aquaporin 2 mRNA in kidneys of IL-17A ind/+ (n = 5) and K14-IL-17A ind/+ mice (n = 5). D, UT-A1 and TonEBP protein expression in the skin of IL-17A ind/+ (n = 6) and K14-IL-17A ind/+ mice (n = 6). E, Urea content in skin of IL-17A ind/+ (n = 6) and K14-IL-17A ind/+ mice (n = 6). F, Expression of Aquaporin 3 mRNA in skin of IL-17A ind/+ (n = 5) and K14-IL-17A ind/+ mice (n = 5). G, Immunofluorescence stained skin sections from healthy IL-17A ind/+ control and psoriatic K14-IL-17A ind/+ mice (red: TonEBP; green: CD-45; blue: DAPI). Scale bars equal 50 um. (H) Tissue water content in skin, carcass and whole body of IL-17A ind/+ (n = 7) and K14-IL-17A ind/+ (n = 7) animals. For additional data about total body and tissue water see Online Table S2. Data analysis by Student's t test for independent samples. Data are shown as mean +- SEM. * P < .05; + P < .01; ++ P < .001
- Submitted by
- Invitrogen Antibodies (provider)
- Main image
- Experimental details
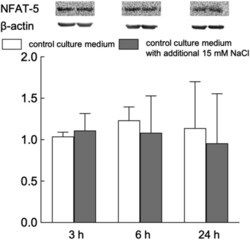
- Figure 7 Representative Western blots and relative content of NFAT5 in HUVEC exposed to normal- and elevated-sodium medium for 3, 6 and 24 h. The content of proteins in control cells was taken as 1.0. Data obtained in three independent experiments are reported as means +- S.E. Figure 7

- Submitted by
- Invitrogen Antibodies (provider)
- Main image
- Experimental details
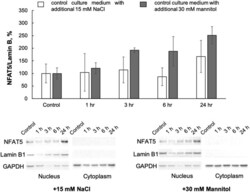
- Figure 8 Representative Western blots and relative cytosol and nuclear content of NFAT5 and Lamin B1 in HUVEC exposed to normal- and elevated-sodium medium for 1, 3, 6 and 24 h. The content of proteins in control cells was taken as 1.0. Data obtained in three independent experiments are reported as means +- S.E. Figure 8

- Submitted by
- Invitrogen Antibodies (provider)
- Main image
- Experimental details
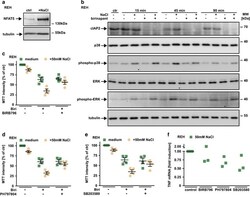
- Figure 6 TNF production under hypertonic conditions involves p38 and NFAT5. ( a ) REH cells were cultured in the presence and absence of 50 mM NaCl for 16 h. Cells were washed, lysed and subsequently analyzed using western blotting with antibodies specific for the indicated proteins. ( b ) REH cells were challenged with 1.25 mu M birinapant in the presence and absence of 50 mM NaCl for the indicated periods of time. Subsequently, cells were lysed and analyzed by western blot for the indicated proteins. The asterisks (*) in the phospho-p38, ERK and phospho-ERK blots indicate a defect in the CCD sensor of the western Blot imaging system. All samples were run on the same gel, no gels were sliced. ( c - e ) REH cells were challenged with 2.5 mu M birinapant under isotonic (medium) or hypertonic (+50 mM NaCl) conditions in the presence and absence of the p38 inhibitors BIRB796, PH797804 and SB203580 (5 mu M). Shown are data points and mean+-S.E.M. from four independent experiments. ( f ) REH cells were challenged with 50 mM NaCl for 210 min in the presence and absence of the p38 inhibitors BIRB796, PH797804 and SB203580 (5 mu M). Tnf mRNA induction was analyzed by qPCR. Data points of three independent experiments are shown. Biri, birinapant

- Submitted by
- Invitrogen Antibodies (provider)
- Main image
- Experimental details
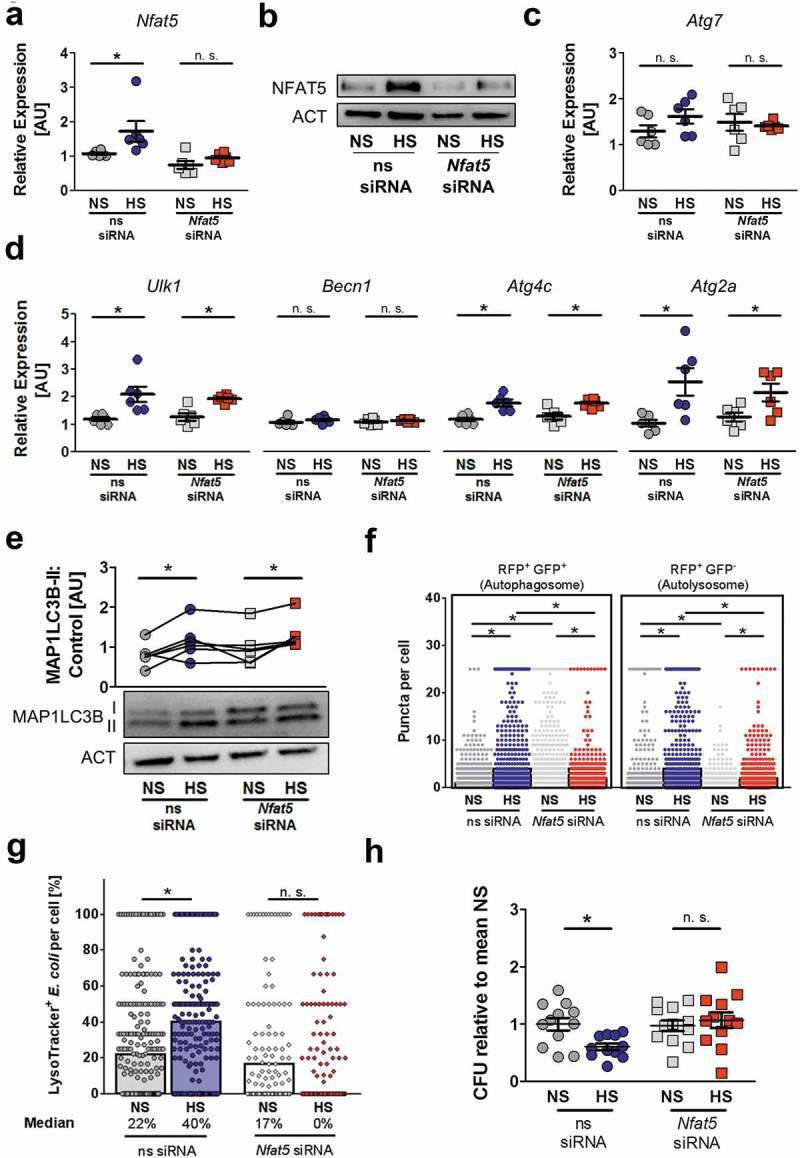
- Figure 7. NFAT5 is required for HS-facilitated targeting of intracellular E. coli to autolysosomes. (a to d) As in Figure 1(f ), but non-silencing siRNA (ns siRNA) and Nfat5 -specific siRNA ( Nfat5 siRNA)-treated RAW264.7 MPhi were used. (a) Nfat5 mRNA levels (means +- s.e.m; n = 6; Student's t test or Mann-Whitney test, * p < 0.05). (b) Immunoblotting of NFAT5 and ACT. (c) As (a), but Atg7 mRNA levels (means +- s.e.m; n = 6; Student's t test +- Welch correction). (d) As (a), but Ulk1, Becn1, Atg4c and Atg2a mRNA levels (means +- s.e.m; n = 6; Student's t test +- Welch correction; * p < 0.05). (e) Immunoblotting and densitometry of MAP1LC3B/LC3 and ACT 1/2 h after infection (n = 6; paired Student's t test or Wilcoxon signed rank test; * p < 0.05). (f) As in Figure 1(f ), but ns siRNA- and Nfat5 siRNA-treated RFP-GFP-mLC3 RAW264.7 MPhi were used. RFP+ and RFP+GFP+-puncta were counted per cell. At least 290 cells from two independent experiments (bars: median scores; Kruskal Wallis test with Dunn's Multiple Comparison Test, * p < 0.05). (g) As Figure 1(f ), but RAW264.7 MPhi were used and stained with LysoTracker. Colocalization of sfGFP- E. coli and LysoTracker per cell. At least 101 cells from at least two independent experiments (bars: median scores; Kruskal Wallis test with Dunn's Multiple Comparison Test, * p < 0.05). (h) As in Figure 1(a ), but ns siRNA- and Nfat5 siRNA-treated RAW264.7 MPhi were used. Intracellular E. coli load in CFU relative to mean CFU under NS condit
- Submitted by
- Invitrogen Antibodies (provider)
- Main image
- Experimental details
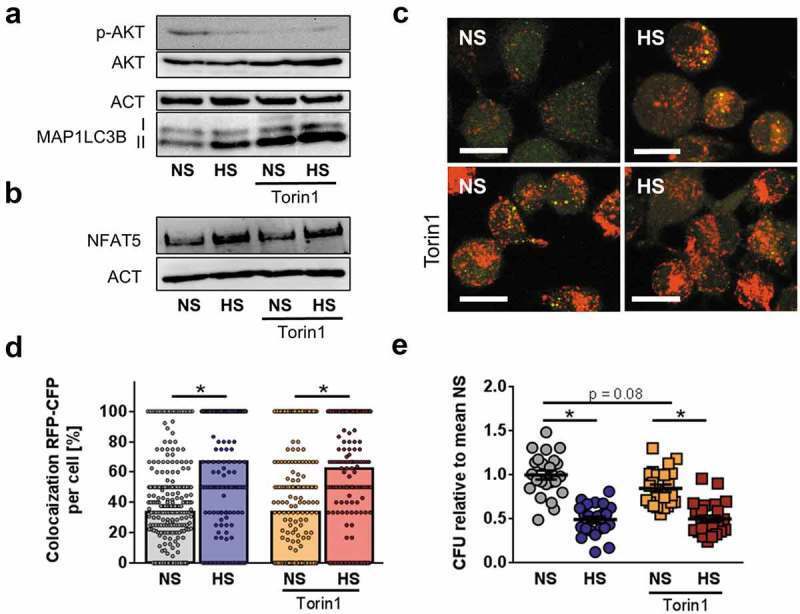
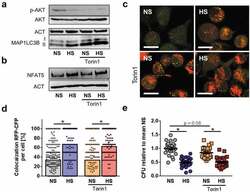
- Figure 8. Blunted AKT and MTOR activation does not account for HS-augmented antibacterial activity. (a) As in Figure 1(f ), RAW264.7 MPhi were pretreated +- 1 uM Torin1 and infected +- HS. Cells were harvested 1/2 h post infection. Immunoblots of p-AKT, AKT, MAP1LC3B and ACT levels are displayed. (b) As in (a), but 2 h post infection, NFAT5 and ACT levels were assessed. (c) As in (b), but RFP-GFP-mLC3 RAW264.7 MPhi were used. A representative confocal image out of two experiments is shown. Scale bar = 10 um. (d) As in (c), but sCFP3A- E. coli were used. Rate of E. coli- sCFP3A / RFP-colocalization per cell. At least 184 MPhi from two independent experiments (bars: median scores; Mann Whitney test; * p < 0.05). (e) As in (b), but intracellular E. coli load is displayed 2 h after infection in CFU relative to mean CFU under NS conditions (means +- s.e.m; n = 23-24; ANOVA with Bonferroni's test; * p < 0.05).