Explore
 Validate
 Learn
Learn Flow cytometry
Antibody data
- Antibody Data
- Antigen structure
- References [2]
- Comments [0]
- Validations
- Flow cytometry [1]
- Other assay [1]
Submit
Validation data
Reference
Comment
Report error
- Product number
- 48-3369-42 - Provider product page

- Provider
- Invitrogen Antibodies
- Product name
- CD336 (NKp44) Monoclonal Antibody (44.189), eFluor™ 450, eBioscience™
- Antibody type
- Monoclonal
- Antigen
- Other
- Description
- Description: The monoclonal antibody 44.189 reacts with human CD336, which is also known as NKp44 or NCR2. CD336 is a 44-kDa transmembrane glycoprotein belonging to the natural cytotoxicity receptor (NCR) family and contains an ITIM domain located in the cytoplasmic tail. Expression of CD336 and NK cell activation by the receptor requires association with DAP12, an ITAM-containing transmembrane accessory protein. Once thought to be expressed exclusively on IL-2-activated NK cells and a subset of gamma delta T lymphocytes, studies have shown expression of CD336 on IL-3-stimulated plasmacytoid dendritic cells, alpha beta T cells in the small intestinal epithelium, and T cells in cord blood. CD336 has been shown to be involved in the innate response of activated NK cells against viral infection and tumor cell proliferation. The 44.189 antibody has been reported to facilitate CD336 crosslinking. Applications Reported: This 44.189 antibody has been reported for use in flow cytometric analysis. Applications Tested: This 44.189 antibody has been pre-titrated and tested by flow cytometric analysis of stimulated normal human peripheral blood cells. This can be used at 5 µL (1.0 µg) per test. A test is defined as the amount (µg) of antibody that will stain a cell sample in a final volume of 100 µL. Cell number should be determined empirically but can range from 10^5 to 10^8 cells/test. eFluor® 450 is an alternative to Pacific Blue®. eFluor® 450 emits at 445 nm and is excited with the Violet laser (405 nm). Please make sure that your instrument is capable of detecting this fluorochome. Excitation: 405 nm; Emission: 445 nm; Laser: Violet Laser. Filtration: 0.2 µm post-manufacturing filtered.
- Reactivity
- Human
- Host
- Mouse
- Isotype
- IgG
- Antibody clone number
- 44.189
- Vial size
- 100 Tests
- Concentration
- 5 μL/Test
- Storage
- 4°C, store in dark, DO NOT FREEZE!
Submitted references Addition of BTK inhibitor orelabrutinib to rituximab improved anti-tumor effects in B cell lymphoma.
Vagal Regulation of Group 3 Innate Lymphoid Cells and the Immunoresolvent PCTR1 Controls Infection Resolution.
Yu H, Wang X, Li J, Ye Y, Wang D, Fang W, Mi L, Ding N, Wang X, Song Y, Zhu J
Molecular therapy oncolytics 2021 Jun 25;21:158-170
Molecular therapy oncolytics 2021 Jun 25;21:158-170
Vagal Regulation of Group 3 Innate Lymphoid Cells and the Immunoresolvent PCTR1 Controls Infection Resolution.
Dalli J, Colas RA, Arnardottir H, Serhan CN
Immunity 2017 Jan 17;46(1):92-105
Immunity 2017 Jan 17;46(1):92-105
No comments: Submit comment
Supportive validation
- Submitted by
- Invitrogen Antibodies (provider)
- Main image

- Experimental details
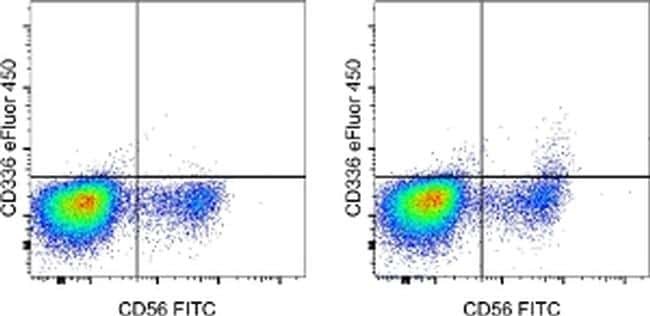
- Normal human peripheral blood cells were stimulated with Human IL-2 Recombinant Protein (Product # 14-8029-81) for 15 days, then surface stained with Anti-Human CD56 (NCAM) FITC (Product # 11-0566-42) and Mouse IgG2b K Isotype Control eFluor® 450 (Product # 48-4732-82) (left) or Anti-Human CD336 (NKp44) eFluor® 450 (right). Viable cells in the lymphocyte gate, as determined by Fixable Viability Dye eFluor® 660 (Product # 65-0864-14), were used for analysis.
Supportive validation
- Submitted by
- Invitrogen Antibodies (provider)
- Main image
- Experimental details
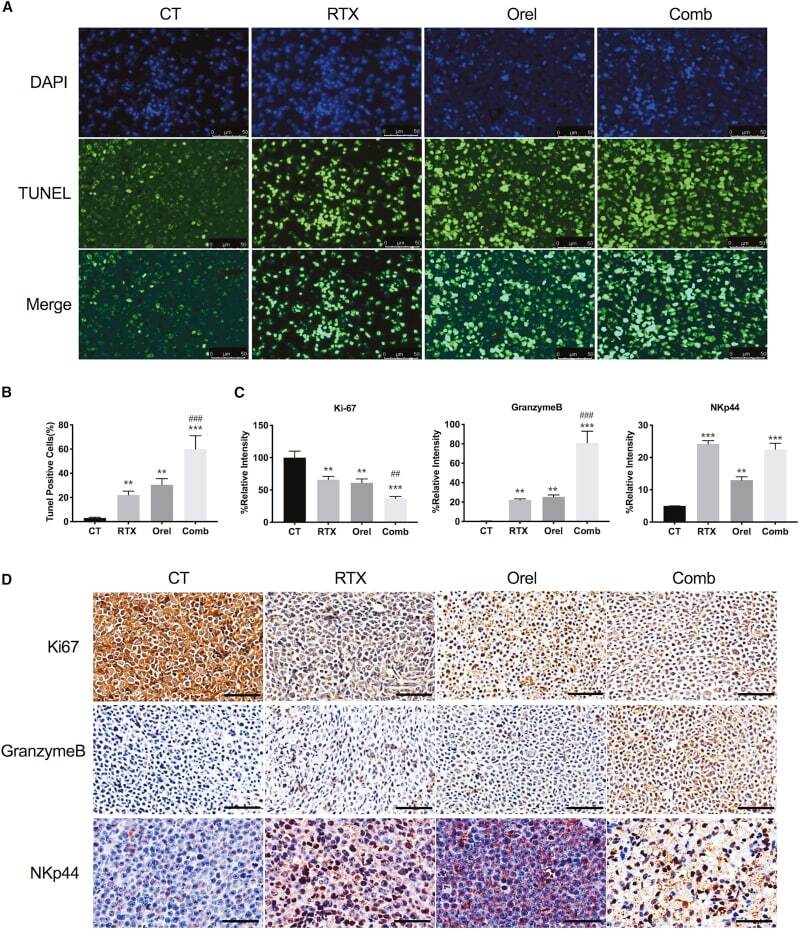
- Figure 6 Combined effects of orelabrutinib and rituximab in vivo (A and B) Apoptosis of tumor tissues from TMD8 tumor model was assessed by the terminal deoxynucleotidyl transferase nick-end-labeling (TUNEL) assay, and the nuclei were counterstained with DAPI. Representative images show apoptotic (fragmented) DNA (green staining) and the corresponding cell nuclei (blue) staining. Scale bar: 50 mum. Results are expressed as mean +- SD (n = 3 biologically independent samples). (C and D) Ki67, granzyme B, and NKp44 were assessed by immunohistochemistry of TMD8 tumor tissue. Scale bar: 60 mum. The data show the density of positivity cells for each section. Student's t test was performed for statistical analysis. Values present as percentages of control group in mean +- SD (n = 3 biologically independent samples), **p < 0.01 compared with control group, and ***p < 0.001 compared with control group; ##p < 0.01 compared with rituximab group and ###p < 0.001 compared with rituximab group.