Explore
 Validate
 Learn
Learn Western blot
 Immunocytochemistry
Antibody data
- Antibody Data
- Antigen structure
- References [1]
- Comments [0]
- Validations
- Immunocytochemistry [1]
- Immunohistochemistry [3]
- Flow cytometry [2]
- Other assay [1]
Submit
Validation data
Reference
Comment
Report error
- Product number
- MA5-32006 - Provider product page

- Provider
- Invitrogen Antibodies
- Product name
- IFNAR1 Recombinant Rabbit Monoclonal Antibody (SR45-08)
- Antibody type
- Monoclonal
- Antigen
- Synthetic peptide
- Description
- Recombinant rabbit monoclonal antibodies are produced using in vitro expression systems. The expression systems are developed by cloning in the specific antibody DNA sequences from immunoreactive rabbits. Then, individual clones are screened to select the best candidates for production. The advantages of using recombinant rabbit monoclonal antibodies include: better specificity and sensitivity, lot-to-lot consistency, animal origin-free formulations, and broader immunoreactivity to diverse targets due to larger rabbit immune repertoire.
- Reactivity
- Human, Mouse, Rat
- Host
- Rabbit
- Isotype
- IgG
- Antibody clone number
- SR45-08
- Vial size
- 100 μL
- Concentration
- 1 mg/mL
- Storage
- Store at 4°C short term. For long term storage, store at -20°C, avoiding freeze/thaw cycles.
Submitted references 5-Fluorouracil efficacy requires anti-tumor immunity triggered by cancer-cell-intrinsic STING.
Tian J, Zhang D, Kurbatov V, Wang Q, Wang Y, Fang D, Wu L, Bosenberg M, Muzumdar MD, Khan S, Lu Q, Yan Q, Lu J
The EMBO journal 2021 Apr 1;40(7):e106065
The EMBO journal 2021 Apr 1;40(7):e106065
No comments: Submit comment
Supportive validation
- Submitted by
- Invitrogen Antibodies (provider)
- Main image

- Experimental details
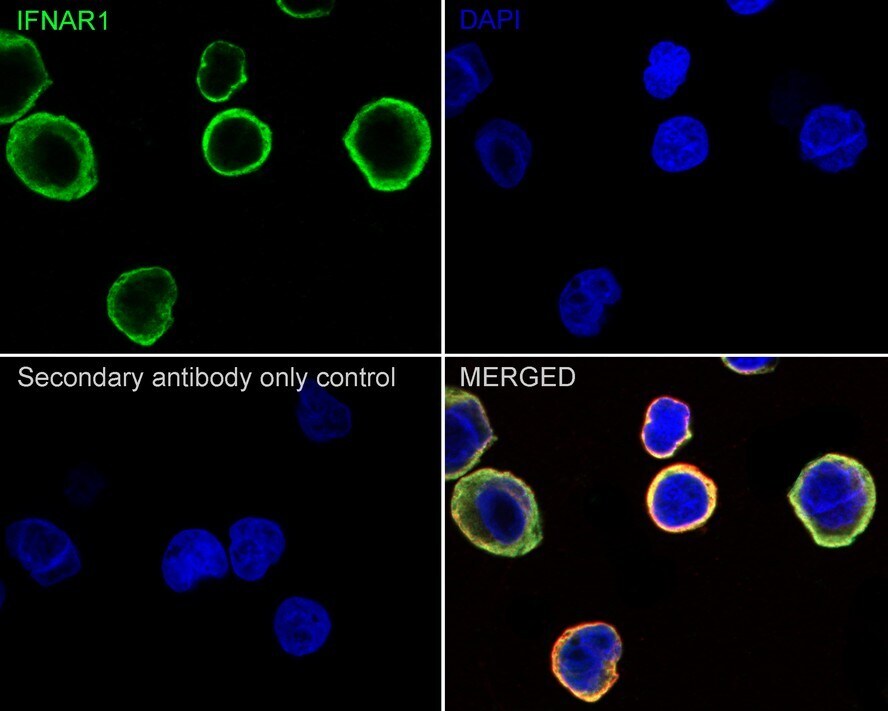
- Immunocytochemistry analysis of IFNAR1 with Jurkat cells. Cells were fixed in 4% paraformaldehyde (20 min, room temp), permeabilized with 0.1% Triton X-100 in PBS (5 min, room temp), then blocked with 1% BSA in 10% negative goat serum (1 hr, room temp), incubated with recombinant monoclonal IFNAR1 (Product # MA5-32006) at a dilution of 1:100 (in 1% BSA in PBST overnight at 4°C), followed by Goat Anti-Rabbit IgG H&L 488 at 1:1,000 dilution (PBS used in control). Nuclear DNA was labelled in blue with DAPI, Beta tubulin (red) at 1/100 dilution (overnight, 4°C).
Supportive validation
- Submitted by
- Invitrogen Antibodies (provider)
- Main image
- Experimental details
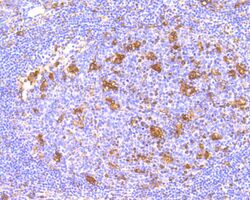
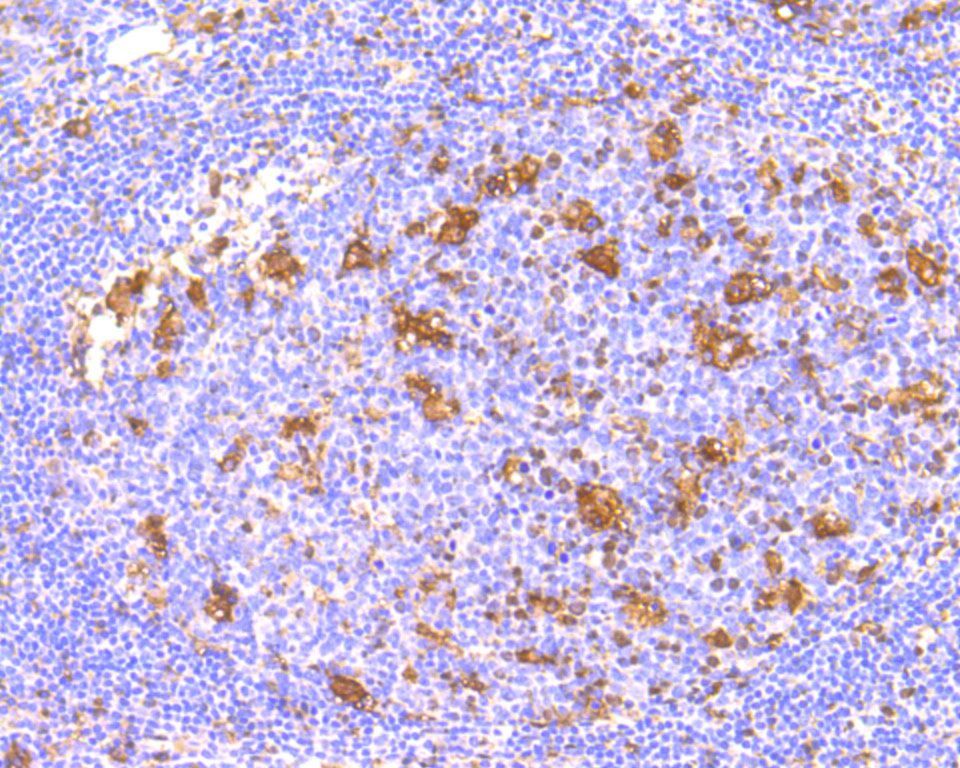
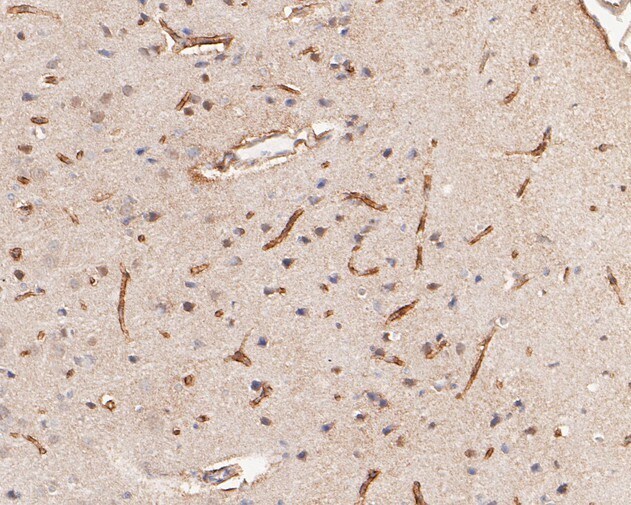
- Immunohistochemistry analysis of IFNAR1 in paraffin-embedded human tonsil tissue. Samples were incubated with IFNAR1 monoclonal antibody (Product # MA5-32006) using a dilution of 1:50. The section was pre-treated using heat mediated antigen retrieval with Tris-EDTA buffer (pH 9.0) for 20 minutes. The tissues were blocked in 5% BSA for 30 minutes at room temperature, washed with ddH2O and PBS, and then probed with the primary antibody for 30 minutes at room temperature. The detection was performed using an HRP conjugated compact polymer system. DAB was used as the chromogen. Tissues were counterstained with hematoxylin and mounted with DPX.
- Submitted by
- Invitrogen Antibodies (provider)
- Main image
- Experimental details
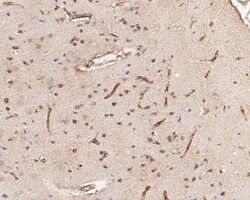
- Immunohistochemistry analysis of IFNAR1 in paraffin-embedded rat brain tissue. Samples were incubated with IFNAR1 monoclonal antibody (Product # MA5-32006) using a dilution of 1:200. The section was pre-treated using heat mediated antigen retrieval with Tris-EDTA buffer (pH 9.0) for 20 minutes. The tissues were blocked in 5% BSA for 30 minutes at room temperature, washed with ddH2O and PBS, and then probed with the primary antibody for 30 minutes at room temperature. The detection was performed using an HRP conjugated compact polymer system. DAB was used as the chromogen. Tissues were counterstained with hematoxylin and mounted with DPX.
- Submitted by
- Invitrogen Antibodies (provider)
- Main image
- Experimental details
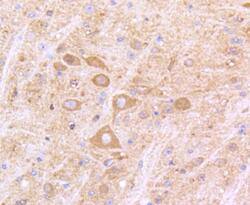
- Immunohistochemical analysis of IFNAR1 of paraffin-embedded Mouse brain tissue using a IFNAR1 Monoclonal antibody (Product #MA5-32006). Counter stained with hematoxylin.

Supportive validation
- Submitted by
- Invitrogen Antibodies (provider)
- Main image
- Experimental details
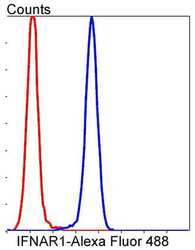
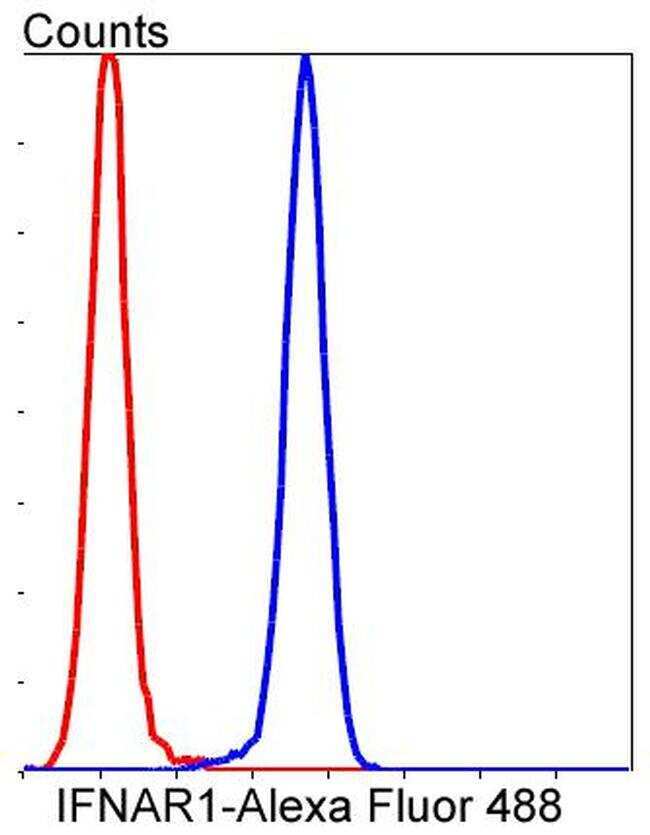
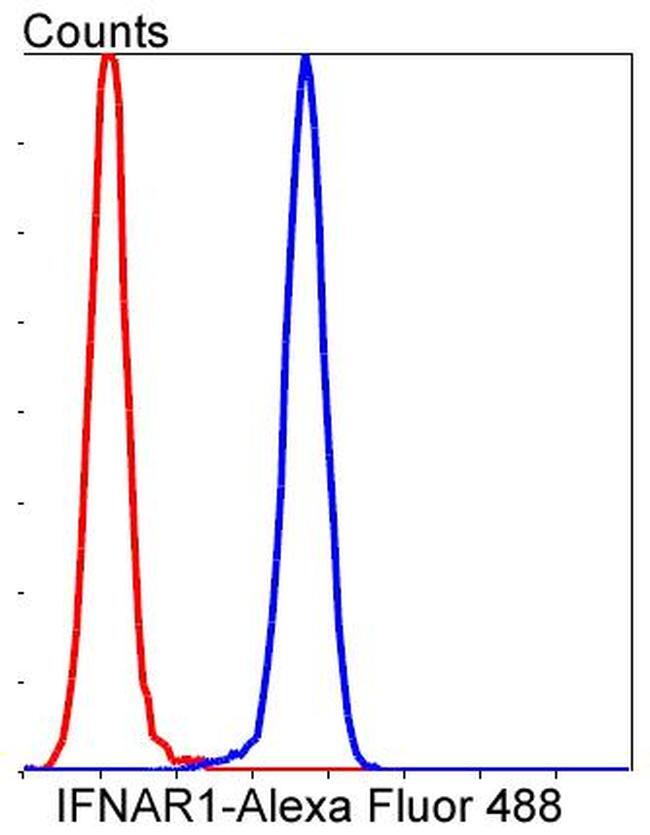
- Flow Cytometric analysis of IFNAR1 in Jurkat cells using a IFNAR1 Monoclonal Antibody (Product # MA5-32006) at a dilution of 1:50, as seen in blue compared with an unlabelled control (cells without incubation with primary antibody; red). Alexa Fluor 488-conjugated goat anti rabbit IgG was used as the secondary antibody.
- Submitted by
- Invitrogen Antibodies (provider)
- Main image
- Experimental details
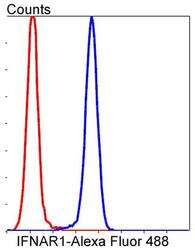
- Flow Cytometric analysis of IFNAR1 in Jurkat cells using a IFNAR1 Monoclonal Antibody (Product # MA5-32006) at a dilution of 1:50, as seen in blue compared with an unlabelled control (cells without incubation with primary antibody; red). Alexa Fluor 488-conjugated goat anti rabbit IgG was used as the secondary antibody.
Supportive validation
- Submitted by
- Invitrogen Antibodies (provider)
- Main image
- Experimental details
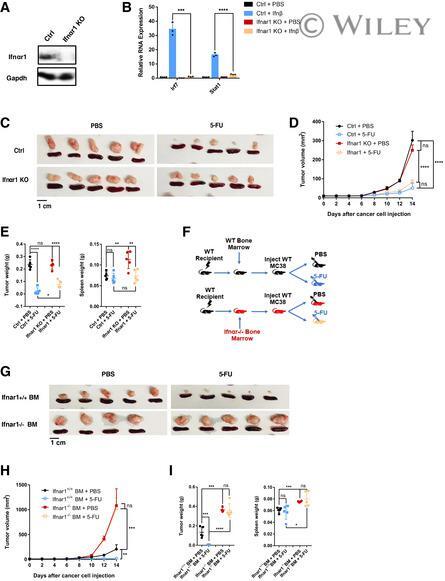
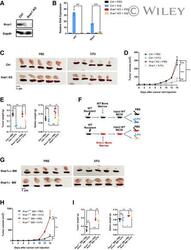
- 5 Figure Efficient 5-FU-induced tumor inhibition depends on IFN-sensing by bone-marrow-derived cells A Western blot for Ctrl and Ifnar1-KO MC38 cells, analyzed with Ifnar1 and GAPDH antibodies. B Ctrl or Ifnar1-KO MC38 cells were treated with PBS or recombinant Ifnbeta for 4 h. The RNA expression levels of indicated ISGs were analyzed using qRT-PCR. N = 3. C-E Mice were injected with control (Ctrl) or Ifnar1-KO MC38 cells, and treated with 5-FU or PBS. (C) Pictures of tumors and spleens from a representative experiment. (D) Tumor volumes were quantified at the indicated days after cancer cell injection. N = 5. (E) Tumor and spleen weights at the endpoint for (D), with each dot representing a mouse. Ctrl tumor data in (C-E) are the same as those in Fig 4B-D. F-I Schematics (F) of the experiment to test the function of Ifnar1 in bone-marrow (BM)-derived cells. WT C57BL/6 mice were transplanted with either Ifnar1 +/+ or Ifnar1 -/- BM cells. Recipient mice were allowed to recover followed by the injection of WT MC38 cells, before treatment with 5-FU or PBS. (G) Pictures of tumors and spleens from a representative experiment. Image panels were cropped from the same picture. (H) Tumor volumes were quantified at the indicated days after cancer cell injection. N = 4 to N = 5, as shown in (G). (I) Tumor and spleen weights at the endpoint for (H), with each dot representing a mouse. Data information: For all panels, error bars stand for SD, and center values represent mean. Two-tailed