Explore
 Validate
 Learn
Learn Western blot
 Immunohistochemistry
Antibody data
- Antibody Data
- Antigen structure
- References [38]
- Comments [0]
- Validations
- Immunohistochemistry [8]
- Other assay [42]
Submit
Validation data
Reference
Comment
Report error
- Product number
- 53-9760-82 - Provider product page

- Provider
- Invitrogen Antibodies
- Product name
- Alpha-Smooth Muscle Actin Monoclonal Antibody (1A4), Alexa Fluor™ 488, eBioscience™
- Antibody type
- Monoclonal
- Antigen
- Other
- Description
- Description: The monoclonal antibody 1A4 recognizes human, mouse, and rat alpha-smooth muscle actin. Alpha-smooth muscle actin is a 42 kDa protein and is a major component of the cytoskeletal structural network. This 1A4 antibody is specific for the alpha form of muscle actin only, which is expressed by smooth muscle cells of blood vessels, myofibroblasts, and myoepithelial cells. It is also expressed in the parenchyma and stroma of various tissues. Alpha-smooth muscle actin is useful in the identification of leiomyomas, leiomycosarcomas and pleomorphic adenomas and is used as a prognostic marker for basal cell carcinoma. Applications Reported: This 1A4 antibody has been reported for use in immunohistochemical staining of formalin-fixed paraffin embedded tissue sections, and immunocytochemistry. Applications Tested: This 1A4 antibody has been tested by immunohistochemistry of formalin-fixed paraffin embedded tissue using low pH antigen retrieval and can be used at less than or equal to 1 µg/mL. This 1A4 antibody has been tested by immunocytochemistry of methanol-fixed cells and can be used at less than or equal to 1 µg/mL. It is recommended that the antibody be carefully titrated for optimal performance in the assay of interest. Excitation: 488 nm; Emission: 519 nm; Laser: Blue Laser. Filtration: 0.2 µm post-manufacturing filtered.
- Reactivity
- Human, Mouse, Rat
- Host
- Mouse
- Conjugate
- Green dye
- Isotype
- IgG
- Antibody clone number
- 1A4
- Vial size
- 100 µg
- Concentration
- 0.5 mg/mL
- Storage
- 4°C, store in dark, DO NOT FREEZE!
Submitted references Differential Biological Effects of Dietary Lipids and Irradiation on the Aorta, Aortic Valve, and the Mitral Valve.
Persistent popliteal lymphatic muscle cell coverage defects despite amelioration of arthritis and recovery of popliteal lymphatic vessel function in TNF-Tg mice following anti-TNF therapy.
Midkine expression by stem-like tumor cells drives persistence to mTOR inhibition and an immune-suppressive microenvironment.
Ductal Macrophages Predominate in the Immune Landscape of the Lactating Mammary Gland.
Leflunomide Induces Dose-Dependent Lung Injury in Mice via Stimulating Vimentin and NLRP3 Inflammasome Production.
Chrysin Ameliorates Cyclosporine-A-Induced Renal Fibrosis by Inhibiting TGF-β(1)-Induced Epithelial-Mesenchymal Transition.
Knockout RAGE alleviates cardiac fibrosis through repressing endothelial-to-mesenchymal transition (EndMT) mediated by autophagy.
Identification of a population of peripheral sensory neurons that regulates blood pressure.
Class A1 scavenger receptor prevents obesity-associated blood pressure elevation through suppressing overproduction of vascular endothelial growth factor B in macrophages.
Fibroblastic reticular cell lineage convergence in Peyer's patches governs intestinal immunity.
Gut-liver axis modulation of Panax notoginseng saponins in nonalcoholic fatty liver disease.
Spatial mapping of SARS-CoV-2 and H1N1 lung injury identifies differential transcriptional signatures.
Physiologically Relevant Fluid-Induced Oscillatory Shear Stress Stimulation of Mesenchymal Stem Cells Enhances the Engineered Valve Matrix Phenotype.
A Novel Model of Balloon Angioplasty Injury in Rat Arteriovenous Fistula.
Two novel TSC2 mutations in renal epithelioid angiomyolipoma sensitive to everolimus.
Asporin Reduces Adult Aortic Valve Interstitial Cell Mineralization Induced by Osteogenic Media and Wnt Signaling Manipulation In Vitro.
Maintaining resting cardiac fibroblasts in vitro by disrupting mechanotransduction.
Direct reprogramming of human smooth muscle and vascular endothelial cells reveals defects associated with aging and Hutchinson-Gilford progeria syndrome.
Lineage tracing reveals evidence of a popliteal lymphatic muscle progenitor cell that is distinct from skeletal and vascular muscle progenitors.
The vitamin D analogue calcipotriol promotes an anti-tumorigenic phenotype of human pancreatic CAFs but reduces T cell mediated immunity.
Platelet polyphosphate induces fibroblast chemotaxis and myofibroblast differentiation.
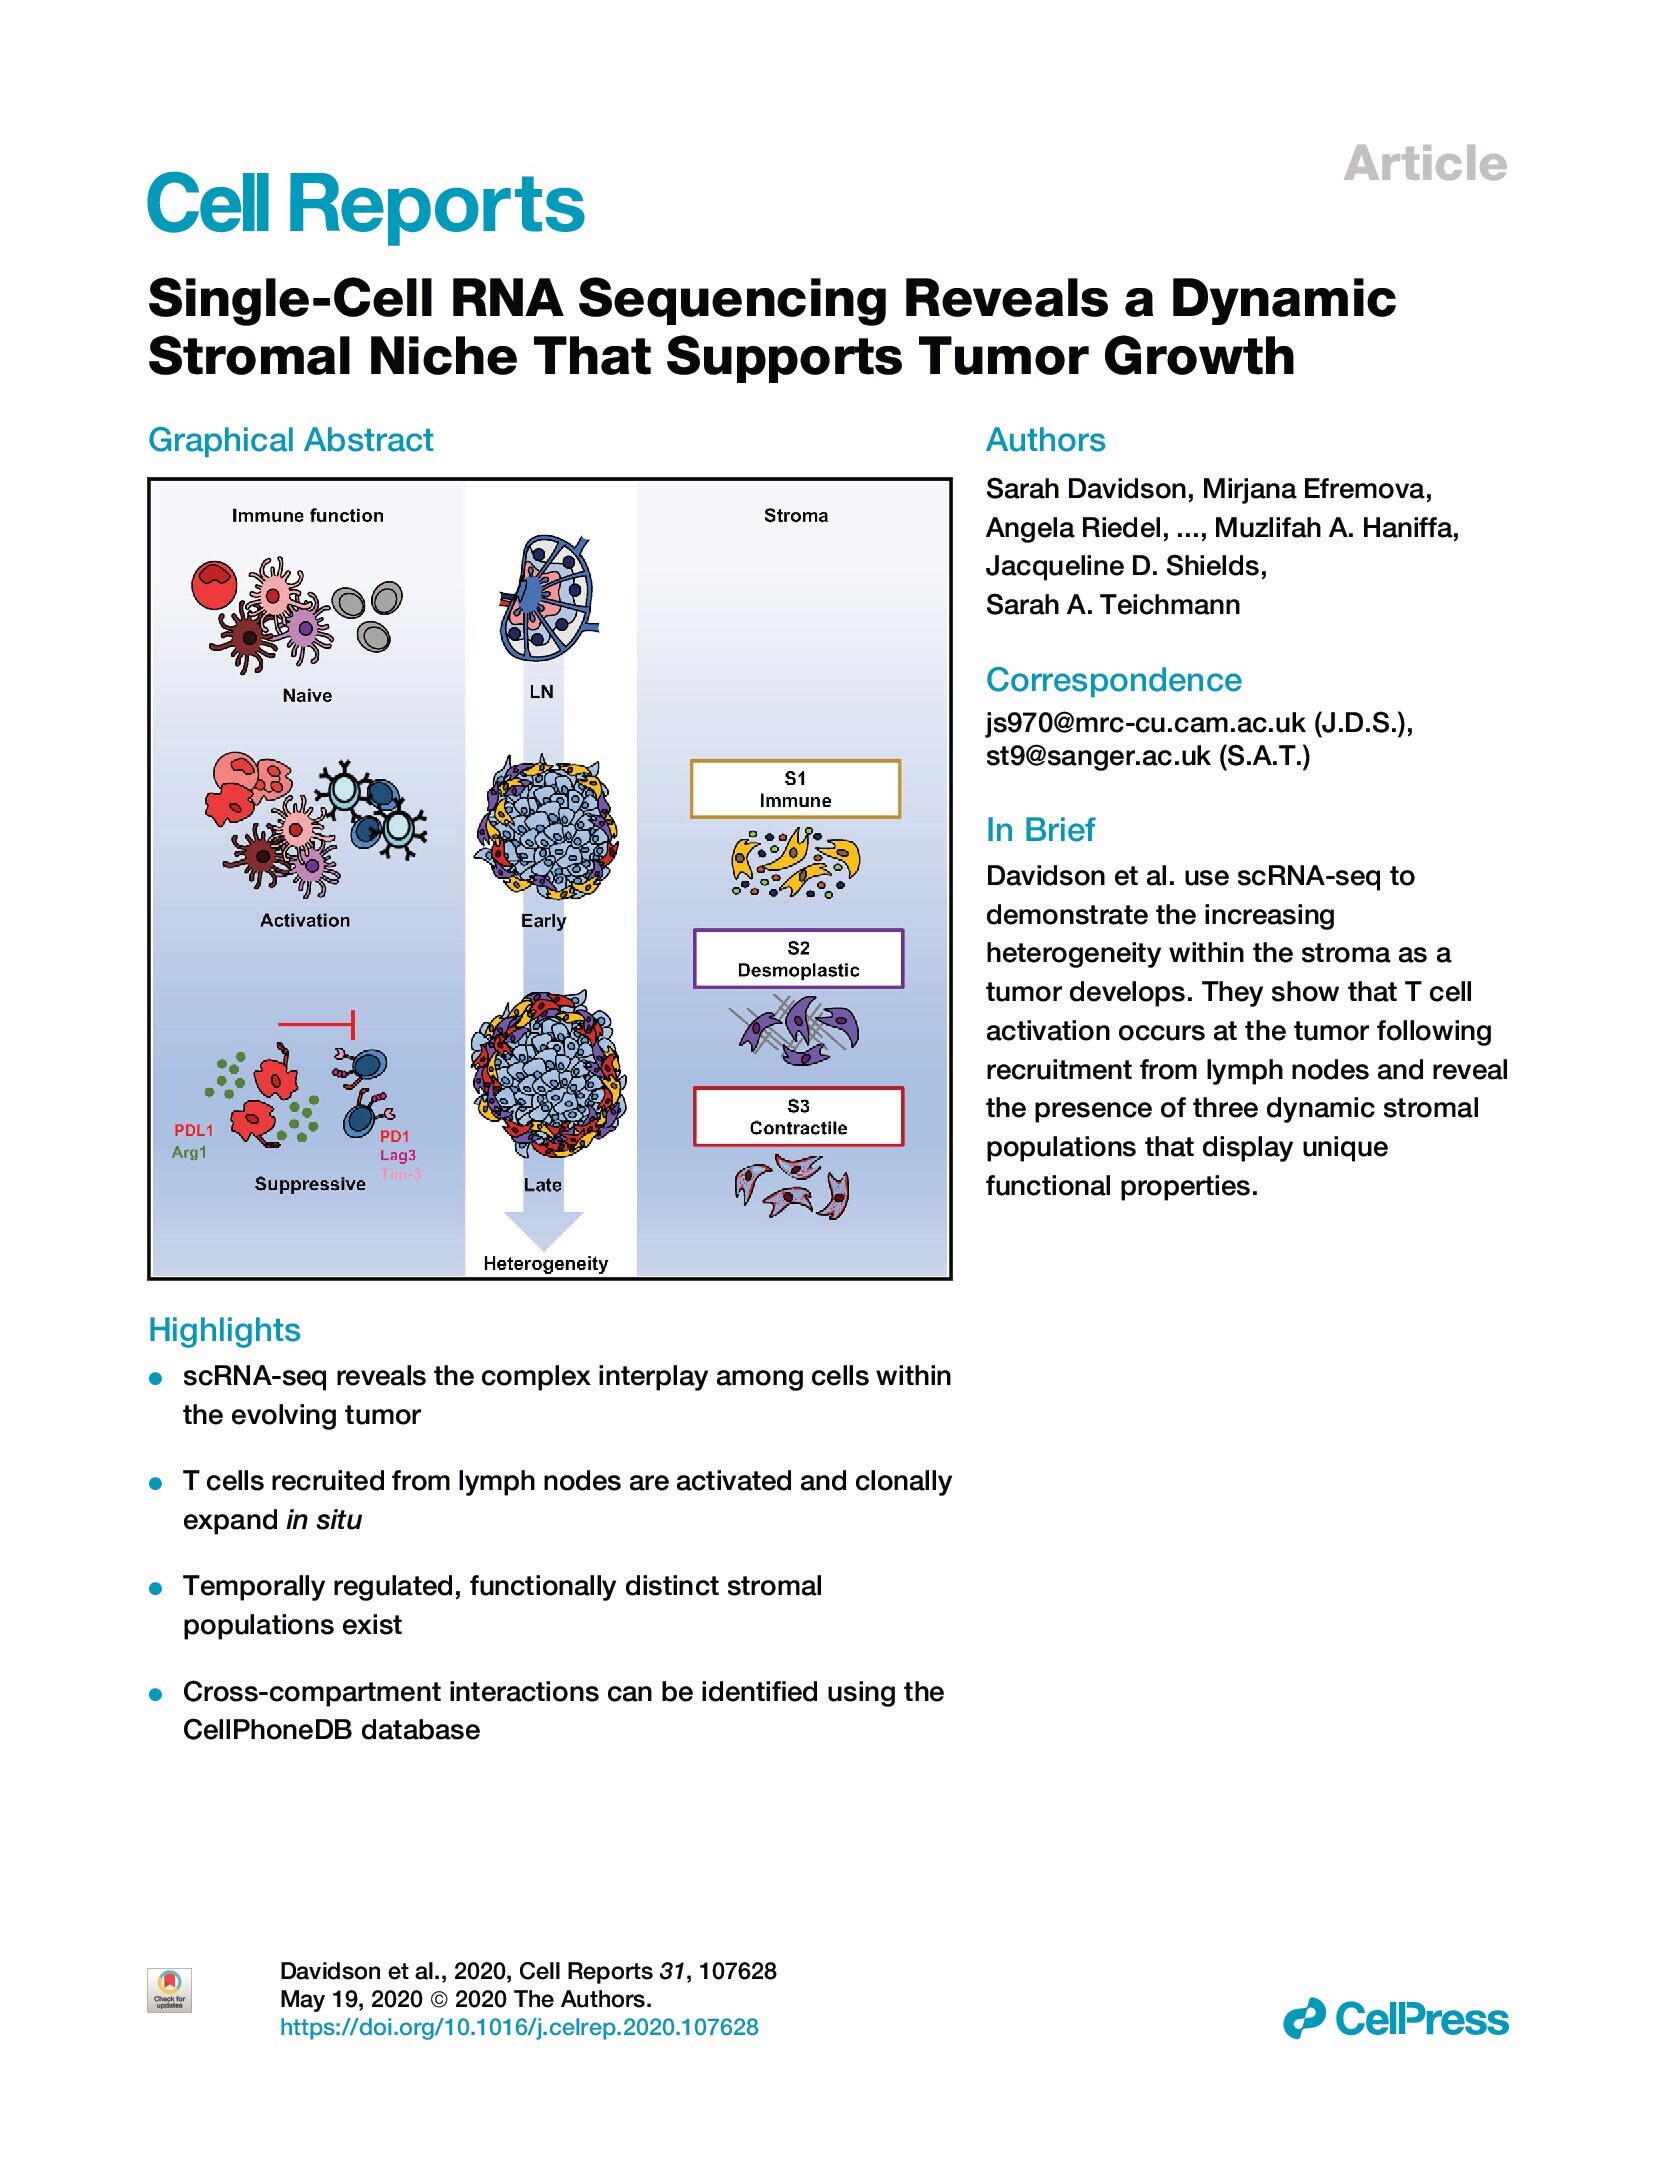
Single-Cell RNA Sequencing Reveals a Dynamic Stromal Niche That Supports Tumor Growth.
Low Incidence of High-Grade Pancreatic Intraepithelial Neoplasia Lesions in a Crmp4 Gene-Deficient Mouse Model of Pancreatic Cancer.
Hyaluronan Degradation by Cemip Regulates Host Defense against Staphylococcus aureus Skin Infection.
Vascular smooth muscle TRPC3 channels facilitate the inverse hemodynamic response during status epilepticus.
Smooth muscle-derived progenitor cell myofibroblast differentiation through KLF4 downregulation promotes arterial remodeling and fibrosis.
The β-catenin/YAP signaling axis is a key regulator of melanoma-associated fibroblasts.
Regulatory T Cells Control the Switch From in situ to Invasive Breast Cancer.
Material-Induced Venosome-Supported Bone Tubes.
Induction of autophagy in Cx3cr1(+) mononuclear cells limits IL-23/IL-22 axis-mediated intestinal fibrosis.
Age-Related Loss of Innate Immune Antimicrobial Function of Dermal Fat Is Mediated by Transforming Growth Factor Beta.
YBX-1 mediated sorting of miR-133 into hypoxia/reoxygenation-induced EPC-derived exosomes to increase fibroblast angiogenesis and MEndoT.
Platelet-derived growth factor receptor-α is essential for cardiac fibroblast survival.
Hyaluronidase inhibits reactive adipogenesis and inflammation of colon and skin.
Human ISL1(+) Ventricular Progenitors Self-Assemble into an In Vivo Functional Heart Patch and Preserve Cardiac Function Post Infarction.
Highly multiplexed immunofluorescence imaging of human tissues and tumors using t-CyCIF and conventional optical microscopes.
Single-cell profiling reveals heterogeneity and functional patterning of GPCR expression in the vascular system.
Endothelial cells are progenitors of cardiac pericytes and vascular smooth muscle cells.
Donis N, Jiang Z, D'Emal C, Hulin A, Debuisson M, Dulgheru R, Nguyen ML, Postolache A, Lallemand F, Coucke P, Martinive P, Herzog M, Pamart D, Terrell J, Pincemail J, Drion P, Delvenne P, Nchimi A, Lancellotti P, Oury C
Frontiers in cardiovascular medicine 2022;9:839720
Frontiers in cardiovascular medicine 2022;9:839720
Persistent popliteal lymphatic muscle cell coverage defects despite amelioration of arthritis and recovery of popliteal lymphatic vessel function in TNF-Tg mice following anti-TNF therapy.
Kenney HM, Peng Y, Bell RD, Wood RW, Xing L, Ritchlin CT, Schwarz EM
Scientific reports 2022 Jul 26;12(1):12751
Scientific reports 2022 Jul 26;12(1):12751
Midkine expression by stem-like tumor cells drives persistence to mTOR inhibition and an immune-suppressive microenvironment.
Tang Y, Kwiatkowski DJ, Henske EP
Nature communications 2022 Aug 26;13(1):5018
Nature communications 2022 Aug 26;13(1):5018
Ductal Macrophages Predominate in the Immune Landscape of the Lactating Mammary Gland.
Hassel C, Gausserès B, Guzylack-Piriou L, Foucras G
Frontiers in immunology 2021;12:754661
Frontiers in immunology 2021;12:754661
Leflunomide Induces Dose-Dependent Lung Injury in Mice via Stimulating Vimentin and NLRP3 Inflammasome Production.
El-Sherbiny M, Atef H, Eladl MA, Mohamed AS, El-Shafey M, Ali HS, Zaitone SA, Alomar SY, Alqahtani SAM, Aloyouni SY, Attia MA
Frontiers in pharmacology 2021;12:631216
Frontiers in pharmacology 2021;12:631216
Chrysin Ameliorates Cyclosporine-A-Induced Renal Fibrosis by Inhibiting TGF-β(1)-Induced Epithelial-Mesenchymal Transition.
Nagavally RR, Sunilkumar S, Akhtar M, Trombetta LD, Ford SM
International journal of molecular sciences 2021 Sep 23;22(19)
International journal of molecular sciences 2021 Sep 23;22(19)
Knockout RAGE alleviates cardiac fibrosis through repressing endothelial-to-mesenchymal transition (EndMT) mediated by autophagy.
Zhang L, He J, Wang J, Liu J, Chen Z, Deng B, Wei L, Wu H, Liang B, Li H, Huang Y, Lu L, Yang Z, Xian S, Wang L
Cell death & disease 2021 May 11;12(5):470
Cell death & disease 2021 May 11;12(5):470
Identification of a population of peripheral sensory neurons that regulates blood pressure.
Morelli C, Castaldi L, Brown SJ, Streich LL, Websdale A, Taberner FJ, Cerreti B, Barenghi A, Blum KM, Sawitzke J, Frank T, Steffens LK, Doleschall B, Serrao J, Ferrarini D, Lechner SG, Prevedel R, Heppenstall PA
Cell reports 2021 Jun 1;35(9):109191
Cell reports 2021 Jun 1;35(9):109191
Class A1 scavenger receptor prevents obesity-associated blood pressure elevation through suppressing overproduction of vascular endothelial growth factor B in macrophages.
Zhu X, Wang Y, Zhu L, Zhu Y, Zhang K, Wang L, Bai H, Yang Q, Ben J, Zhang H, Li X, Xu Y, Chen Q
Cardiovascular research 2021 Jan 21;117(2):547-560
Cardiovascular research 2021 Jan 21;117(2):547-560
Fibroblastic reticular cell lineage convergence in Peyer's patches governs intestinal immunity.
Prados A, Onder L, Cheng HW, Mörbe U, Lütge M, Gil-Cruz C, Perez-Shibayama C, Koliaraki V, Ludewig B, Kollias G
Nature immunology 2021 Apr;22(4):510-519
Nature immunology 2021 Apr;22(4):510-519
Gut-liver axis modulation of Panax notoginseng saponins in nonalcoholic fatty liver disease.
Xu Y, Wang N, Tan HY, Li S, Zhang C, Feng Y
Hepatology international 2021 Apr;15(2):350-365
Hepatology international 2021 Apr;15(2):350-365
Spatial mapping of SARS-CoV-2 and H1N1 lung injury identifies differential transcriptional signatures.
Margaroli C, Benson P, Sharma NS, Madison MC, Robison SW, Arora N, Ton K, Liang Y, Zhang L, Patel RP, Gaggar A
Cell reports. Medicine 2021 Apr 20;2(4):100242
Cell reports. Medicine 2021 Apr 20;2(4):100242
Physiologically Relevant Fluid-Induced Oscillatory Shear Stress Stimulation of Mesenchymal Stem Cells Enhances the Engineered Valve Matrix Phenotype.
Gonzalez BA, Perez-Nevarez M, Mirza A, Perez MG, Lin YM, Hsu CD, Caobi A, Raymond A, Gomez Hernandez ME, Fernandez-Lima F, George F, Ramaswamy S
Frontiers in cardiovascular medicine 2020;7:69
Frontiers in cardiovascular medicine 2020;7:69
A Novel Model of Balloon Angioplasty Injury in Rat Arteriovenous Fistula.
Somarathna M, Isayeva-Waldrop T, Al-Balas A, Guo L, Lee T
Journal of vascular research 2020;57(4):223-235
Journal of vascular research 2020;57(4):223-235
Two novel TSC2 mutations in renal epithelioid angiomyolipoma sensitive to everolimus.
Wang T, Xie S, Luo R, Shi L, Bai P, Wang X, Wan R, Deng J, Wu Z, Li W, Xiao W, Wang Y, Chen B, Zhang K, Xing J
Cancer biology & therapy 2020;21(1):4-11
Cancer biology & therapy 2020;21(1):4-11
Asporin Reduces Adult Aortic Valve Interstitial Cell Mineralization Induced by Osteogenic Media and Wnt Signaling Manipulation In Vitro.
Polley A, Khanam R, Sengupta A, Chakraborty S
International journal of cell biology 2020;2020:2045969
International journal of cell biology 2020;2020:2045969
Maintaining resting cardiac fibroblasts in vitro by disrupting mechanotransduction.
Gilles G, McCulloch AD, Brakebusch CH, Herum KM
PloS one 2020;15(10):e0241390
PloS one 2020;15(10):e0241390
Direct reprogramming of human smooth muscle and vascular endothelial cells reveals defects associated with aging and Hutchinson-Gilford progeria syndrome.
Bersini S, Schulte R, Huang L, Tsai H, Hetzer MW
eLife 2020 Sep 8;9
eLife 2020 Sep 8;9
Lineage tracing reveals evidence of a popliteal lymphatic muscle progenitor cell that is distinct from skeletal and vascular muscle progenitors.
Kenney HM, Bell RD, Masters EA, Xing L, Ritchlin CT, Schwarz EM
Scientific reports 2020 Oct 22;10(1):18088
Scientific reports 2020 Oct 22;10(1):18088
The vitamin D analogue calcipotriol promotes an anti-tumorigenic phenotype of human pancreatic CAFs but reduces T cell mediated immunity.
Gorchs L, Ahmed S, Mayer C, Knauf A, Fernández Moro C, Svensson M, Heuchel R, Rangelova E, Bergman P, Kaipe H
Scientific reports 2020 Oct 15;10(1):17444
Scientific reports 2020 Oct 15;10(1):17444
Platelet polyphosphate induces fibroblast chemotaxis and myofibroblast differentiation.
Suess PM, Smith SA, Morrissey JH
Journal of thrombosis and haemostasis : JTH 2020 Nov;18(11):3043-3052
Journal of thrombosis and haemostasis : JTH 2020 Nov;18(11):3043-3052
Single-Cell RNA Sequencing Reveals a Dynamic Stromal Niche That Supports Tumor Growth.
Davidson S, Efremova M, Riedel A, Mahata B, Pramanik J, Huuhtanen J, Kar G, Vento-Tormo R, Hagai T, Chen X, Haniffa MA, Shields JD, Teichmann SA
Cell reports 2020 May 19;31(7):107628
Cell reports 2020 May 19;31(7):107628
Low Incidence of High-Grade Pancreatic Intraepithelial Neoplasia Lesions in a Crmp4 Gene-Deficient Mouse Model of Pancreatic Cancer.
Yazawa K, Nakamura F, Masukawa D, Sato S, Hiroshima Y, Yabushita Y, Mori R, Matsuyama R, Kato I, Taniguchi H, Goshima Y, Endo I
Translational oncology 2020 Mar;13(3):100746
Translational oncology 2020 Mar;13(3):100746
Hyaluronan Degradation by Cemip Regulates Host Defense against Staphylococcus aureus Skin Infection.
Dokoshi T, Zhang LJ, Li F, Nakatsuji T, Butcher A, Yoshida H, Shimoda M, Okada Y, Gallo RL
Cell reports 2020 Jan 7;30(1):61-68.e4
Cell reports 2020 Jan 7;30(1):61-68.e4
Vascular smooth muscle TRPC3 channels facilitate the inverse hemodynamic response during status epilepticus.
Cozart MA, Phelan KD, Wu H, Mu S, Birnbaumer L, Rusch NJ, Zheng F
Scientific reports 2020 Jan 21;10(1):812
Scientific reports 2020 Jan 21;10(1):812
Smooth muscle-derived progenitor cell myofibroblast differentiation through KLF4 downregulation promotes arterial remodeling and fibrosis.
Lu S, Jolly AJ, Strand KA, Dubner AM, Mutryn MF, Moulton KS, Nemenoff RA, Majesky MW, Weiser-Evans MC
JCI insight 2020 Dec 3;5(23)
JCI insight 2020 Dec 3;5(23)
The β-catenin/YAP signaling axis is a key regulator of melanoma-associated fibroblasts.
Liu T, Zhou L, Yang K, Iwasawa K, Kadekaro AL, Takebe T, Andl T, Zhang Y
Signal transduction and targeted therapy 2019;4:63
Signal transduction and targeted therapy 2019;4:63
Regulatory T Cells Control the Switch From in situ to Invasive Breast Cancer.
Martinez LM, Robila V, Clark NM, Du W, Idowu MO, Rutkowski MR, Bos PD
Frontiers in immunology 2019;10:1942
Frontiers in immunology 2019;10:1942
Material-Induced Venosome-Supported Bone Tubes.
Charbonnier B, Baradaran A, Sato D, Alghamdi O, Zhang Z, Zhang YL, Gbureck U, Gilardino M, Harvey E, Makhoul N, Barralet J
Advanced science (Weinheim, Baden-Wurttemberg, Germany) 2019 Sep 4;6(17):1900844
Advanced science (Weinheim, Baden-Wurttemberg, Germany) 2019 Sep 4;6(17):1900844
Induction of autophagy in Cx3cr1(+) mononuclear cells limits IL-23/IL-22 axis-mediated intestinal fibrosis.
Mathur R, Alam MM, Zhao XF, Liao Y, Shen J, Morgan S, Huang T, Lee H, Lee E, Huang Y, Zhu X
Mucosal immunology 2019 May;12(3):612-623
Mucosal immunology 2019 May;12(3):612-623
Age-Related Loss of Innate Immune Antimicrobial Function of Dermal Fat Is Mediated by Transforming Growth Factor Beta.
Zhang LJ, Chen SX, Guerrero-Juarez CF, Li F, Tong Y, Liang Y, Liggins M, Chen X, Chen H, Li M, Hata T, Zheng Y, Plikus MV, Gallo RL
Immunity 2019 Jan 15;50(1):121-136.e5
Immunity 2019 Jan 15;50(1):121-136.e5
YBX-1 mediated sorting of miR-133 into hypoxia/reoxygenation-induced EPC-derived exosomes to increase fibroblast angiogenesis and MEndoT.
Lin F, Zeng Z, Song Y, Li L, Wu Z, Zhang X, Li Z, Ke X, Hu X
Stem cell research & therapy 2019 Aug 23;10(1):263
Stem cell research & therapy 2019 Aug 23;10(1):263
Platelet-derived growth factor receptor-α is essential for cardiac fibroblast survival.
Ivey MJ, Kuwabara JT, Riggsbee KL, Tallquist MD
American journal of physiology. Heart and circulatory physiology 2019 Aug 1;317(2):H330-H344
American journal of physiology. Heart and circulatory physiology 2019 Aug 1;317(2):H330-H344
Hyaluronidase inhibits reactive adipogenesis and inflammation of colon and skin.
Dokoshi T, Zhang LJ, Nakatsuji T, Adase CA, Sanford JA, Paladini RD, Tanaka H, Fujiya M, Gallo RL
JCI insight 2018 Nov 2;3(21)
JCI insight 2018 Nov 2;3(21)
Human ISL1(+) Ventricular Progenitors Self-Assemble into an In Vivo Functional Heart Patch and Preserve Cardiac Function Post Infarction.
Foo KS, Lehtinen ML, Leung CY, Lian X, Xu J, Keung W, Geng L, Kolstad TRS, Thams S, Wong AO, Wong N, Bylund K, Zhou C, He X, Jin SB, Clarke J, Lendahl U, Li RA, Louch WE, Chien KR
Molecular therapy : the journal of the American Society of Gene Therapy 2018 Jul 5;26(7):1644-1659
Molecular therapy : the journal of the American Society of Gene Therapy 2018 Jul 5;26(7):1644-1659
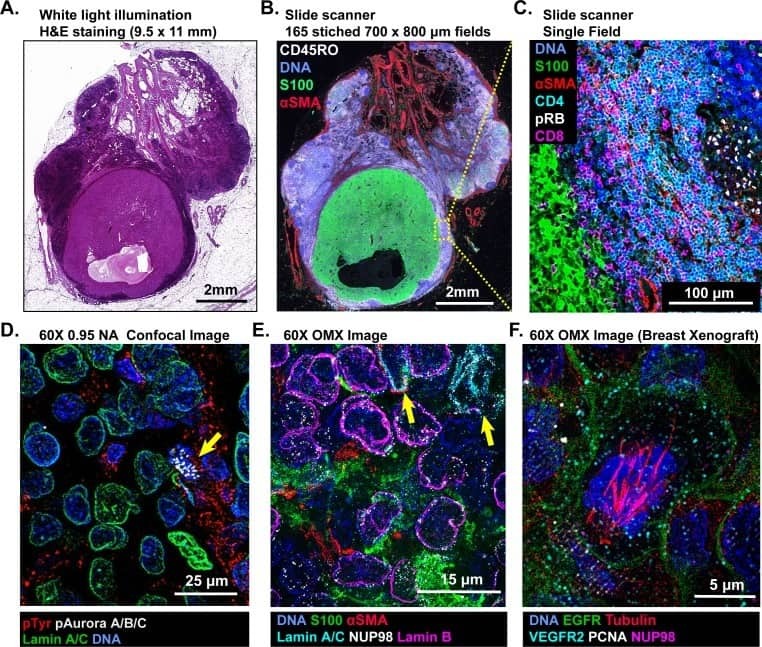
Highly multiplexed immunofluorescence imaging of human tissues and tumors using t-CyCIF and conventional optical microscopes.
Lin JR, Izar B, Wang S, Yapp C, Mei S, Shah PM, Santagata S, Sorger PK
eLife 2018 Jul 11;7
eLife 2018 Jul 11;7
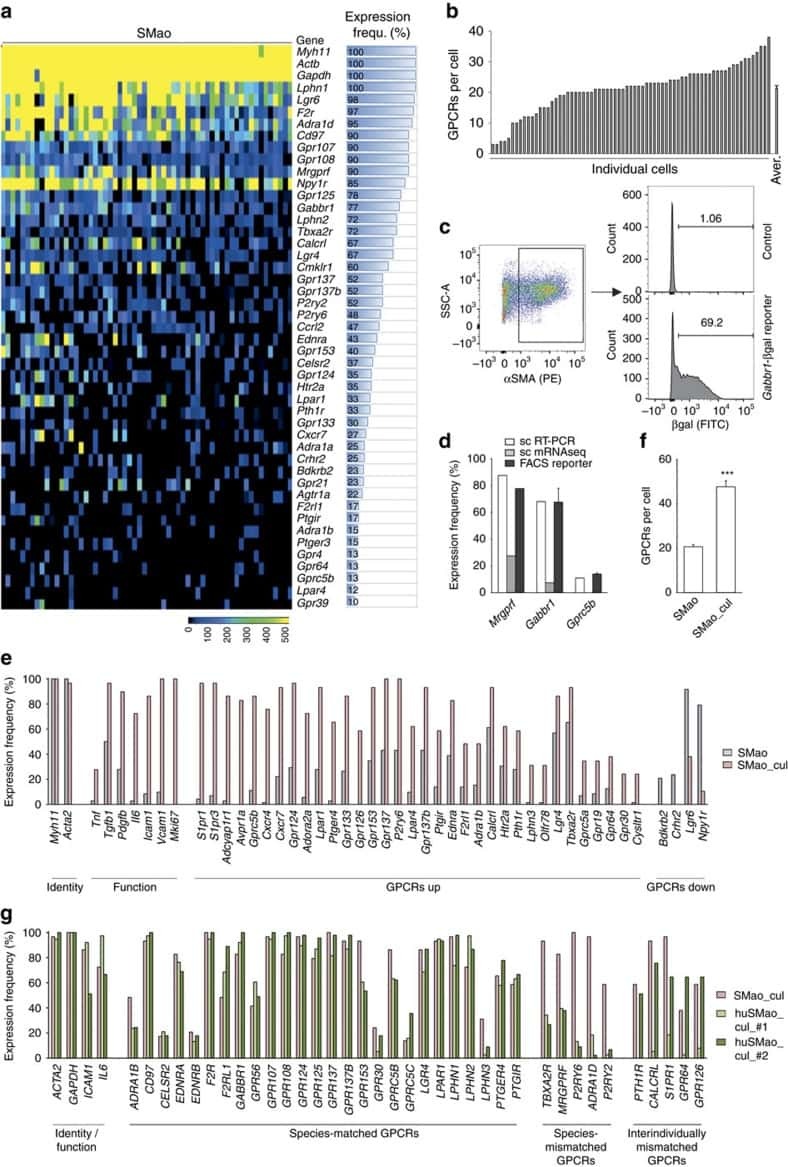
Single-cell profiling reveals heterogeneity and functional patterning of GPCR expression in the vascular system.
Kaur H, Carvalho J, Looso M, Singh P, Chennupati R, Preussner J, Günther S, Albarrán-Juárez J, Tischner D, Classen S, Offermanns S, Wettschureck N
Nature communications 2017 Jun 16;8:15700
Nature communications 2017 Jun 16;8:15700
Endothelial cells are progenitors of cardiac pericytes and vascular smooth muscle cells.
Chen Q, Zhang H, Liu Y, Adams S, Eilken H, Stehling M, Corada M, Dejana E, Zhou B, Adams RH
Nature communications 2016 Aug 12;7:12422
Nature communications 2016 Aug 12;7:12422
No comments: Submit comment
Supportive validation
- Submitted by
- Invitrogen Antibodies (provider)
- Main image
- Experimental details
- Immunohistochemistry of formalin-fixed paraffin embedded human infiltrating ductal carcinoma using 1 µg/mL of Mouse IgG2a K Isotype Control Alexa Fluor® 488 (left) or 1 µg/mL of Anti-Alpha-Smooth Muscle Actin Alexa Fluor® 488 (right). Nuclei are stained with DAPI.
- Submitted by
- Invitrogen Antibodies (provider)
- Main image
- Experimental details
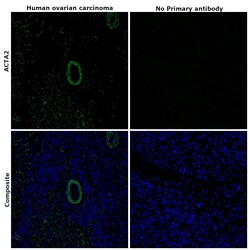
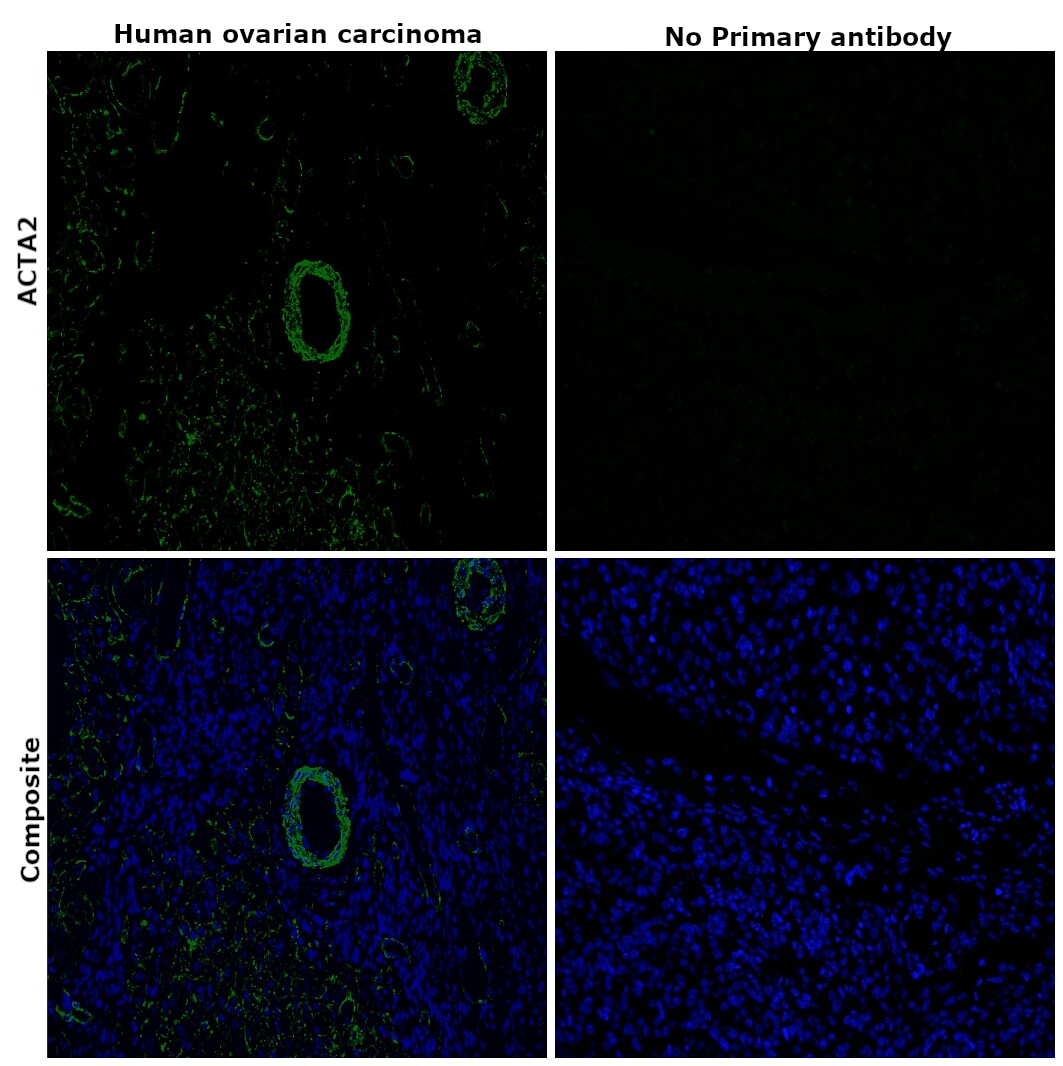
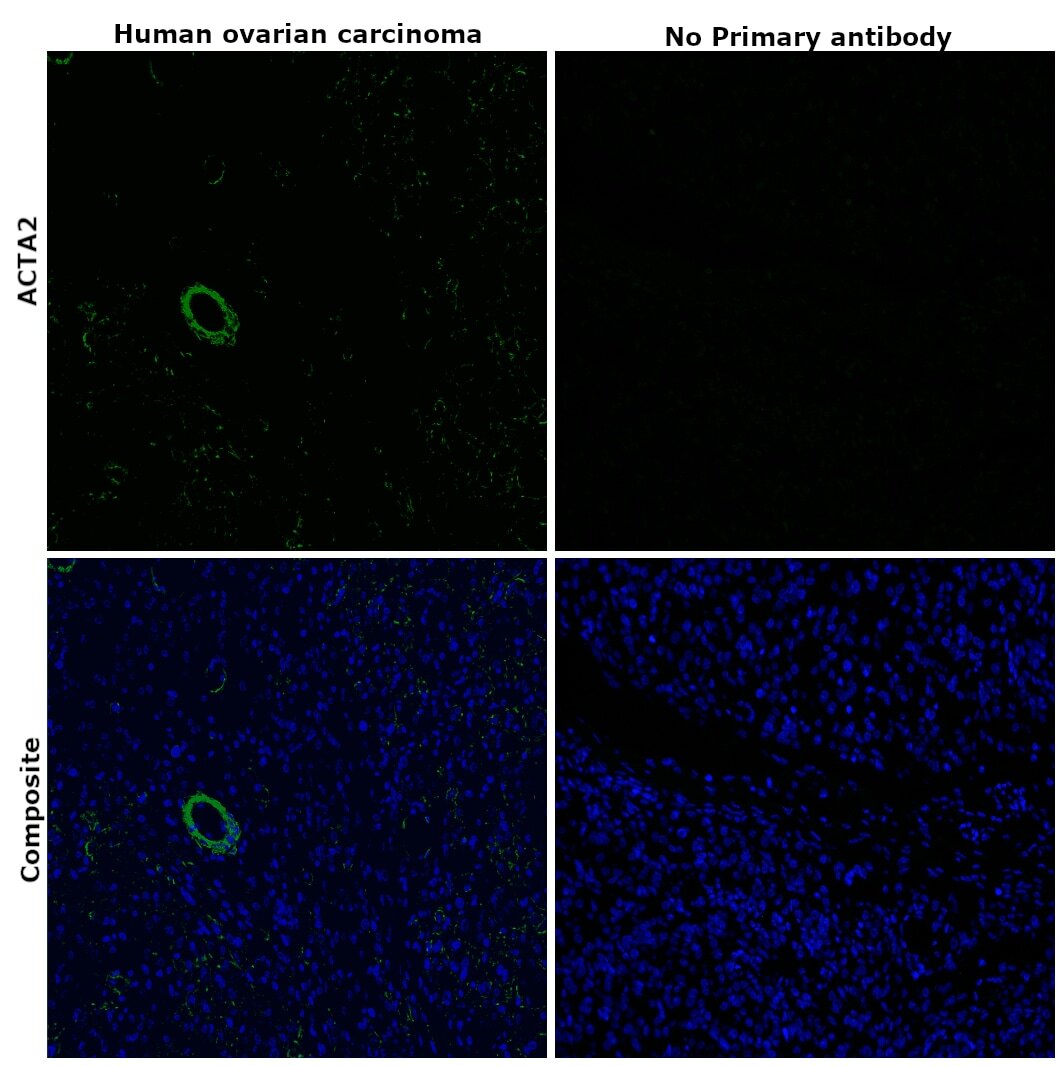
- Immunohistochemical analysis of ACTA2 was performed using formalin-fixed paraffin-embedded human ovarian carcinoma tissue sections. To expose the target protein, heat-induced epitope retrieval was performed on de-paraffinized sections using eBioscience™ IHC Antigen Retrieval Solution - Low pH (10X) (Product # 00-4955-58) diluted to 1X solution in water in a decloaking chamber at 110 degree Celsius for 15 minutes. Following antigen retrieval, the sections were blocked with 2% normal goat serum in 1X PBS for 45 minutes at room temperature and then probed with or without Alpha-Smooth Muscle Actin Monoclonal Antibody (1A4), Alexa Fluor™ 488, eBioscience™ (Product # 53-9760-82) at a concentration of 5 µg/mL in 0.1% normal goat serum overnight at 4 degree Celsius in a humidified chamber. ReadyProbes™ Tissue Autofluorescence Quenching Kit (Product # R37630) was used to quench autofluorescence from the tissues. Nuclei were stained with DAPI (Product # D1306) and the sections were mounted using ProLong™ Glass Antifade Mountant (Product # P36984). The images were captured on EVOS™ M7000 Imaging System (Product # AMF7000) at 20X magnification and externally deconvoluted.
- Submitted by
- Invitrogen Antibodies (provider)
- Main image
- Experimental details
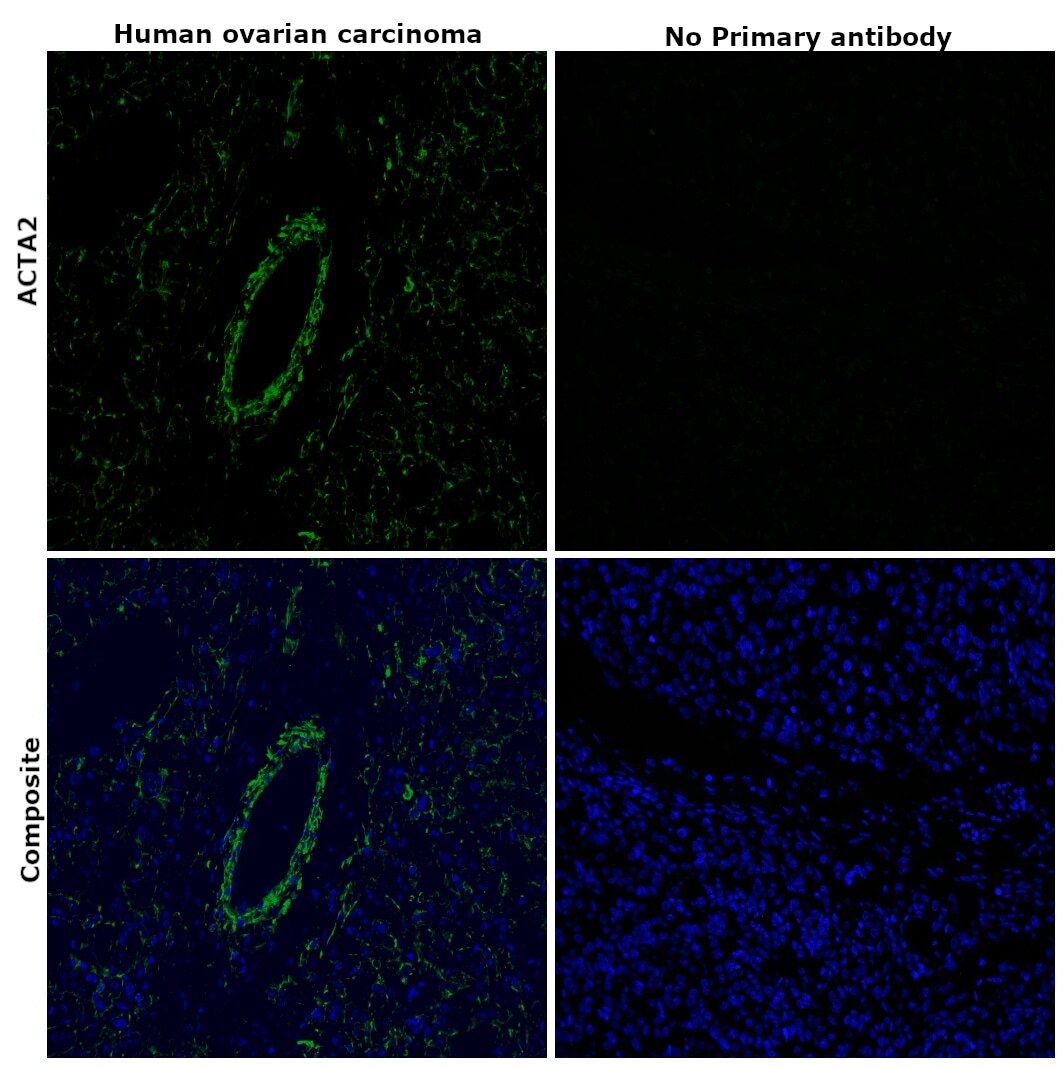
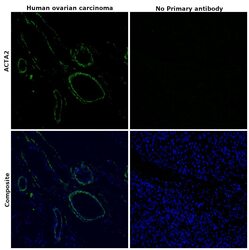
- Immunohistochemical analysis of ACTA2 was performed using formalin-fixed paraffin-embedded human ovarian carcinoma tissue sections. To expose the target protein, heat-induced epitope retrieval was performed on de-paraffinized sections using eBioscience™ IHC Antigen Retrieval Solution - High pH (10X) (Product # 00-4956-58) diluted to 1X solution in water in a decloaking chamber at 110 degree Celsius for 15 minutes. Following antigen retrieval, the sections were blocked with 2% normal goat serum in 1X PBS for 45 minutes at room temperature and then probed with or without Alpha-Smooth Muscle Actin Monoclonal Antibody (1A4), Alexa Fluor™ 488, eBioscience™ (Product # 53-9760-82) at a concentration of 5 µg/mL in 0.1% normal goat serum overnight at 4 degree Celsius in a humidified chamber. ReadyProbes™ Tissue Autofluorescence Quenching Kit (Product # R37630) was used to quench autofluorescence from the tissues. Nuclei were stained with DAPI (Product # D1306) and the sections were mounted using ProLong™ Glass Antifade Mountant (Product # P36984). The images were captured on EVOS™ M7000 Imaging System (Product # AMF7000) at 20X magnification and externally deconvoluted.
- Submitted by
- Invitrogen Antibodies (provider)
- Main image
- Experimental details
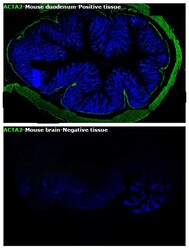
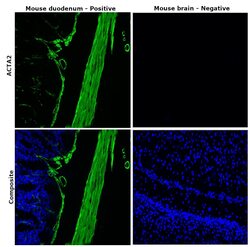
- Immunohistochemical analysis of ACTA2 was performed using formalin-fixed paraffin-embedded mouse duodenum and mouse brain tissue sections. To expose the target protein, heat-induced epitope retrieval was performed on de-paraffinized sections using eBioscience™ IHC Antigen Retrieval Solution - High pH (10X) (Product # 00-4956-58) diluted to 1X solution in water in a microwave at 100 degree Celsius for 10 minutes. Following antigen retrieval, the sections were blocked with 2% normal goat serum in 1X PBS for 45 minutes at room temperature and then probed with Alpha-Smooth Muscle Actin Monoclonal Antibody (1A4), Alexa Fluor™ 488, eBioscience™ (Product # 53-9760-82) at a concentration of 5 µg/mL in 0.1% normal goat serum overnight at 4 degree Celsius in a humidified chamber. ReadyProbes™ Tissue Autofluorescence Quenching Kit (Product # R37630) was used to quench autofluorescence from the tissues. Nuclei were stained with DAPI (Product # D1306) and the sections were mounted using ProLong™ Glass Antifade Mountant (Product # P36984). The images were captured on EVOS™ M7000 Imaging System (Product # AMF7000) at 20X magnification.

- Submitted by
- Invitrogen Antibodies (provider)
- Main image
- Experimental details
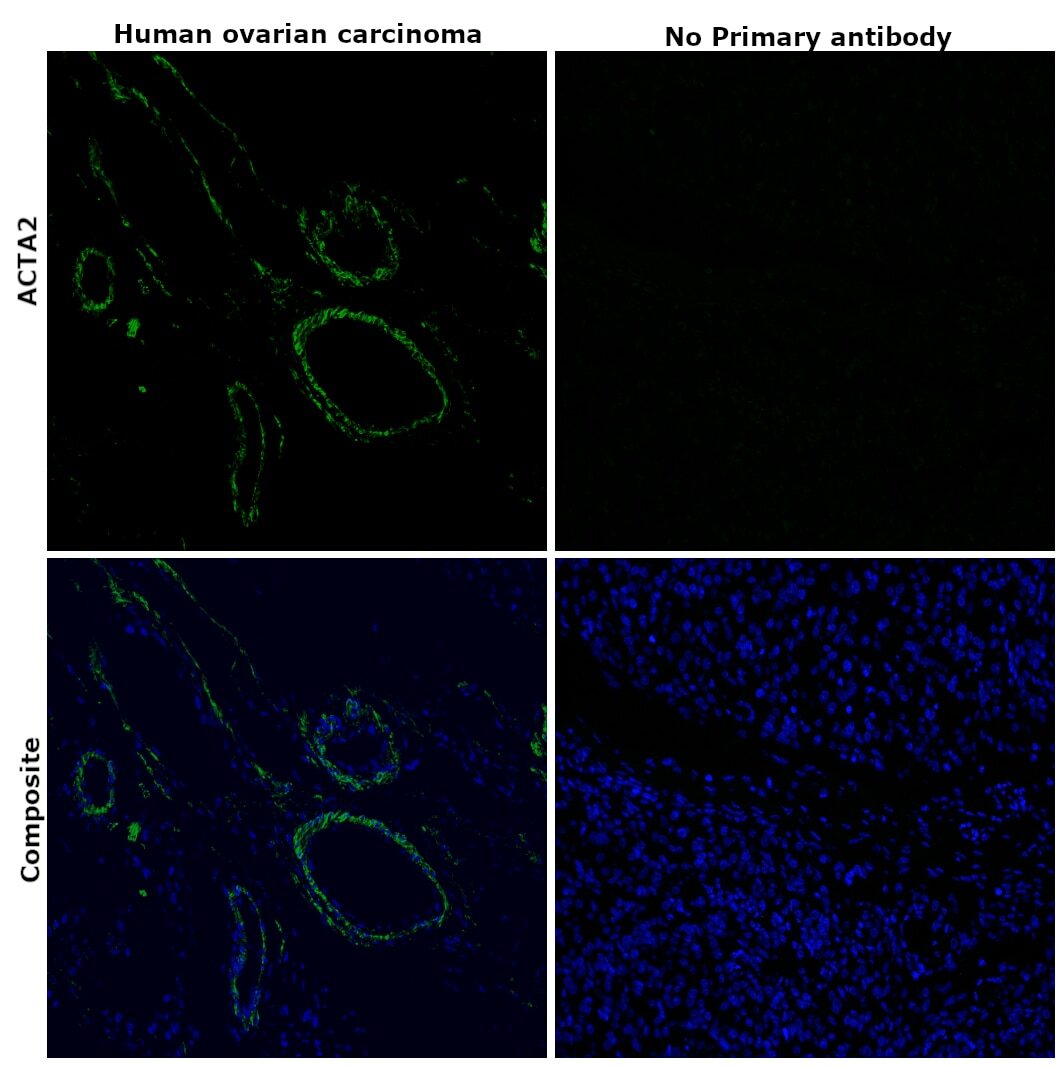
- Immunohistochemical analysis of ACTA2 was performed using formalin-fixed paraffin-embedded human ovarian carcinoma tissue sections. To expose the target protein, heat-induced epitope retrieval was performed on de-paraffinized sections using eBioscience™ IHC Antigen Retrieval Solution - High pH (10X) (Product # 00-4956-58) diluted to 1X solution in water in a decloaking chamber at 110 degree Celsius for 15 minutes. Following antigen retrieval, the sections were blocked with 2% normal goat serum in 1X PBS for 45 minutes at room temperature and then probed with or without Alpha-Smooth Muscle Actin Monoclonal Antibody (1A4), Alexa Fluor™ 488, eBioscience™ (Product # 53-9760-82) at a concentration of 5 µg/mL in 0.1% normal goat serum overnight at 4 degree Celsius in a humidified chamber. ReadyProbes™ Tissue Autofluorescence Quenching Kit (Product # R37630) was used to quench autofluorescence from the tissues. Nuclei were stained with DAPI (Product # D1306) and the sections were mounted using ProLong™ Glass Antifade Mountant (Product # P36984). The images were captured on EVOS™ M7000 Imaging System (Product # AMF7000) at 20X magnification and externally deconvoluted.
- Submitted by
- Invitrogen Antibodies (provider)
- Main image
- Experimental details
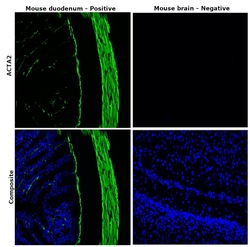
- Immunohistochemical analysis of ACTA2 was performed using formalin-fixed paraffin-embedded mouse duodenum and mouse brain tissue sections. To expose the target protein, heat-induced epitope retrieval was performed on de-paraffinized sections using eBioscience™ IHC Antigen Retrieval Solution - High pH (10X) (Product # 00-4956-58) diluted to 1X solution in water in a microwave at 100 degree Celsius for 10 minutes. Following antigen retrieval, the sections were blocked with 2% normal goat serum in 1X PBS for 45 minutes at room temperature and then probed with Alpha-Smooth Muscle Actin Monoclonal Antibody (1A4), Alexa Fluor™ 488, eBioscience™ (Product # 53-9760-82) at a concentration of 5 µg/mL in 0.1% normal goat serum overnight at 4 degree Celsius in a humidified chamber. ReadyProbes™ Tissue Autofluorescence Quenching Kit (Product # R37630) was used to quench autofluorescence from the tissues. Nuclei were stained with DAPI (Product # D1306) and the sections were mounted using ProLong™ Glass Antifade Mountant (Product # P36984). The images were captured on EVOS™ M7000 Imaging System (Product # AMF7000) at 20X magnification and externally deconvoluted.
- Submitted by
- Invitrogen Antibodies (provider)
- Main image
- Experimental details
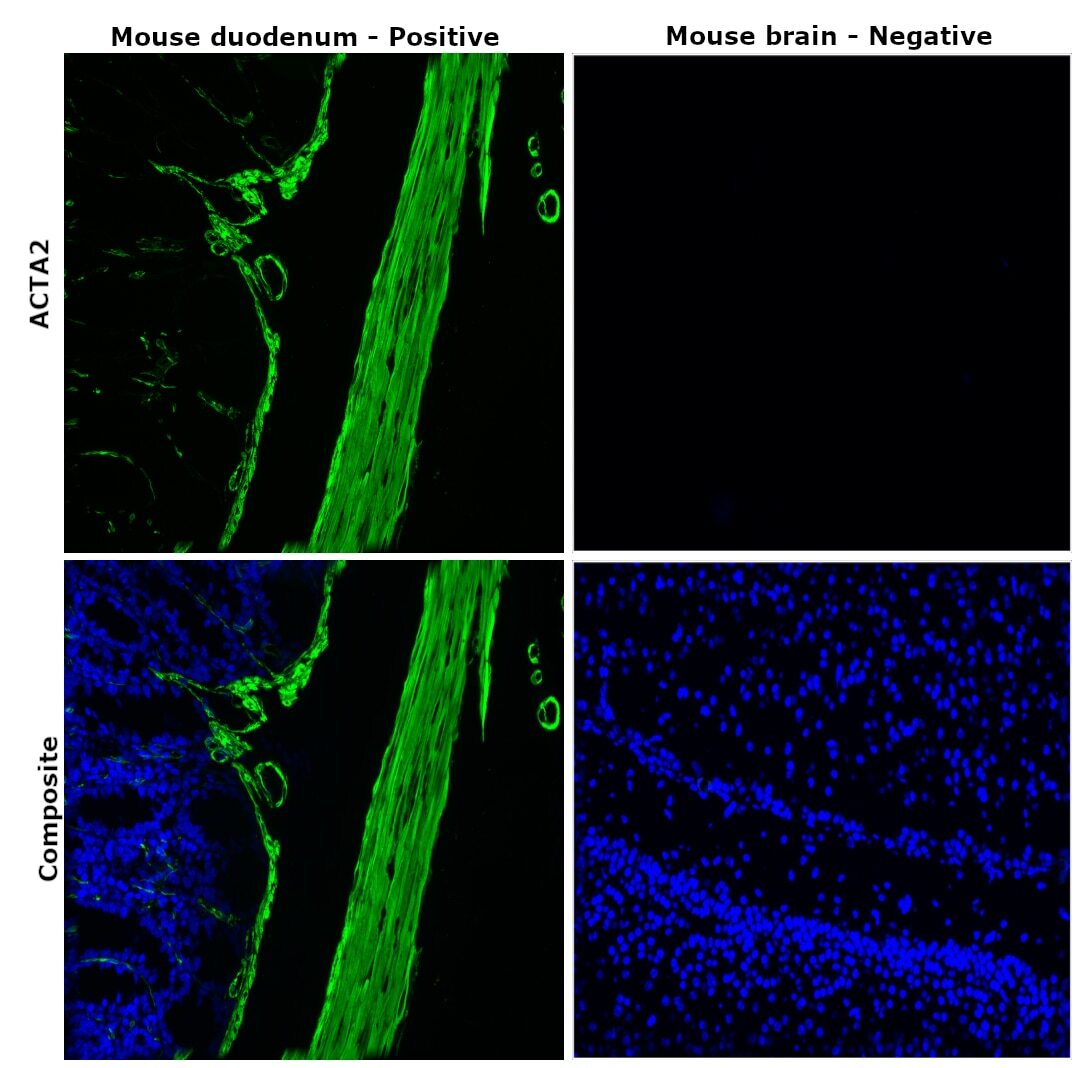
- Immunohistochemical analysis of ACTA2 was performed using formalin-fixed paraffin-embedded mouse duodenum and mouse brain tissue sections. To expose the target protein, heat-induced epitope retrieval was performed on de-paraffinized sections using eBioscience™ IHC Antigen Retrieval Solution - High pH (10X) (Product # 00-4956-58) diluted to 1X solution in water in a microwave at 100 degree Celsius for 10 minutes. Following antigen retrieval, the sections were blocked with 2% normal goat serum in 1X PBS for 45 minutes at room temperature and then probed with Alpha-Smooth Muscle Actin Monoclonal Antibody (1A4), Alexa Fluor™ 488, eBioscience™ (Product # 53-9760-82) at a concentration of 5 µg/mL in 0.1% normal goat serum overnight at 4 degree Celsius in a humidified chamber. ReadyProbes™ Tissue Autofluorescence Quenching Kit (Product # R37630) was used to quench autofluorescence from the tissues. Nuclei were stained with DAPI (Product # D1306) and the sections were mounted using ProLong™ Glass Antifade Mountant (Product # P36984). The images were captured on EVOS™ M7000 Imaging System (Product # AMF7000) at 20X magnification and externally deconvoluted.

Supportive validation
- Submitted by
- Invitrogen Antibodies (provider)
- Main image
- Experimental details
- NULL
- Conjugate
- Green dye
- Submitted by
- Invitrogen Antibodies (provider)
- Main image

- Experimental details
- NULL
- Conjugate
- Green dye
- Submitted by
- Invitrogen Antibodies (provider)
- Main image
- Experimental details
- NULL
- Conjugate
- Green dye
- Submitted by
- Invitrogen Antibodies (provider)
- Main image
- Experimental details
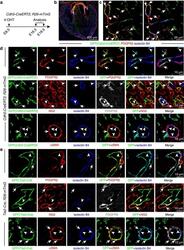
- Figure 3 Cardiac mural cells originate from endothelial cells. ( a - d ) Clonal analysis of Cdh5-CreERT2 Rosa26-mTmG double-transgenic mice. ( a ) Clonal analysis strategy of Cdh5-CreERT2 Rosa26-mTmG mice indicating the stages of 4-hydroxytamoxifen (4-OHT) administration and analysis. ( b ) Overview of GFP+ cell distribution in heart at E16.5. ( c ) Images showing widespread distribution of EC-derived GFP+ PDGFRbeta+ mural cells (arrows). Arrowheads mark GFP- PDGFRbeta+ cells. ( d ) Higher magnification images showing vessel-associated (isolectin B4), EC-derived GFP+ PDGFRbeta+ NG2+ mural cells (arrows) at E16.5 (top and middle row) and GFP+ alphaSMA+ mural cells (arrows) at E18.5 (bottom row). Arrowheads mark GFP+ (green) isolectin B4+ (blue) ECs. Grey channel was not included in merged image. ( e ) Lineage tracing in Tie2-Cre Rosa26-mTmG double-transgenic hearts. Confocal images showing GFP+ PDGFRbeta+ NG2+ and GFP+ alphaSMA+ mural cells (arrows) in association with myocardial capillary ECs (isolectin B4). Arrowheads mark GFP+ (green) isolectin B4+ (blue) ECs. Grey channel was not included in merged image.
- Conjugate
- Green dye
- Submitted by
- Invitrogen Antibodies (provider)
- Main image
- Experimental details
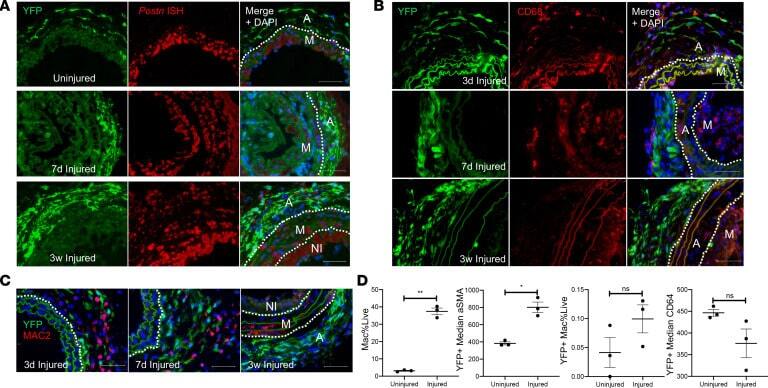
- Figure 5 AdvSca1-SM cells adopt a myofibroblast, and only rarely macrophage, phenotype in response to vascular injury. Gli1 -Cre ERT -YFP mice were subjected to carotid arterial injury, and uninjured right and injured left carotids were harvested at 3 days, 7 days, and 3 weeks postinjury; fixed; and embedded in OCT. ( A ) Arterial sections were immunofluorescently stained for YFP (green), and in situ hybridization was used to detect periostin transcripts (red). Representative images from N = 3 at each time point. Note strong induction of periostin in AdvSca1-SM cells in response to injury. ( B and C ) Arterial sections were immunofluorescently stained for YFP (green) and CD68 ( B ; red) or MAC2 ( C ; red). Representative images from N = 3 per time point. Note that AdvSca1-SM cells do not coexpress either macrophage marker. Scale bars for panels A - C : 50 mum. M, arterial media; A, arterial adventitia; NI, neointima. Dashed lines indicate the external and internal elastic laminae. ( D ) Single-cell suspensions were isolated from uninjured and 7-day postinjured carotid arteries; cells were stained for SCA1, YFP, CD11c, MHCII, LY6G, CD11b, CD64, alphaSMA, and Aqua VI and analyzed by flow cytometry. Total macrophages (left graph) and YFP + AdvSca1-SM cell-derived macrophages (middle right) were quantified as percentage of all live cells. Median expression of alphaSMA (middle left) and CD64 (right) by the YFP + cell population was expressed as absolute value. Each point represent
- Conjugate
- Green dye
- Submitted by
- Invitrogen Antibodies (provider)
- Main image
- Experimental details
- 1 FIGURE Platelet releasates induce myofibroblast differentiation, as evidenced by increased alpha-SMA levels. A, NIH-3T3 cells or (B) GM1381 cells were incubated in 1.5% serum in the presence or absence of releasates from activated human platelets (diluted to 15 µg/mL protein). As indicated, some releasates were previously heat-treated to denature proteins, or digested with ScPPX1 to destroy polyphosphate (red indicates treatment with ScPPX1). After 48 h, antibody staining for alpha-SMA was quantified by confocal microscopy as a marker of myofibroblast differentiation. All values are mean +- SEM (n = 5). Asterisks highlight statistical significance of the indicated comparisons: * P < 0.05, ** P < 0.01, *** P < 0.001 (paired t -tests)
- Conjugate
- Green dye

- Submitted by
- Invitrogen Antibodies (provider)
- Main image
- Experimental details
- 2 FIGURE Polyphosphate induces myofibroblast differentiation, as evidenced by increased alpha-SMA levels and stress fiber formation. A and C, Platelet-size polyphosphate (polyP) increases alpha-SMA levels in NIH-3T3 cells. A, Representative images in which NIH-3T3 cells were cultured in 1.5% serum in the absence (control) or presence of 5 umol/L platelet-sized polyphosphate. After 48 h, cells were stained for alpha-SMA (red) or DNA (green) and imaged by confocal microscopy (bar = 10 um). B and C, Dose-response of NIH-3T3 cells to platelet-size polyphosphate. In 5 experiments, cells were treated for 48 h in 1.5% serum plus the indicated concentrations of platelet-size polyphosphate, after which the following were quantified: (B) integrated intensity of alpha-SMA staining per cell, or (C) percent cells positive for alpha-SMA staining localized along fibrin tendrils (stress fibers). D, Platelet-size polyphosphate increases cell body area. NIH-3T3 cells were cultured in 1.5% serum in the absence or presence of 1 mumol/L polyphosphate for 48 h and imaged by confocal microscopy. Cell body area of individual cells was quantified. E and F, Polymer length-dependence of polyphosphate's ability to induce myofibroblast differentiation in NIH 3T3 cells. Cells were incubated in 1.5% serum for 48 h in the presence or absence of 1 umol/L polyphosphate of the indicated polymer lengths (in phosphate units): (E) integrated intensity of alpha-SMA staining per cell, or (F) percent cells positive
- Conjugate
- Green dye

- Submitted by
- Invitrogen Antibodies (provider)
- Main image
- Experimental details
- 4 FIGURE Polyphosphate is a chemoattractant. A, NIH-3T3 cells were incubated in 1% serum for 20 h in the upper chamber of migration chambers, with the indicated concentrations of platelet-sized polyphosphate in the lower chamber. B, NIH-3T3 cells were incubated in 1% serum for 20 h with 5 mumol/L platelet-sized polyphosphate in the indicated chamber(s), or without polyphosphate (control). C, NIH-3T3 cells were incubated in 1% serum for 20 h in the upper chamber of migration chambers, with the indicated treatments of 3 mumol/L MRS2279 or 5 mumol/L polyphosphate in the lower chamber. Control chambers received no treatment. After collecting and lysing the cells in the lower chamber, CyQUANT signals were expressed as relative fluorescence units (RFU) normalized to the no-polyphosphate control (set to 100 RFU). D, NIH-3T3 cells were cultured in 1.5% serum in the absence (control) or presence of 5 umol/L platelet-sized polyphosphate or 3 mumol/L MRS2279. After 48 h, the integrated intensity of alpha-SMA staining was quantified. All values are mean +- SEM (n = 5). Asterisks highlight statistical significance compared to the no-polyphosphate controls: * P < 0.05, ** P < 0.01, *** P < 0.001 (paired t tests)
- Conjugate
- Green dye
- Submitted by
- Invitrogen Antibodies (provider)
- Main image

- Experimental details
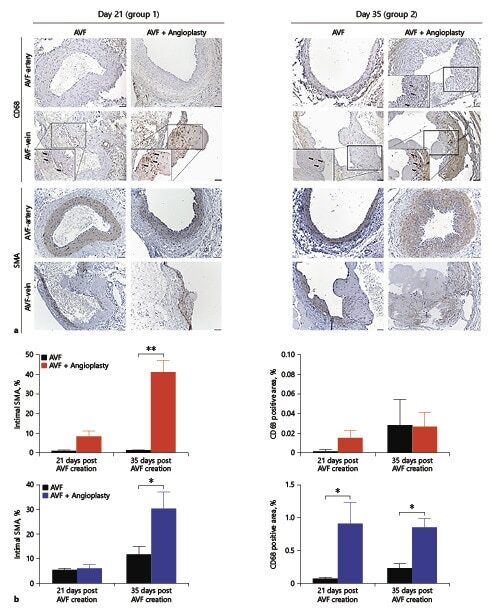
- Fig. 6. alpha-SMA and CD68 expression. a alpha-SMA and CD68 immunostaining of representative sections from groups 1 and 2. Scale bar = 100 muM. Higher magnification images are at 40x. b Quantification of alpha-SMA (intimal region) and CD68 (intimal and medial regions) expression from AVF-artery (top) and AVF-vein (bottom). N = 3-4 in each group. * p < 0.05, ** p < 0.001. An unpaired t test was used to test for statistical differences between AVF without angioplasty and AVF with angioplasty groups. AVF, arteriovenous fistula; alpha-SMA, alpha-smooth muscle actin.
- Conjugate
- Green dye
- Submitted by
- Invitrogen Antibodies (provider)
- Main image
- Experimental details
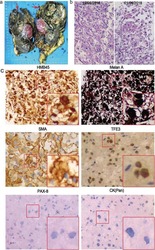
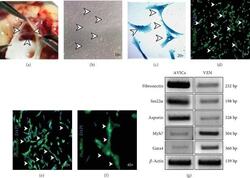
- Figure 1 Isolation and characterization of avian adult aortic valve interstitial cells (AVICs) in vitro . (a) Light microscopic image of tri-cusps at the basement of adult avian aortic valves (arrowheads). (b) Bright filed image (x10) of primary chick AVICs culture. AVIC cells are characterized with filamentous morphology (shown by arrowheads) after 48-72 hr culture. (c) Bright-field images (x20) of Coomassie brilliant blue-stained AVICs with distinct morphology are taken from cultured avian AVIC cells. (d-f) AVICs were immunostained with alpha -Sma (green), marking myofibroblasts, and counterstained with DAPI (blue) positive nuclei (x10 (d), x20 (e), and x40 (f); marked by arrowheads). (g) Gene expression analyses of AVIC-specific markers and Asporin , comparing with ventricle (VEN) markers, by RT-PCR. Here, increased expressions of Fibronectin , Sm22alpha , and Asporin are detected in AVICs compared to the VEN tissue, and in contrast, VEN-specific markers ( Myh7 and Gata4 ) have shown increased expression in the isolated VEN tissue compared to AVIC cells. beta -Actin was used for equal mRNA input and RT efficiency ( n = 3).
- Conjugate
- Green dye

- Submitted by
- Invitrogen Antibodies (provider)
- Main image

- Experimental details
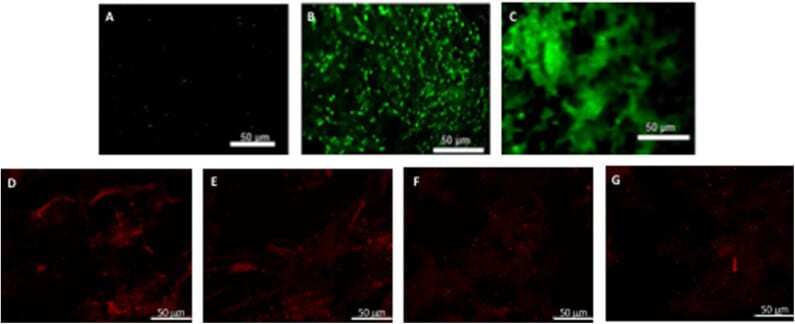
- Figure 5 hBM-MSCs differentiation toward alpha-SMA phenotype. PGA-PLLA scaffolds seeded with hBM-MSCs () demonstrated the presence of alpha-SMA phenotype in (A) static, (B) flex-flow and (C) PHV groups; the same cell-seeded scaffolds from our experiments focusing on (D,E) static, and (F,G) physiologically-relevant oscillatory flow groups demonstrate the presence of alpha-SMA phenotype. Image magnification of 72X.
- Conjugate
- Green dye
- Submitted by
- Invitrogen Antibodies (provider)
- Main image

- Experimental details
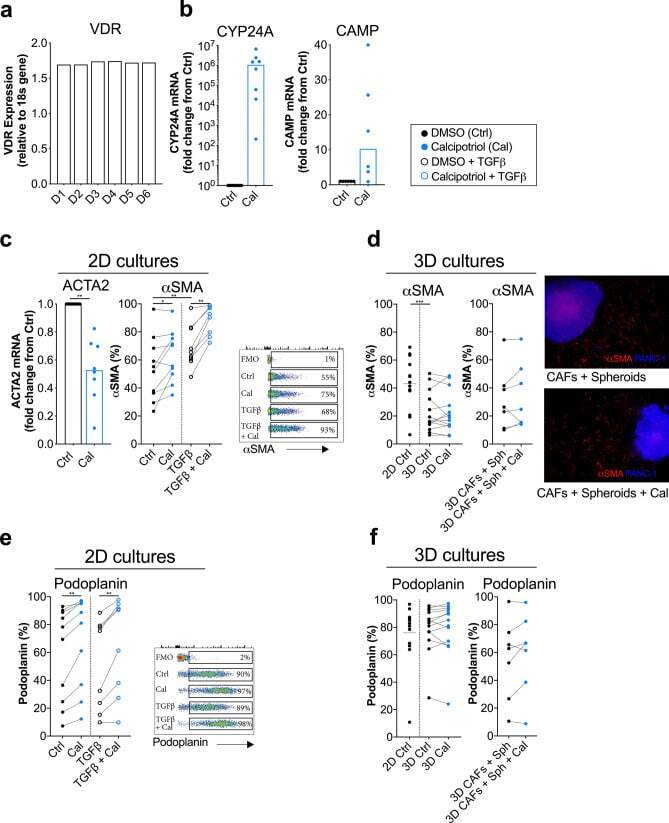
- Figure 1 CAFs respond to the vitamin D 3 analogue calcipotriol. CAFs were treated with either DMSO control (filled circle) or 100 nM calcipotriol (blue filled circle) for 72 h. ( a ) Relative expression levels of VDR gene normalized to the housekeeping gene 18 s in non-treated CAFs ( n = 6). ( b ) Fold change expression of (Left) CYP24A ( n = 8) and (Right) CAMP genes ( n = 6) upon calcipotriol treatment normalized to the DMSO control. ( c ) (Left) fold change gene expression of ACTA2 normalized to the DMSO control ( n = 8). (Middle) expression of alphaSMA in CAFs treated with either DMSO control, calcipotriol, ( n = 11) TGFbeta (open circle) or TGFbeta together with calcipotriol (blue open circle) ( n = 8) in 2D cultures. (Right) representative flow cytometry dot plots of alphaSMA expression with different treatments is shown. ( d ) (Left) expression of alpha-SMA in CAFs cultured in 2D or 3D models treated with either DMSO control or calcipotriol ( n = 13). (Middle) expression of alphaSMA on CAFs co-cultured with spheroids in 3D models ( n = 7). (Right) immunostaining of the 3D models showing alphaSMA expression in CAFs (in red) co-cultured with PANC-1 spheroids (in blue) is shown. ( e ) Expression of podoplanin on CAFs treated with either DMSO control, calcipotriol ( n = 10), TGFbeta or TGFbeta together with calcipotriol ( n = 8) in 2D cultures. Representative flow cytometry dot plots of podoplanin expression with different treatments is shown. ( f ) (Left) expression of po
- Conjugate
- Green dye
- Submitted by
- Invitrogen Antibodies (provider)
- Main image
- Experimental details
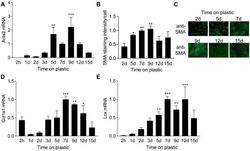
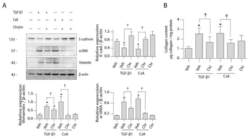
- Fig 1 Cardiac fibroblast differentiation during culture on plastic. Actin alpha 2 smooth muscle (Acta2) mRNA (A) and smooth muscle alpha-actin (SMA) staining intensity (B) in cardiac fibroblasts plated on plastic for different times. C) Representative immunostaining images for SMA. Scale bar 100mum. D) mRNA expression of collagen (Col) 1a1 and lysyl oxidase (Lox) in cardiac fibroblast cultured on plastic for different durations of time. One-way ANOVA with Dunnett''s multiple comparisons test as indicated for significant differences compared to the 1 day time point. N = 3 (2h, 1d, 2d, 3d, 9d, 12d and 15d), N = 5 (5d), N = 9 (7d). mRNA was normalized to ribosomal 18S.
- Conjugate
- Green dye

- Submitted by
- Invitrogen Antibodies (provider)
- Main image

- Experimental details
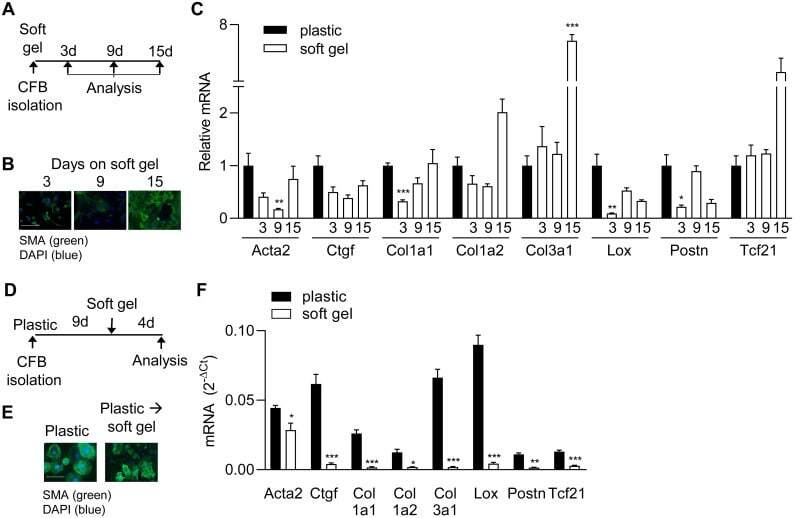
- Fig 2 Relieving cells of high stiffness delays, but does not prevent, myofibroblast differentiation. A) Schematic illustration of protocol used for experiments in B and C. Cardiac fibroblasts were cultured on plastic or soft gels for 3, 9 or 15 days (d) and then analysed. B) Immunostaining for smooth muscle alpha-actin (SMA; green) in cardiac fibroblasts. Nuclei were stained with DAPI (blue). Scale bar 100mum. C) mRNA expression of myofibroblast markers and Tcf21 at 13 days after seeding. Y-axis value, 2 -DeltaCt , represents mRNA levels for each gene relative to 18S rRNA. DeltaCt is the Ct value of the gene of interest minus the Ct value of 18S rRNA. D) Schematic illustration of protocol used for experiments in E and F. Cardiac fibroblasts were cultured on plastic for 9d where after they were either transferred to soft gels of kept on plastic for an additional 4d. E) Immunostaining for SMA (green) in cardiac fibroblasts. Nuclei were stained with DAPI (blue). Scale bar 100mum. F) mRNA expression of myofibroblast markers and Tcf21. Significant differences were determined by Student''s t -test corrected for multiple comparisons using Holm-Sidak test. N = 8 (C, plastic and 3d N = 4 (C, 9d), N = 3 (C, 15d) and N = 3 (F).
- Conjugate
- Green dye
- Submitted by
- Invitrogen Antibodies (provider)
- Main image
- Experimental details
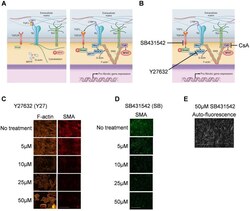
- Fig 3 Effect of different concentration of ROCK and TGFbetaRI inhibitors on smooth muscle alpha-actin fibers. A) Schematic diagram (modified from Herum et al., JCM , 2017) of the three main mechanically activated signalling pathways that lead to myofibroblast differentiation and pro-fibrotic gene expression. B) Inhibition points using the inhibitors Y27632, SB431542 and cyclosporine A (CsA). Immunostaining of cardiac fibroblasts for smooth muscle alpha-actin (SMA) in cardiac fibroblasts treated with different concentrations of Y27632 (C) and SB431542 (D and E). The micrograph in E is the same as in D. Phalloidin was used to stain F-actin (C) and DAPI to stain nuclei (D and E). Scale bar 100mum (C) and 200mum (D and E).
- Conjugate
- Green dye

- Submitted by
- Invitrogen Antibodies (provider)
- Main image
- Experimental details
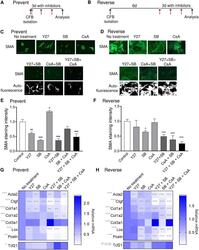
- Fig 4 Inhibiting ROCK and TGFbetaRI is most efficient for preventing and reversing the myofibroblast phenotype. A and B) Schematic illustration of treatment regimen. Red arrows indicate the addition of fresh inhibitor solution every 24h. C and D) Immunostaining for smooth muscle alpha-actin (SMA) in cardiac fibroblasts treated with blockers of ROCK (Y27), TGFbetaRI (SB) and calcineurin (CsA). Scale bar 100mum. E and F) Quantification of SMA staining intensity. G and H) Expression of myofibroblast markers actin alpha 2 smooth muscle (Acta2), connective tissue growth factor (Ctgf), collagen (Col) 1a1, Col1a2, Col3a1, lysyl oxidase (Lox) and periostin (Postn), and the marker of resting cardiac fibroblasts, transcription factor 21 (Tcf21). One-way ANOVA as indicated beside gene name and Dunnett''s multiple comparisons test for significant differences compared to the ""no treatment"" control as indicated in the heat map. N = 3 (E and F), 4 (G) 4-7 (H).
- Conjugate
- Green dye

- Submitted by
- Invitrogen Antibodies (provider)
- Main image

- Experimental details
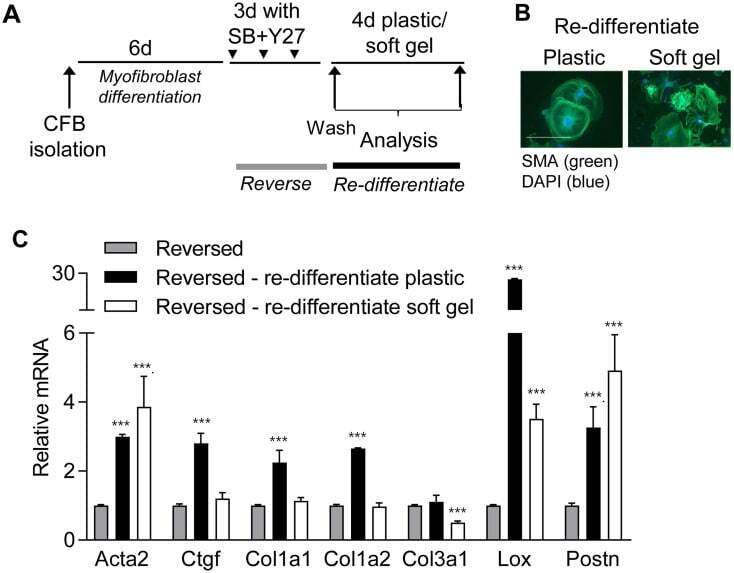
- Fig 6 Reversed cardiac fibroblasts re-differentiate on plastic. A) Schematic illustration of re-differentiation protocol. Cardiac fibroblasts were cultured on plastic for 6 days (d) and then treated with blockers of ROCK (Y27) and TGFbetaRI (SB) for 3d, where after blockers were removed and cells transferred to soft gels for 4d. B) Immunostaining for smooth muscle alpha-actin (SMA; green). Nuclei are stained with DAPI (blue). Scale bar 100mum. C) mRNA expression of actin alpha 2 smooth muscle (Acta2), connective tissue growth factor (Ctgf), collagen (Col) 1a1, Col1a2, Col3a1, lysyl oxidase (Lox) and periostin (Postn) relative to reversed cells (grey bars), following re-differentiation on plastic (black bars) or soft gels (white bars). Significant differences were determined by Student''s t -test with Holm-Sidak correction for multiple comparisons. N = 3.
- Conjugate
- Green dye
- Submitted by
- Invitrogen Antibodies (provider)
- Main image
- Experimental details
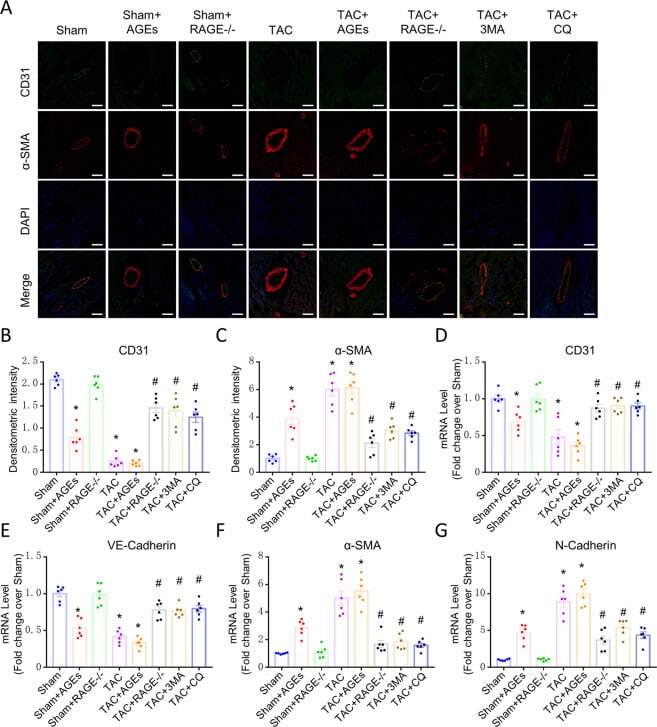
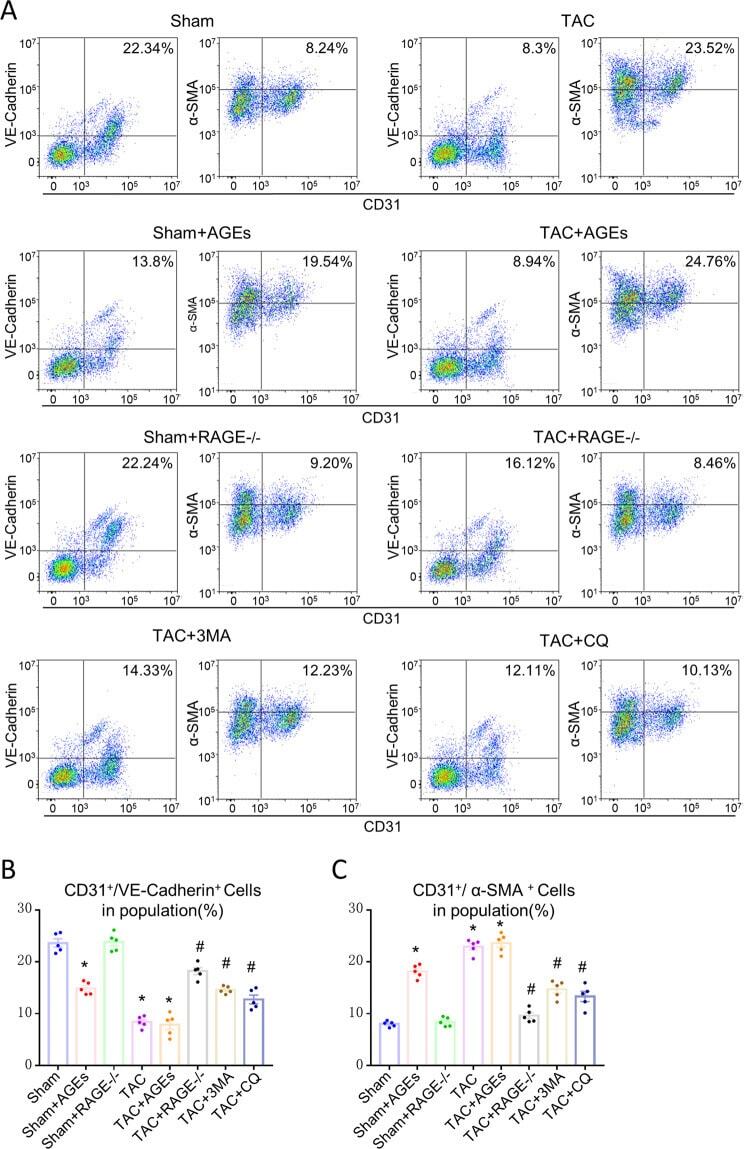
- Fig. 3 Endothelial cells may transition to mesenchymal cells in HF. A Confocal microscopic image of double immunofluorescence staining with CD31 (green) and alpha-SMA (red); nuclei were counter stained with DAPI (blue); Scale bars = 100 um. B , C Quantification of immunofluorescence analysis. mRNAs for endothelial cells-associated genes [CD31 ( D ), VE-Cadherin ( E )] and mesenchymal cells-associated gene [alpha-SMA ( F ) and N-Cadherin ( G )] were measured by qPCR. n = 6. Data are presented as mean +- SEM. * p < 0.05 vs. sham group, # p < 0.05 vs. TAC group.
- Conjugate
- Green dye
- Submitted by
- Invitrogen Antibodies (provider)
- Main image
- Experimental details
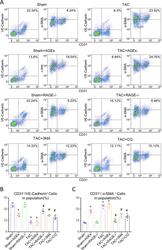
- Fig. 4 EndMT is one origin of myofibroblasts in HF and could be regulated by AGEs/RAGE and autophagy. A Flow cytometry analysis of primary isolates of mouse left ventricular cells. After mechanical disaggregation and enzymatic digestion, single-cell suspensions were incubated with combination of fluorescent antibodies to CD31, VE-Cadherin, and alpha-SMA. B , C Quantification of co-expressed cell analysis. n = 5. Data are presented as mean +- SEM. * p < 0.05 vs. sham group, # p < 0.05 vs. TAC group.
- Conjugate
- Green dye
- Submitted by
- Invitrogen Antibodies (provider)
- Main image
- Experimental details
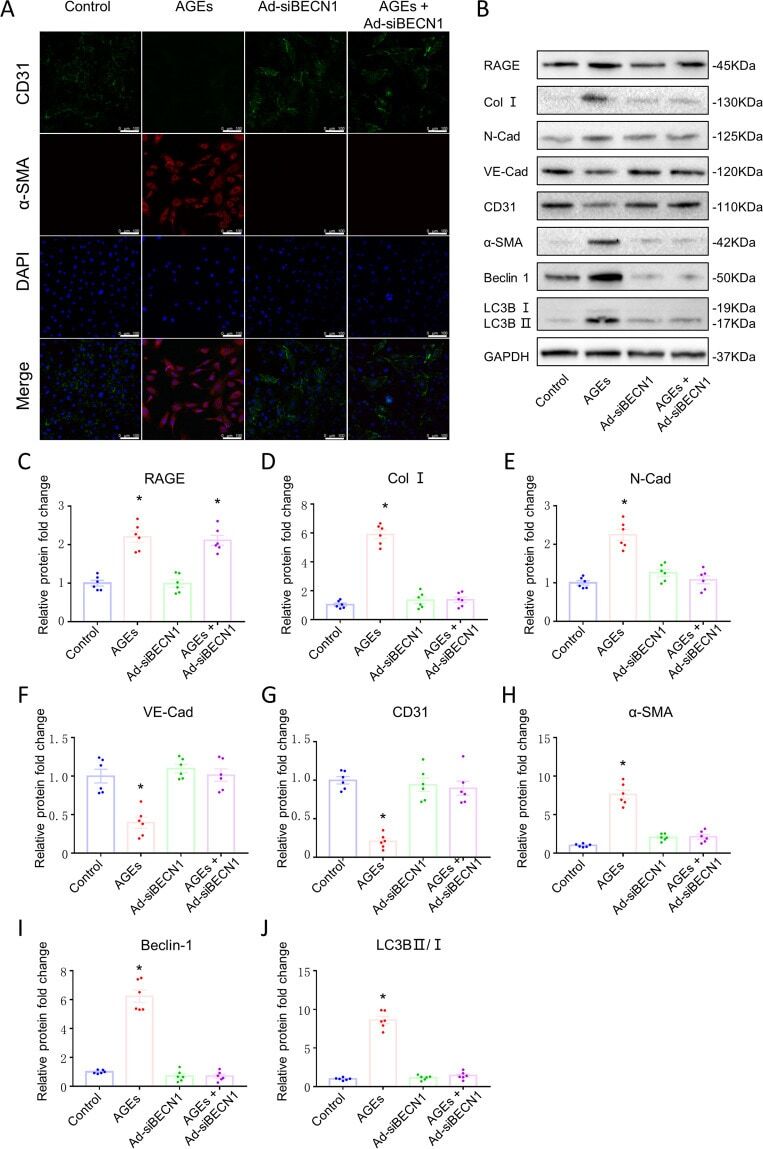
- Fig. 6 AGEs-RAGE induced EndMT by mediating endothelial autophagy in HUVECs. A Confocal microscopic image of double immunofluorescence staining for CD31 (green) and alpha-SMA (red); nuclei were counter stained with DAPI (blue); (Scale bars = 100 um). B Protein expression of Beclin 1, LC3BII/I, RAGE, Collagen I, N-Cadherin, VE-Cadherin, CD31, and alpha-SMA assessed by western blotting. Quantification of RAGE ( C ), COL I ( D ), N-Cadherin ( E ), VE-Cadherin ( F ), CD31 ( G ), alpha-SMA ( H ), Beclin 1 ( I ), and LC3BII/I ( J ). GAPDH was used as the internal control. n = 6. Data are presented as mean +- SEM. * p < 0.05 vs. control group.
- Conjugate
- Green dye
- Submitted by
- Invitrogen Antibodies (provider)
- Main image
- Experimental details
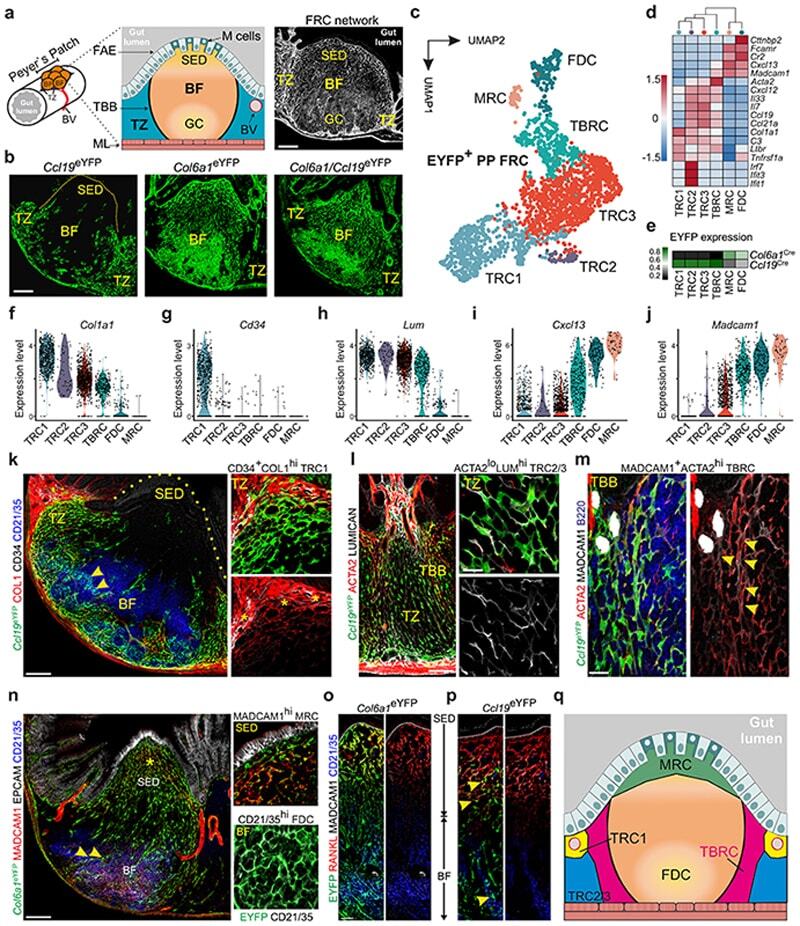
- Figure 1 The FRC landscape of Peyer''s patches. a, Murine Peyer''s patches (PP) consist of large B cell follicles (BF) and interfollicular T cell zones (TZ), demarcated from the gut lumen through the follicle associated epithelium (FAE) with microfold (M) cells and underpinned by a PDPN + VCAM1 + FRC network; BV, blood vessel; GC, germinal center; SED, sub-epithelial dome; TBB, T-B cell zone border. b , Confocal microscopy of EYFP + FRC networks in PP of 6 wk old transgenic mice. c , UMAP analysis of EYFP + PP FRCs from adult Ccl19 eYFP and Col6a1 eYFP mice. d , Hierarchical clustering of averaged expression of canonical FRC marker genes. e , Heatmap showing averaged EYFP-expression in FRC clusters of the indicated lineages. f-j , Violin plots depicting subset specific expression of indicated genes in single FRCs k , Confocal microscopy analysis of BF and SED in PPs of adult Ccl19 eYFP mice. Arrowheads indicate EYFP + CD21/35 + FDCs. Asterisks indicate CD34 hi COL1 hi TRCs. l , Confocal microscopy analysis of the TZ and TBB in PPs of adult Ccl19 eYFP mice. m , FRC network in the TBB, arrowheads indicate ACTA2 hi MADCAM1 + TBRCs. n , Confocal microscopy analysis of BF and SED in PPs of adult Col6a1 eYFP mice. Higher magnification images on the right show EYFP + MADCAM1 + MRC in the SED and EYFP + CD21/35 + FDC networks in the BF. o , p , Confocal microscopy analysis of FRC networks spanning from SED to BF. Arrowheads show EYFP + FDCs and MRCs in Ccl19 eYFP mice. n , Schematic
- Conjugate
- Green dye
- Submitted by
- Invitrogen Antibodies (provider)
- Main image
- Experimental details
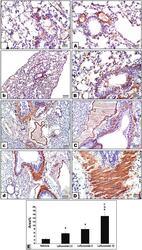
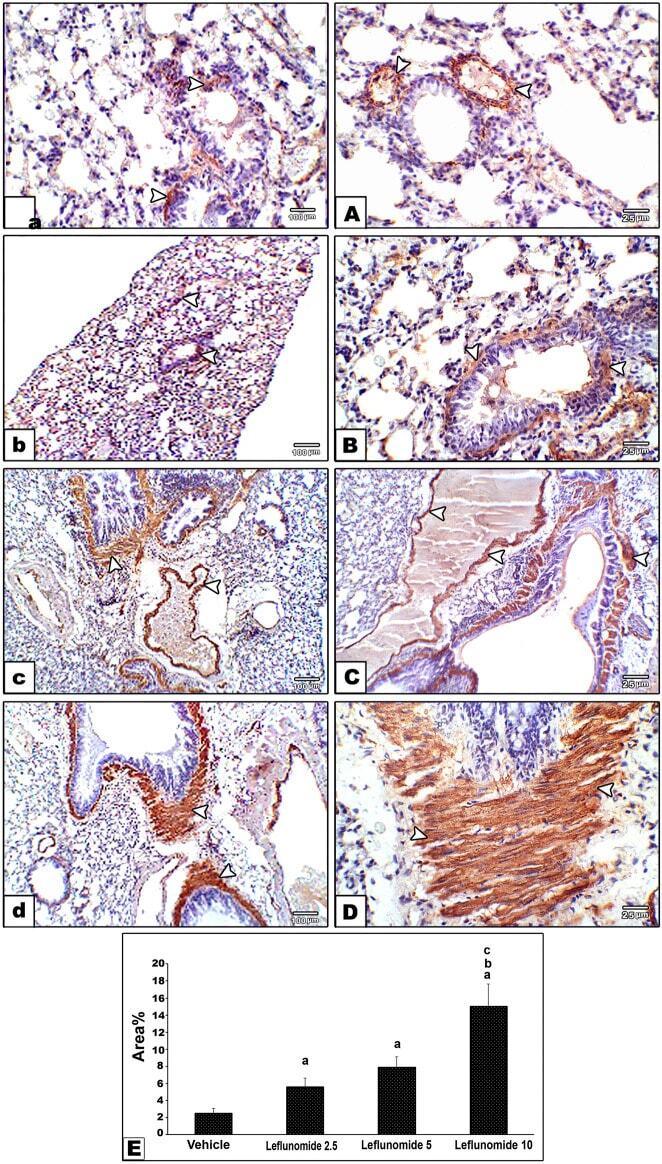
- FIGURE 7 Immunohistochemical staining for alpha-smooth muscle actin in lung sections (A) An image from the vehicle control group (group I) shows mild cytoplasmic expression of smooth muscle actin antibody in perivascular and peribronchiolar muscle coat with also expression in scattered few mesenchymal cells in interalveolar septa. Compared to its gradually and progressively increased expression in leflunomide 2.5 group (B) , leflunomide 5 group (C) and leflunomide 10 group (D) (E) A column chart representing the mean area +- SDM, (A) : vs. the vehicle group, (B) : vs. the leflunomide 2.5 mg per kg group, (C) : vs. the leflunomide 5 mg per kg group at p < 0.05.
- Conjugate
- Green dye
- Submitted by
- Invitrogen Antibodies (provider)
- Main image
- Experimental details
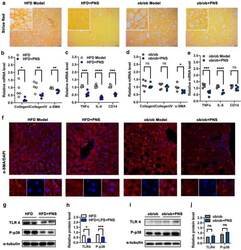
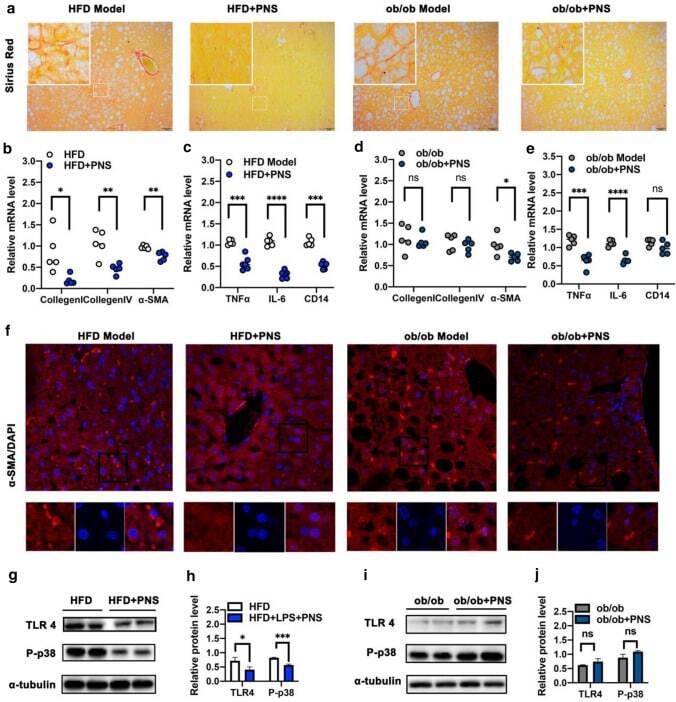
- Fig. 3 PNS attenuated fibrosis associated with TLR 4 pathway in HFD-fed mice but not ob/ob mice. a Representative Sirius Red staining examination in liver sections of ob/ob and HFD mice treated with PNS or vehicle (Scale bars, x 50 mum). b , d The mRNA expression of fibrosis genes, including Collegen I, Collegen IV and alpha-SMA in HFD and ob/ob mice treated with PNS or vehicle. c , e The mRNA levels of inflammatory gens (TNF-alpha, IL-6 and CD14) in HFD and ob/ob mice treated with PNS or vehicle. f Immunofluorescence staining of alpha-SMA protein (red) staining in HFD and ob/ob mice treated with PNS or vehicle (Scale bars, x 20 mum). g - j The expression of TLR4 and phosphorylated p-38 proteins in HFD and ob/ob mice were evaluated by the western blotting analysis
- Conjugate
- Green dye
- Submitted by
- Invitrogen Antibodies (provider)
- Main image
- Experimental details
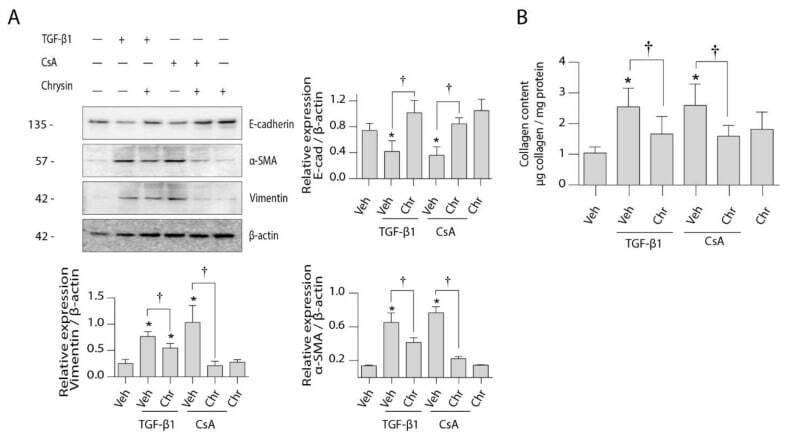
- Figure 5 Effect of chrysin on CsA- or TGF-beta1-induced EMT protein expression. LLC-PK1 cells were treated with vehicle (Veh), 4.2 uM CsA, 5 ng/mL TGF-beta1 or 25 uM chrysin (Chr) or both for 48 h. ( A ) Protein expression of epithelial and mesenchymal markers were assayed using the Western blot method. Representative Western blots for E-cadherin, alphaSMA and vimentin are shown, and data are represented as mean intensity relative to beta-actin +- SD of three individual experiments. ( B ) The amount of collagen deposited in the cell monolayers was assayed by Sircol(tm) Sirius red assay and normalized to protein content. Data are represented as mean collagen content +- SEM of four individual experiments. Statistical significance was determined by one-way ANOVA followed by Tukey's multiple comparison test. * indicates p < 0.05 versus control; + indicates p < 0.05 versus chrysin co-treatment.
- Conjugate
- Green dye
- Submitted by
- Invitrogen Antibodies (provider)
- Main image

- Experimental details
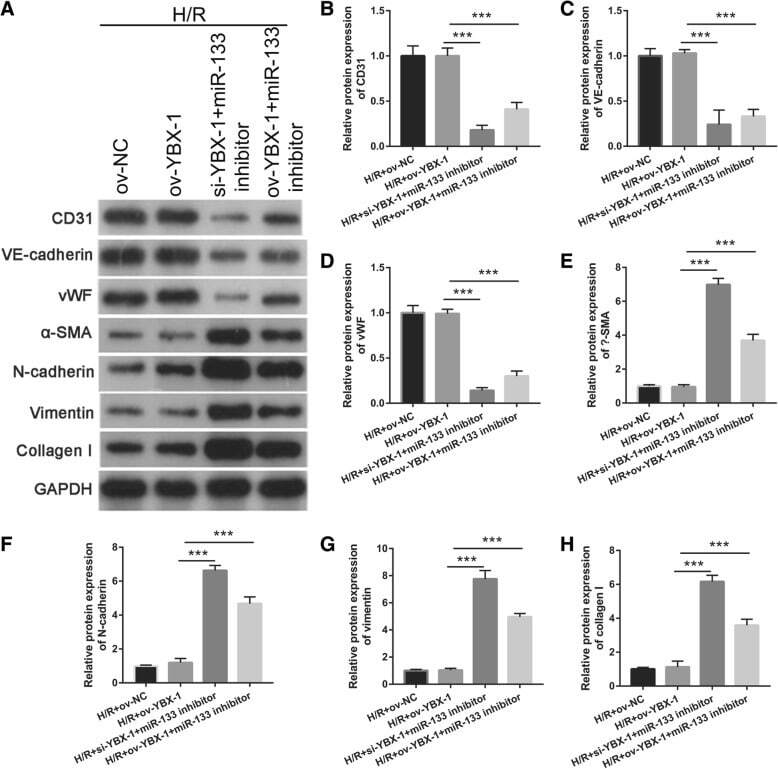
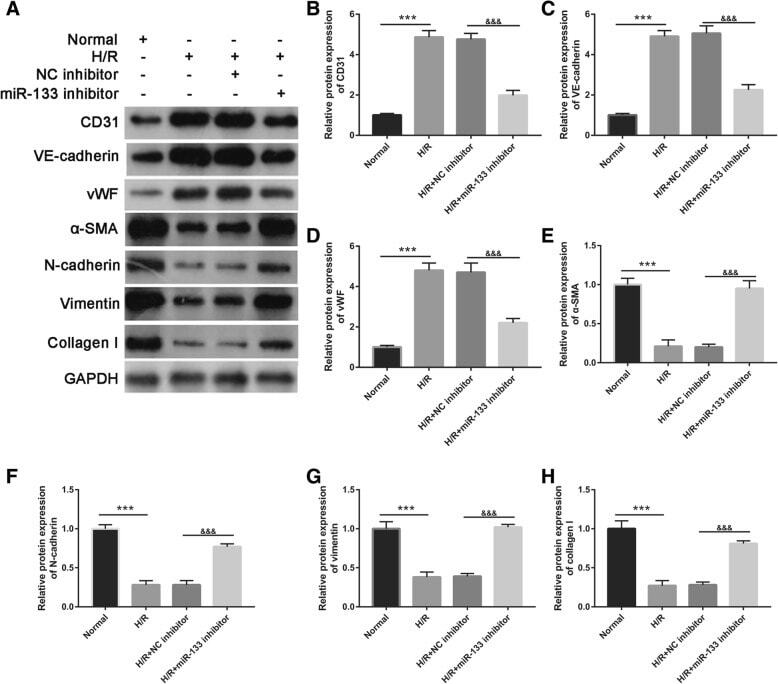
- Fig. 10 Intercellular transfer of miR-133 by H/R-induced EPC-derived exosomes inhibits fibroblast MEndoT. a Endothelial markers CD31, VE-cadherin, and vWF and fibrosis markers alpha-SMA, N-cadherin, vimentin, and collagen I were measured by western blotting in fibroblasts treated with H/R, H/R+ov-NC, H/R+si-YBX1+miR-133 inhibitor, and H/R+ ov-YBX1+miR-133 inhibitor-induced EPC-derived exosomes. b - h The bar graph represents quantification of endothelial markers CD31 ( b ), VE-cadherin ( c ), and vWF ( d ) and fibrosis markers alpha-SMA ( e ), N-cadherin ( f ), vimentin ( g ), and collagen I ( h ) expression per group. *** P < 0.001
- Conjugate
- Green dye
- Submitted by
- Invitrogen Antibodies (provider)
- Main image

- Experimental details
- Fig. 5 Intercellular transfer of miR-133 by H/R-induced EPC-derived exosomes inhibits fibroblast MEndoT. a Endothelial markers CD31, VE-cadherin, and vWF and fibrosis markers alpha-SMA, N-cadherin, vimentin, and collagen I were measured by western blotting in fibroblasts treated with normal cultured EPC-derived exosomes, H/R-induced EPC-derived exosomes, H/R+NC inhibitor-induced EPC-derived exosomes, and H/R+miR-133 inhibitor-induced EPC-derived exosomes. b - h The bar graph represents quantification of endothelial markers CD31 ( b ), VE-cadherin ( c ), and Vwf ( d ) and fibrosis markers alpha-SMA ( e ), N-cadherin ( f ), vimentin ( g ), and collagen I ( h ) expression per group. *** P < 0.001, &&& P < 0.001
- Conjugate
- Green dye
- Submitted by
- Invitrogen Antibodies (provider)
- Main image
- Experimental details
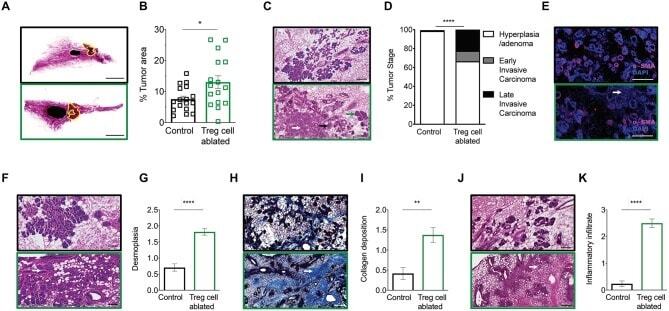
- Figure 2 Treg cell ablation results in advanced tumor staging. (A,B) 10-week-old mammary gland whole mount representative images (A) and quantification (B) of the percentage of tumor area of control (black) and Treg cell-ablated (green) mice ( n = 16-17 individual mammary glands). Scale bars represent 5 mm, * p = 0.0405 calculated by Mann-Whitney test. (C,D) Representative image (C) and quantification (D) of tumor stage. Arrows indicate examples of various tumor stages: hyperplasia/adenoma (green arrow), early invasive carcinoma (black arrow), and late invasive carcinoma (white arrow) (E) alpha-SMA myoepithelial staining confirming disruption of myoepithelial layer (F,G) , representative image (F) and quantification (G) of desmoplasia; (H,I) representative image of Masson trichome staining (H) and quantification (I) of collagen deposition; and (J,K) representative image (J) and quantification (K) of inflammatory infiltration. (E,F,H,J) White arrows indicate examples of histological observation. Values are expressed as mean +- SEM. Tumor staging was compared by two-way ANOVA, **** p < 0.0001; other comparisons were done by Mann-Whitney test. **** p < 0.0001 and ** p = 0.0021. Data were pooled from four independent experiments. (C,E,F,H,J) Scale bars represent 250 mum.
- Conjugate
- Green dye
- Submitted by
- Invitrogen Antibodies (provider)
- Main image
- Experimental details
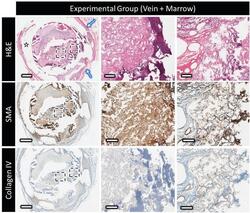
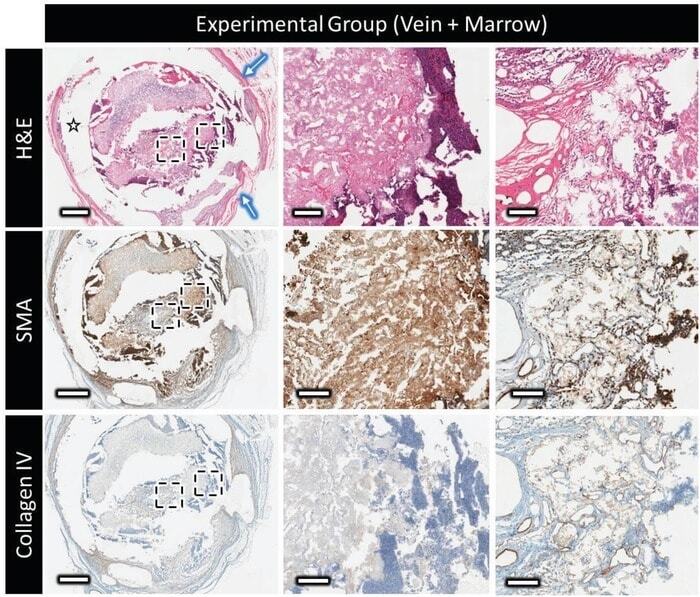
- Figure 6 Decalcified histology and immunohistochemistry of the experimental group (marrow + vein perfusion), showing top to bottom: H&E at low and high magnification showing the distribution and organization of the extracellular matrix outside and within the scaffold (star = polymer clip and blue arrow = thick vascular capsule surrounding the clip); the expression of alpha-smooth muscle actin (displayed in brown); type-IV collagen distribution (in brown). Scale bars on low and high magnification represent 1 mm and 100 um, respectively. Contrast absence of collagen IV staining inside the scaffold with the nonperfused sample in Figure 5 .
- Conjugate
- Green dye
- Submitted by
- Invitrogen Antibodies (provider)
- Main image

- Experimental details
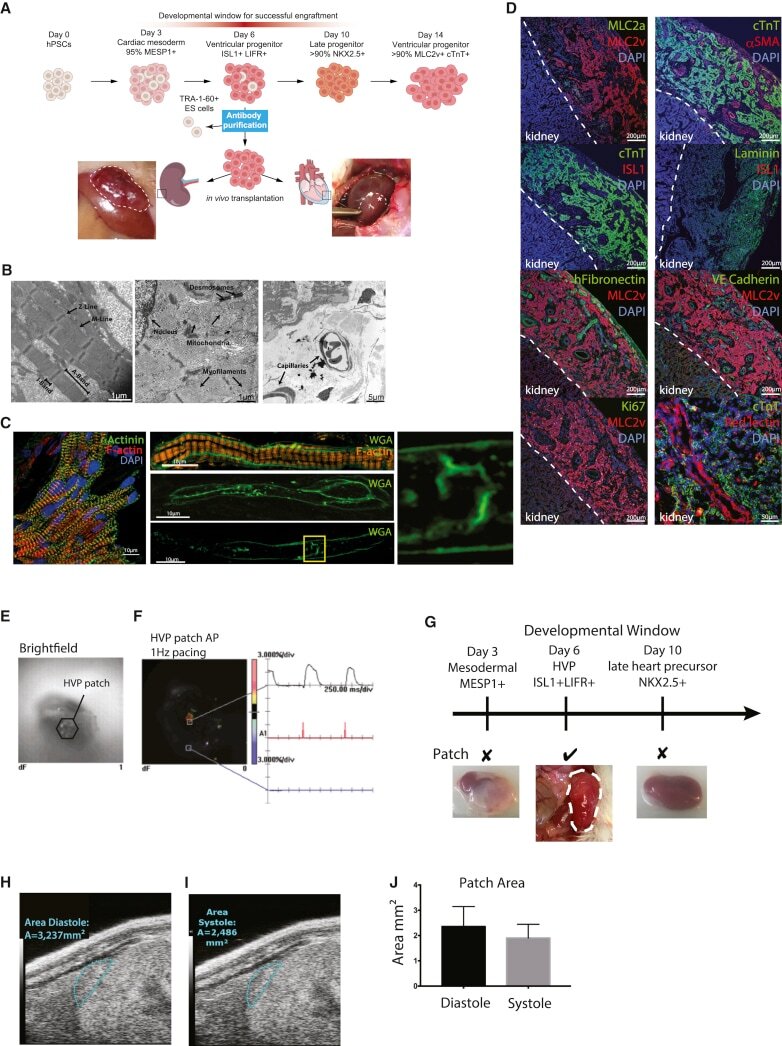
- Figure 3 In Vivo Transplantation of HVPs under Renal Capsule (A) Schematic illustration of HVP generation, differentiation, and transplantation. HVPs were injected under the kidney capsule or intra-myocardially into the heart (injection site marked with squares); photos illustrate where the HVP graft was formed 2 months after transplantation, when it was recovered. (B) Electron microscopy of the HVP patch in the kidney capsule revealed mature ultra-structure, including organized and aligned sarcomeres, with well-defined Z-line, M-line, A-band, and I-band (left micrograph). Also apparent were desmosomes, mitochondria, myofilament bundles (middle panel), and capillaries containing red blood cells (right panel). (C) High-resolution immunofluorescence images further demonstrate sarcomeric organization within HVP grafts, with transverse orientation of a-actinin at z-lines and actin staining between z-lines. Membrane staining (WGA) revealed the presence of developing T-tubules (middle panels, high magnification of indicated region at right). (D) Immunofluorescence staining of the HVP kidney patch, with antibodies against MLC2a, MLC2v, cTnT, aSMA, ISL1, laminin, HCN4, human fibronectin, VE-cadherin, and Ki67. Scale bar, 200 mum. Red lectin was injected via the tail vein, illustrating a direct connection of the HVP kidney patch with the host venous system. Scale bar, 50 mum. (E and F) A 6+-week-old HVP kidney patch was harvested for ex vivo optical mapping and observed under brigh
- Conjugate
- Green dye
- Submitted by
- Invitrogen Antibodies (provider)
- Main image

- Experimental details
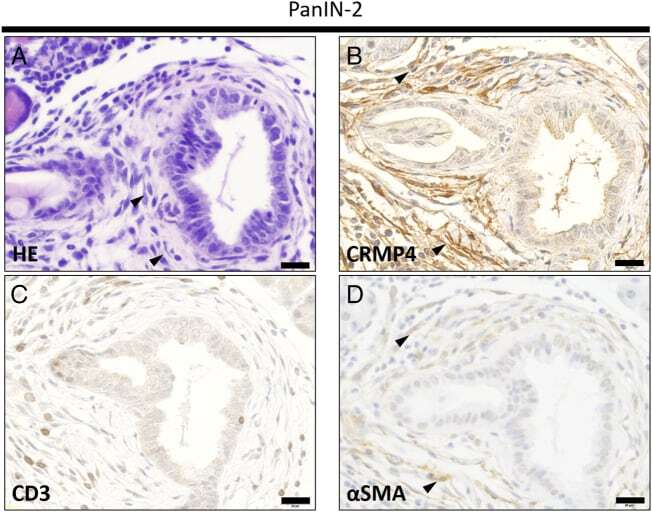
- Figure 4 PanIN lesions and stromal areas in pancreatic tissue from KC- Crmp4 WT mice. (A-D) Serial section of PanIN-2 lesion stained with hematoxylin and eosin (A), anti-CRMP4 (B), anti-CD3 (C), and anti-alphaSMA antibodies (D). CRMP4-positive cells are coincident with alphaSMA-positive cells. Scale bar, 20 mum. All sections represent a PanIN-2 lesion in a KC- Crmp4 WT mouse. Figure 4
- Conjugate
- Green dye
- Submitted by
- Invitrogen Antibodies (provider)
- Main image
- Experimental details
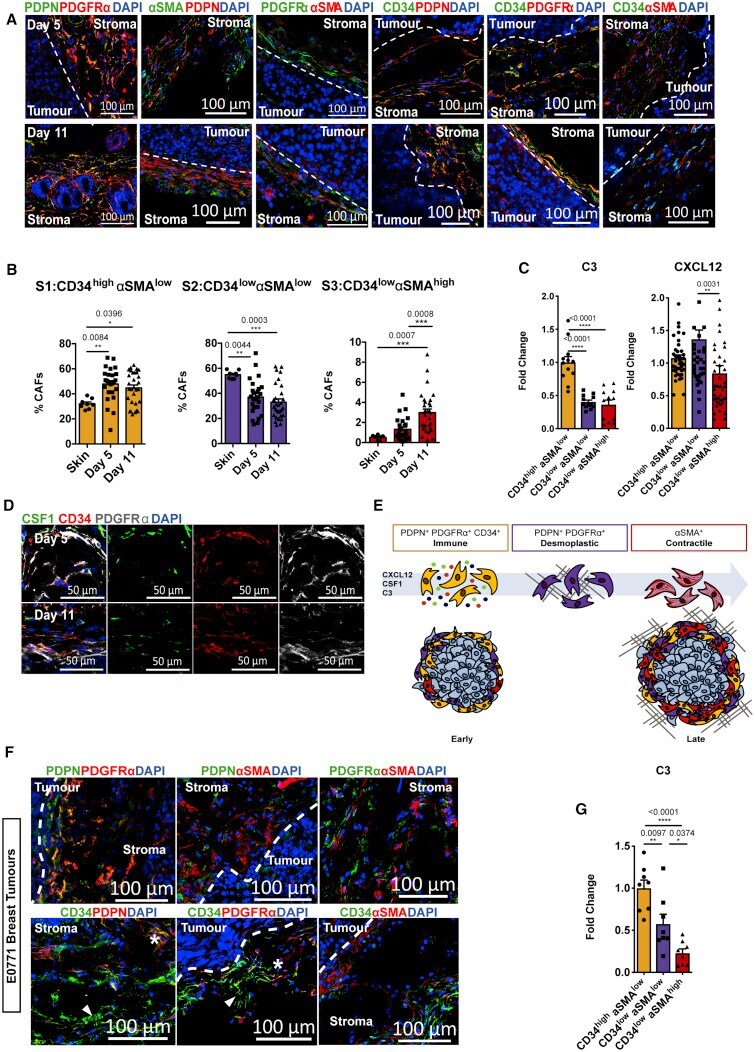
- Figure 5 Conservation of Fibroblast Subpopulations between Murine Tumor Types (A) Representative confocal images of PDPN, PDGFRalpha, and alphaSMA in combination, or CD34 in combination with either PDPN, PDGFRalpha, or alphaSMA (right panel) in day 5 and day 11 tumors. Dashed line indicates the tumor border. Scale bars, 100 mum; images represent at least n = 3 independent mice. (B) Flow cytometry quantification of the proportion of each stromal population at day 5 and day 11 tumors, displayed as a percentage of the total stromal population. Skin, n = 8 mice; day 5, n = 25 mice; day 11, n = 30 mice. (C) Flow cytometric quantification of intracellular CXCL12 and C3 expression in each population presented as fold change in mean fluorescence at day 11, normalized to the CD34 high alphaSMA low population. CXCL12, n = 42 tumors; C3, n = 12 tumors. (D) Representative confocal images of CSF1 expression in CD34 + stromal populations in day 5 and day 11 tumors. Scale bars, 50 mum; images represent at least n = 2 independent mice. (E) Schematic diagram of the 3 stromal subpopulations. (F) Representative confocal images of stromal population markers in orthotopic E0771 breast tumors. Representative confocal images of PDPN, PDGFRalpha, and alphaSMA in combination (top panel) or CD34 in combination with either PDPN, PDGFRalpha, or alphaSMA (bottom panel). Dashed line indicates the tumor border. The asterisk indicates colocalization between CD34 and PDPN or PDGFRalpha; arrowhead indicates C
- Conjugate
- Green dye
- Submitted by
- Invitrogen Antibodies (provider)
- Main image

- Experimental details
- Document S1. Figures S1-S7
- Conjugate
- Green dye

- Submitted by
- Invitrogen Antibodies (provider)
- Main image
- Experimental details
- Document S2. Article plus Supplemental Information
- Conjugate
- Green dye
- Submitted by
- Invitrogen Antibodies (provider)
- Main image
- Experimental details
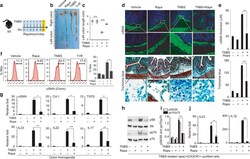
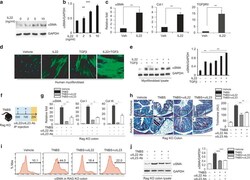
- Fig. 1 Serial TNBS rectal administration promotes the development of intestinal fibrosis. a Schematic diagram showing the regimen of weekly TNBS treatment given to wild-type mice; b Representative images of colon harvested on week 0, 2, 4, and 6 post-TNSB treatment; c Average length of distal colon, called left colon, plotted in the graph ( n = 4-6 mice per group); histological analysis of colon fibrosis shown by representative images of myofibroblasts stained with anti-alphaSMA antibody ( d ) and collagen stained by Trichrome blue ( f ); e Quantification of the thickness of the submucosal alphaSMA-positive layer and average intensity of Trichrome blue staining at week 0, 2, 4, and 6 ( g ); h FACS analysis of alphaSMA-positive cells in the colon, and quantification of alphaSMA-positive cells ( i ); qPCR analysis of fibrosis markers and cytokines ( j ); Data are presented as mean +- SEM ( t -test). n = 3-6/group. k Histological analysis of myofibroblast proliferation with alphaSMA staining and trichrome blue staining for collagen deposition in colon tissue resections from Crohn's disease patients and controls. Quantification of the intensity of trichrome blue and submucosal alphaSMA staining in three pairs of surgical specimens. N = 3 * p < 0.05, ** p < 0.01, *** p < 0.001
- Conjugate
- Green dye

- Submitted by
- Invitrogen Antibodies (provider)
- Main image
- Experimental details
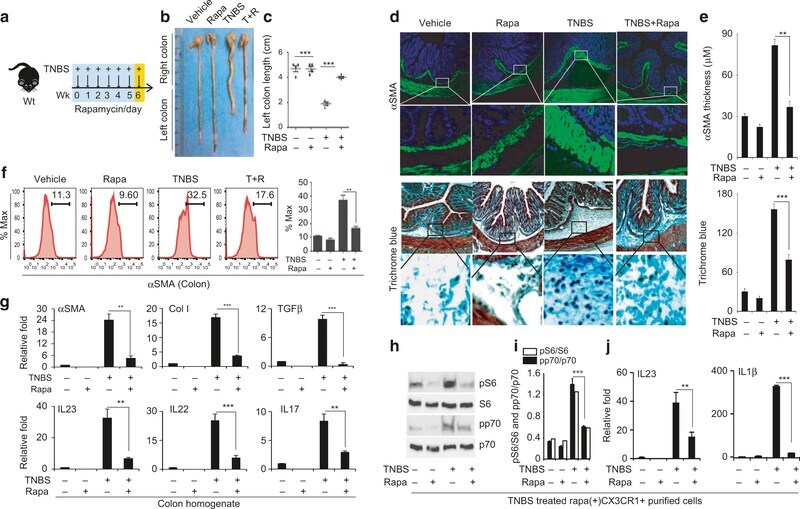
- Fig. 2 Rapamycin effectively ameliorates fibrosis and suppresses induction of IL-23/IL-22 expression. a Schematic diagram showing the treatment regimen of TNBS administered weekly and rapamycin given daily on weekdays to wild-type mice; b , c Representative images of colon harvested on week 6 post-TNBS and/or after rapamycin treatment, and the average length of the left colon ( n = 5-7 mice each group); d Histological analysis of colon fibrosis show representative images of myofibroblast staining with anti-alphaSMA antibody and collagen staining with Trichrome blue; e Quantification of the thickness of the submucosal alphaSMA-positive layer and average intensity of Trichrome blue staining; f FACS analysis of alphaSMA-positive cells in the colon and quantification of alphaSMA-positive cells; g qPCR analysis of fibrosis markers and cytokines; h Western blot analysis of p-p70 and p-S6 levels in purified Cx3cr1 + mononuclear phagocytes from mice treated with TNBS and/or rapamycin; i quantification of p-p70 (open bar) and p-S6 (closed bar) levels; j qPCR analysis of the expression of IL-23 and IL-1beta in purified Cx3cr1 + mononuclear phagocytes; Data are presented as mean +- SEM. n = 5. * p < 0.05, ** p < 0.01, *** p < 0.001
- Conjugate
- Green dye
- Submitted by
- Invitrogen Antibodies (provider)
- Main image
- Experimental details
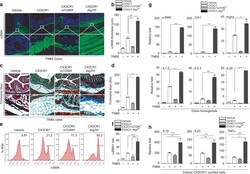
- Fig. 4 Inflammatory and fibrotic responses in Cx3cr1-cremTOR f/f and Cx3cr1-creAtg7 f/f mice. Histological analysis of colon fibrosis in CX3cr1, CX3cr1mTOR f/f , and CX3cr1Atg7 f/f mice. Representative images of myofibroblast staining with anti-alphaSMA antibody ( a ) and collagen staining with Trichrome blue ( c ); Quantification of the thickness of the submucosal alphaSMA-positive layer ( b ) and average intensity of Trichrome blue staining ( d ); e , f FACS analysis and quantification of alphaSMA-positive cells in the colon; g qPCR analysis of fibrosis markers and cytokines; h Expression of IL-23, IL-1beta, and TNFalpha in purified CX3Cr1 + mononuclear phagocytes in mouse colon samples measured by qPCR. Data are presented as mean +- SEM. n = 5, * p < 0.05, ** p < 0.01, *** p < 0.001
- Conjugate
- Green dye

- Submitted by
- Invitrogen Antibodies (provider)
- Main image

- Experimental details
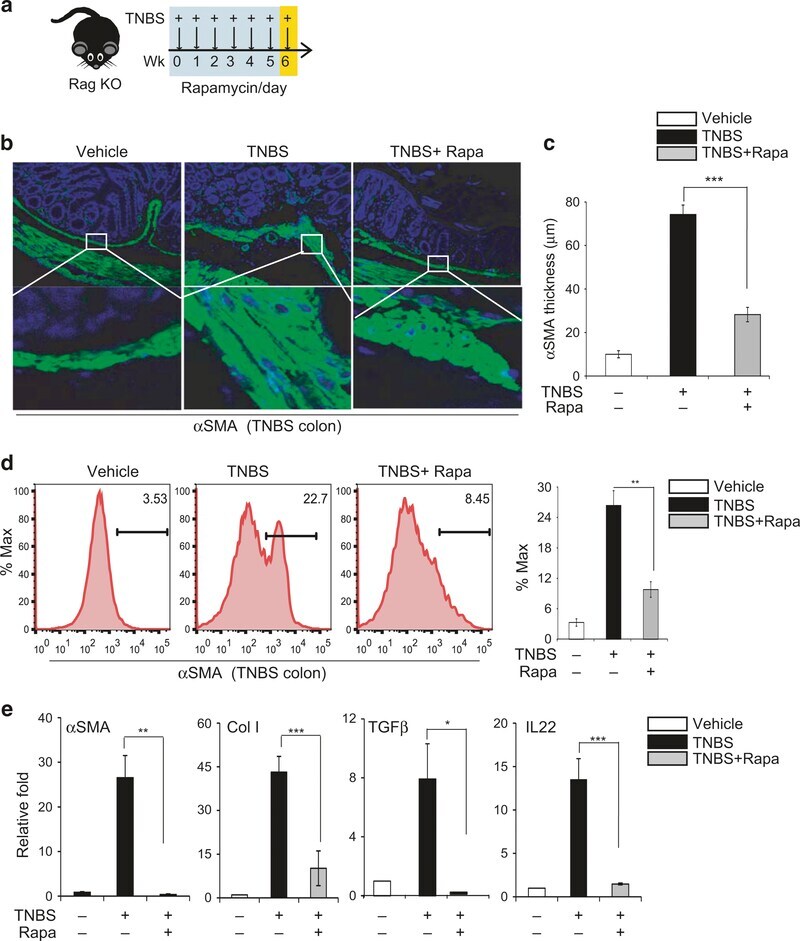
- Fig. 5 Rapamycin attenuates the TNBS-induced fibrotic response in RAG -/- knockout mice, independent of T and B cells. a Diagram showing weekly rectal administration of TNBS and intraperitoneal injection of rapamycin daily (on weekdays) in RAG -/- knockout mice ( n = 4-7 mice per group); b Representative images of alphaSMA staining; c Quantification of the thickness of the submucosal alphaSMA-positive layer; d FACS analysis of alphaSMA-positive cells in the colon and quantification of alphaSMA-positive cells; e qPCR analysis of fibrosis markers and cytokines in purified CX3Cr1 + mononuclear cells from mouse colons. Data are presented as mean +- SEM. n = 3, * p < 0.05, ** p < 0.01, *** p < 0.001
- Conjugate
- Green dye
- Submitted by
- Invitrogen Antibodies (provider)
- Main image
- Experimental details
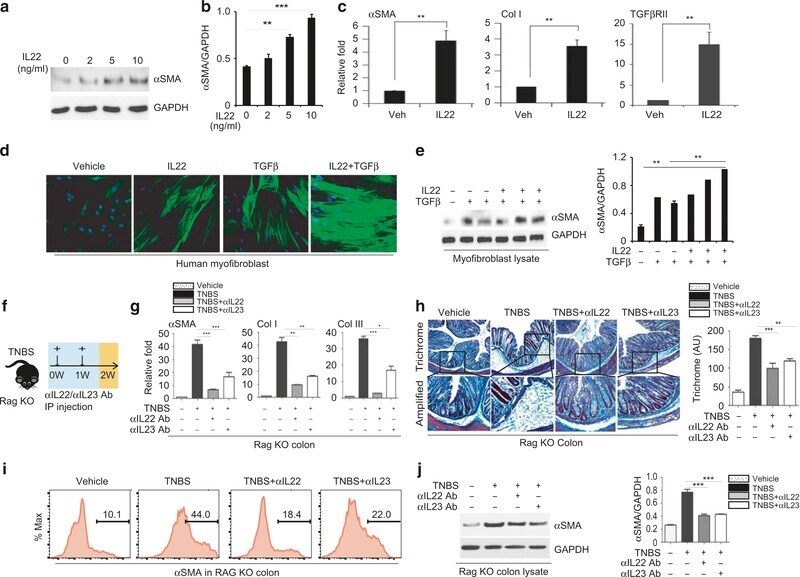
- Fig. 6 IL-22 promotes proliferation of myofibroblasts. a Western blot analysis of alphaSMA expression in cultured human fibroblasts treated with recombinant IL-22 (0 ng, 2 ng, 5 ng, and 10 ng/mL) for 16 h and b quantification of alphaSMA expression normalized to GAPDH; c qPCR analysis of the expression of alphaSMA, Col-I, and TGFbetaRII in fibroblasts stimulated with rIL-22 at 10 ng/mL; d Representative images of alphaSMA staining of cultured fibroblasts treated with rIL-22 (10 ng/mL) and TGFbeta (10 ng/mL) individually or pre-incubated with rIL-22 (10 ng/mL) for 6 h and then stimulated with TGFbeta (10 ng/mL); e Western blot analysis of alphaSMA expression and quantification with normalization to GAPDH control; f Schematic diagram representing weekly rectal administration of TNBS and intraperitoneal injection of 50 mul isotype or anti-IL-22 and anti-IL-23 neutralizing antibodies at 100 mug per mouse every other day in wild-type mice; g qPCR analysis of the expression of alphaSMA, Col-I, and Col-III; h Representative images of trichrome blue staining for collagen deposition. i FACS analysis of alphaSMA + cells and j Western blot analysis of alphaSMA expression. Data are presented as mean +- SEM. n = 3-5 mice/group. ** p < 0.01, *** p < 0.001
- Conjugate
- Green dye
- Submitted by
- Invitrogen Antibodies (provider)
- Main image
- Experimental details
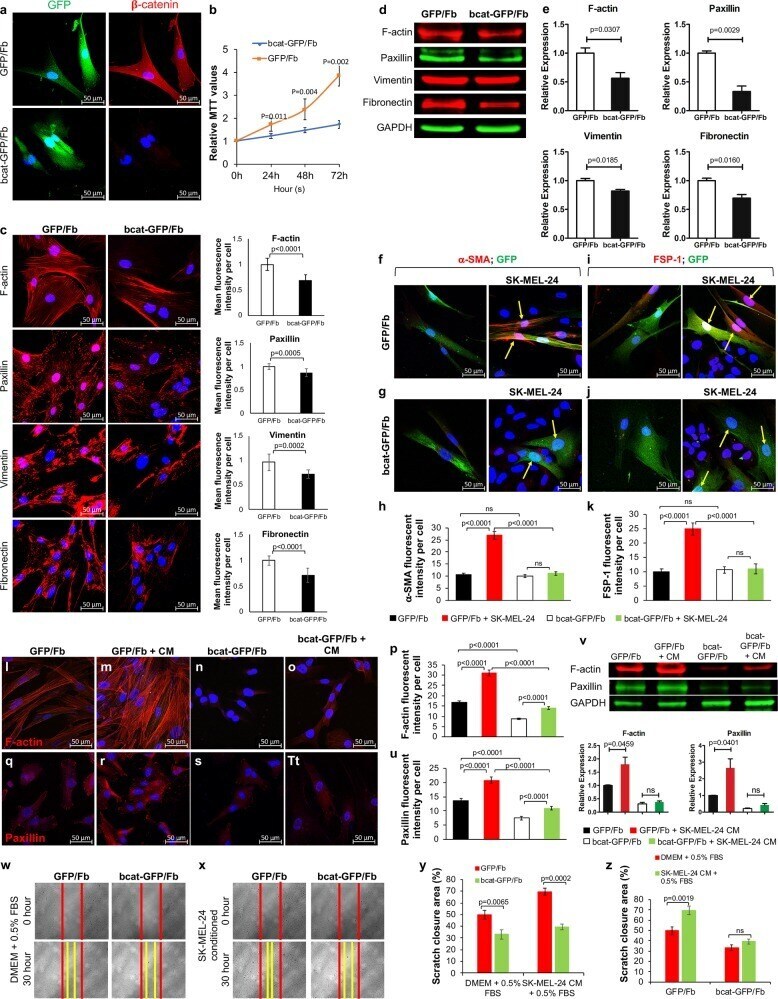
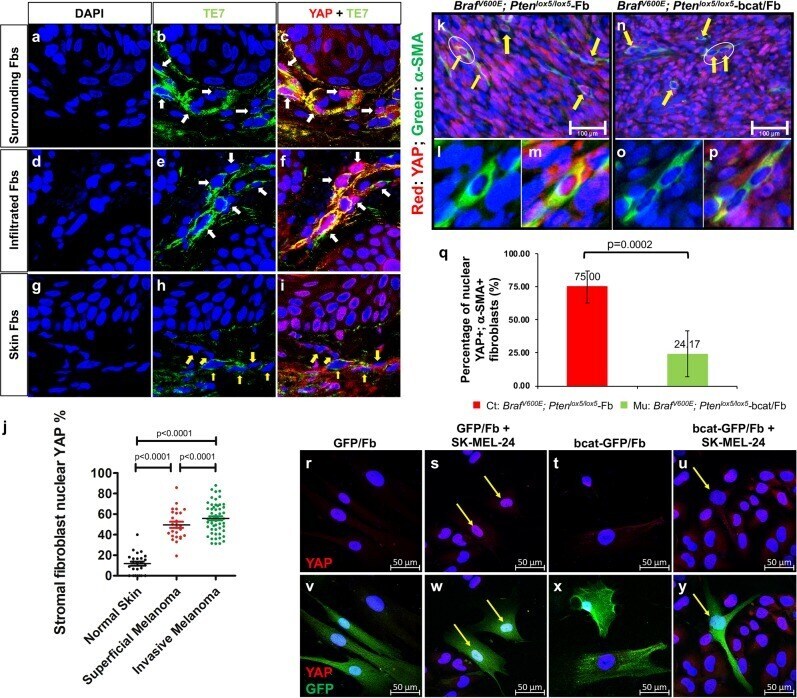
- Fig. 1 beta-catenin is essential for the functional properties of stromal fibroblasts. a GFP/Fb and bcat-GFP/Fb were induced by addition of 500 ng/mL doxycycline to the culture medium for 72 h. Left: GFP expression in GFP/Fb and bcat-GFP/Fb; right: representative images of beta-catenin immunofluorescence staining of GFP/Fb and bcat-GFP/Fb. Scale bar: 50 mum. b The viability of GFP/Fb and bcat-GFP/Fb was compared using the MTT assay. The cells were collected at 0, 24, 48, and 72 h. The data are representative of three independent experiments. c Expression of F-actin, paxillin, vimentin and fibronectin (red) in GFP/Fb and bcat-GFP/Fb was determined by immunostaining after a three-day doxycycline induction with DAPI counterstaining (blue). Scale bar: 50 mum. The mean fluorescence intensities of each immunostained protein in individual GFP/Fb and bcat-GFP/Fb cells were determined using ImageJ. d Expression of F-actin, paxillin, vimentin and fibronectin was measured in total protein extracted from 1 x 10 5 GFP/Fb and bcat-GFP/Fb cells by Western blotting. GAPDH was used as an internal control. e The intensities of the bands of the indicated proteins expressed in GFP/Fb and bcat-GFP/Fb were normalized to the GAPDH signal. The data are representative of three independent experiments. f - g alpha-SMA immunofluorescence staining of GFP/Fb, GFP/Fb + SK-MEL-24 coculture, bcat-GFP/Fb, and bcat-GFP/Fb + SK-MEL-24 coculture with DAPI nuclear costaining. GFP/Fb and bcat-GFP/Fb were tagged w
- Conjugate
- Green dye
- Submitted by
- Invitrogen Antibodies (provider)
- Main image
- Experimental details
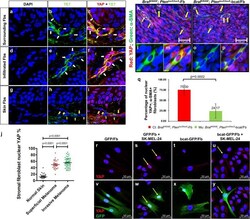
- Fig. 4 The nuclear translocation of YAP is inhibited in melanoma-associated fibroblasts after beta-catenin ablation. The expression of nuclear YAP (red) in fibroblasts (Fbs) in human melanoma tissue (indicated by white arrows) was visualized by coimmunostaining with a fibroblast-specific anti-TE7 antibody (green). a - c Surrounding Fbs. d - f Infiltrated Fbs. g - i Human skin Fbs. Images shown are typical of ten human melanoma samples for each type. j Comparison of the percentages of stromal fibroblasts expressing nuclear YAP among the following: fibroblasts surrounding melanoma, infiltrated fibroblasts in melanoma and stromal fibroblasts in normal human skin. The percentage of stromal fibroblasts expressing nuclear YAP was calculated by dividing the number of nuclear YAP-positive and TE7-positive cells by the total number of TE7-positive cell number in each group. Statistical analysis of differences was carried out by Student's t -tests using GraphPad Prism. k Stromal fibroblasts in Braf V600E ; Pten lox5 -Fb tumors express cytoplasmic and nuclear YAP. Yellow arrows point to fibroblasts expressing nuclear YAP. l - m Enlarged images are shown of fibroblasts circled in k with single alpha-SMA staining l and double YAP/alpha-SMA staining m . n In Braf V600E ; Pten lox5 -bcat/Fb tumors, not only is the number of activated fibroblasts reduced but also the nuclear translocation of YAP was inhibited in fibroblasts. o - p Enlarged images are shown of fibroblasts circled in D with si
- Conjugate
- Green dye
- Submitted by
- Invitrogen Antibodies (provider)
- Main image

- Experimental details
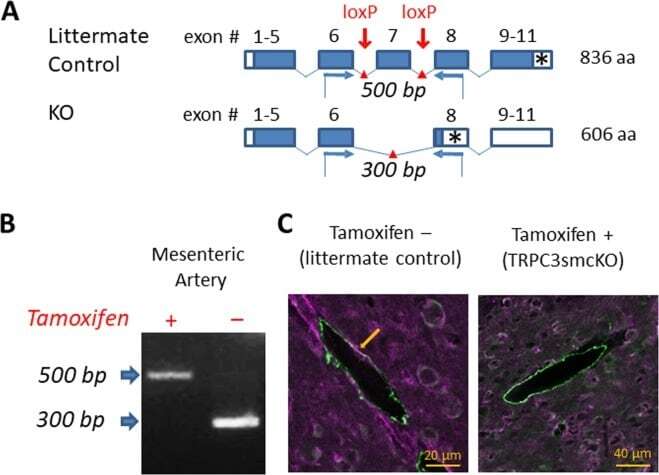
- Figure 1 Generation of the smooth muscle-specific knock out mouse model. ( A ) Schematic illustrating strategy for TRPC3 gene deletion. Open boxes are untranslated exon sequence. Closed boxes are translated open reading frame. Asterisks denote stop codons. Red arrows mark the location of loxP sites targeting the pore-forming region (exon 7) for cleavage by Cre recombinase. Blue arrows denote forward and reverse primers for RT-PCR analysis. ( B ) RT-PCR analysis of mRNA from endothelium-denuded mouse mesenteric arteries from tamoxifen-treated (TRPC3smcKO) or vehicle-treated (littermate control) mice. 500 bp floxed amplicon of exon 7 denotes an intact exon 7 while 300 bp band indicates the cleavage fragment of exon 7 excision. No cleavage fragments were found in any tissue of untreated mice whereas only the 300 bp cleavage fragment was detected in mesenteric artery of tamoxifen-treated mice, demonstrating effective knockout of TRPC3 in SMCs. ( C ) Brain sections fluorescently immunolabeled against TRPC3 (purple) and smooth muscle alpha actin (green). Note the co-localization (white) of TRPC3 and smooth muscle alpha actin in small cerebral arteries of a littermate control and the absence of colocalization in cerebral arteries of a TRPC3smcKO mouse.
- Conjugate
- Green dye
- Submitted by
- Invitrogen Antibodies (provider)
- Main image

- Experimental details
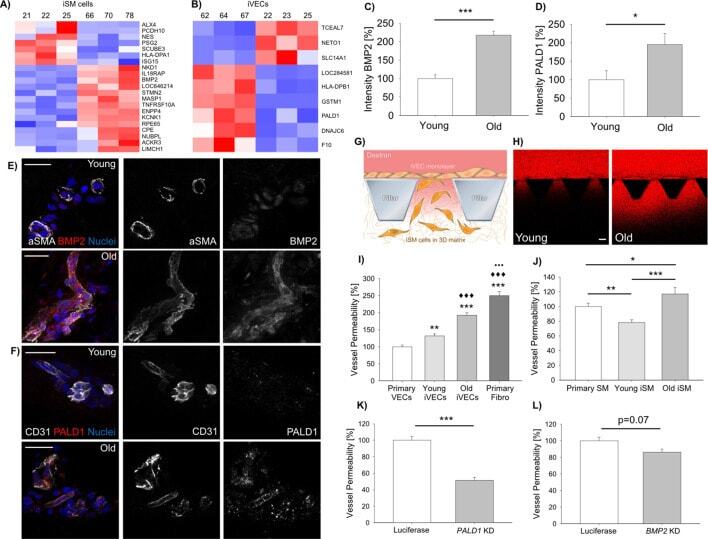
- Figure 2. Vascular cells reprogrammed from young vs. old donors show gene expression and functional differences. Heat-map representing DE genes between reprogrammed vascular cells from young (N = 3) vs. old (N = 3) donors (iSMCs ( A ), iVECs ( B )). Z score = +- 1.5. DE genes with log 2 FC > 1 and FDR < 0.05. Quantification of BMP2 ( C ) and PALD1 ( D ) expression in human skin biopsies from young vs. old donors (N = 2 donors per condition; N = 10 tissue sections per condition; Student's t-test with p
- Conjugate
- Green dye