Explore
 Validate
 Learn
LearnPA5-22230
antibody from Invitrogen Antibodies
Targeting: IFIT3
CIG-49, GARG-49, IFI60, IFIT4, IRG2, ISG60, RIG-G
 Western blot
 Immunocytochemistry
Antibody data
- Antibody Data
- Antigen structure
- References [3]
- Comments [0]
- Validations
- Immunocytochemistry [3]
- Immunohistochemistry [1]
- Other assay [6]
Submit
Validation data
Reference
Comment
Report error
- Product number
- PA5-22230 - Provider product page

- Provider
- Invitrogen Antibodies
- Product name
- IFIT3 Polyclonal Antibody
- Antibody type
- Polyclonal
- Antigen
- Recombinant full-length protein
- Description
- Recommended positive controls: 293T. Predicted reactivity: Chimpanzee (99%). Store product as a concentrated solution. Centrifuge briefly prior to opening the vial.
- Reactivity
- Human, Mouse
- Host
- Rabbit
- Isotype
- IgG
- Vial size
- 100 μL
- Concentration
- 0.3 mg/mL
- Storage
- Store at 4°C short term. For long term storage, store at -20°C, avoiding freeze/thaw cycles.
Submitted references Inflammatory IFIT3 renders chemotherapy resistance by regulating post-translational modification of VDAC2 in pancreatic cancer.
Interferon-Induced Protein With Multiple Tetratricopeptide Repeats 3 Is Associated With Response to Chemotherapy and Recurrence but Not With Survival.
IFIT3 and IFIT2/3 promote IFIT1-mediated translation inhibition by enhancing binding to non-self RNA.
Wang Z, Qin J, Zhao J, Li J, Li D, Popp M, Popp F, Alakus H, Kong B, Dong Q, Nelson PJ, Zhao Y, Bruns CJ
Theranostics 2020;10(16):7178-7192
Theranostics 2020;10(16):7178-7192
Interferon-Induced Protein With Multiple Tetratricopeptide Repeats 3 Is Associated With Response to Chemotherapy and Recurrence but Not With Survival.
Popp MC, Klippstein M, Lohneis P, Kalinski T, Li J, Quaas A, Bludau M, Wang Z, Waldschmidt D, Kunzmann V, Damanakis A, Gebauer F, Zhao Y, Bruns CJ, Popp FC
Pancreas 2020 Nov Dec;49(10):1307-1314
Pancreas 2020 Nov Dec;49(10):1307-1314
IFIT3 and IFIT2/3 promote IFIT1-mediated translation inhibition by enhancing binding to non-self RNA.
Fleith RC, Mears HV, Leong XY, Sanford TJ, Emmott E, Graham SC, Mansur DS, Sweeney TR
Nucleic acids research 2018 Jun 1;46(10):5269-5285
Nucleic acids research 2018 Jun 1;46(10):5269-5285
No comments: Submit comment
Supportive validation
- Submitted by
- Invitrogen Antibodies (provider)
- Main image
- Experimental details
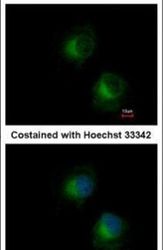
- Immunofluorescent analysis of IFIT3 in methanol-fixed HeLa cells using an IFIT3 polyclonal antibody (Product # PA5-22230) at a 1:500 dilution.

- Submitted by
- Invitrogen Antibodies (provider)
- Main image

- Experimental details
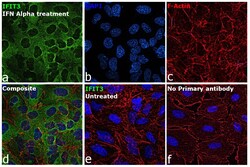
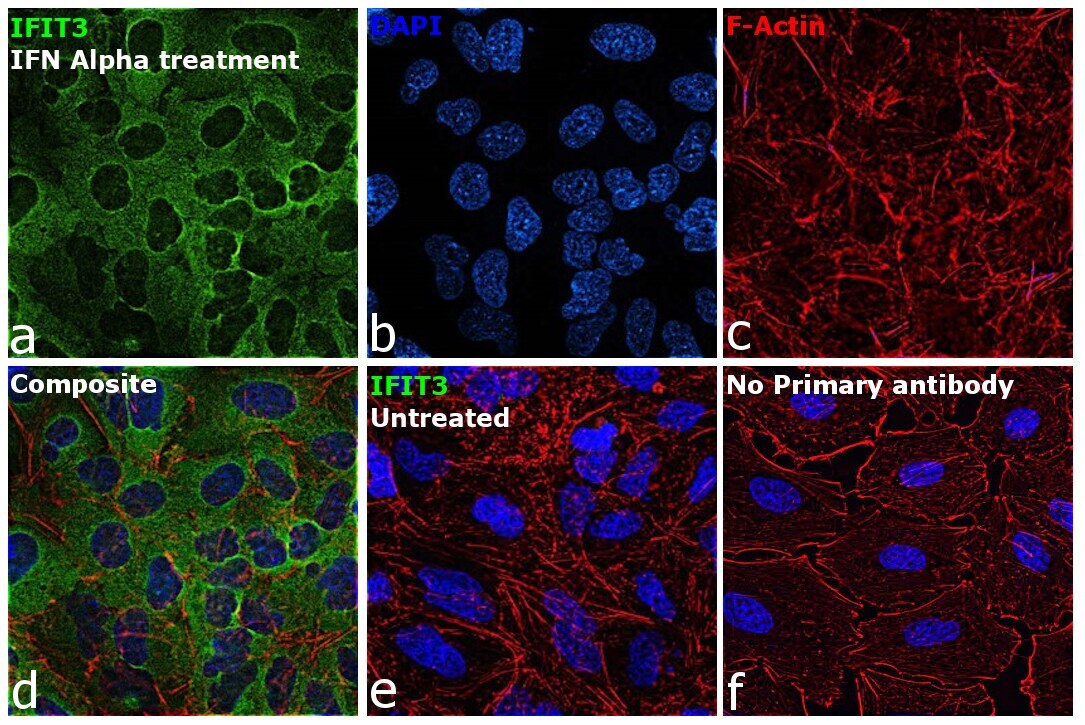
- Immunofluorescence analysis of Interferon-induced protein with tetratricopeptide repeats 3 was performed using 70% confluent log phase A549 treated with Human IFN Alpha (500 U/mL for 24 hrs). The cells were fixed with 4% paraformaldehyde for 10 minutes, permeabilized with 0.1% Triton™ X-100 for 15 minutes, and blocked with 2% BSA for 45 minutes at room temperature. The cells were labeled with IFIT3 Polyclonal Antibody (Product # PA5-22230) at 1:100 dilution in 0.1% BSA, incubated at 4 degree celsius overnight and then labeled with Donkey anti-Rabbit IgG (H+L) Highly Cross-Adsorbed Secondary Antibody, Alexa Fluor Plus 488 (Product # A32790), (1:2000 dilution), for 45 minutes at room temperature (Panel a: Green). Nuclei (Panel b:Blue) were stained with ProLong™ Diamond Antifade Mountant with DAPI (Product # P36962). F-actin (Panel c: Red) was stained with Rhodamine Phalloidin (Product # R415, 1:300 dilution). Panel d represents the merged image showing cytoplasmic localization. Panel e represents no signal in untreated cells Panel f represents control cells with no primary antibody to assess background. The images were captured at 60X magnification.

- Submitted by
- Invitrogen Antibodies (provider)
- Main image
- Experimental details
- Immunofluorescence analysis of Interferon-induced protein with tetratricopeptide repeats 3 was performed using 70% confluent log phase A549 treated with Human IFN Alpha (500 U/mL for 24 hrs). The cells were fixed with 4% paraformaldehyde for 10 minutes, permeabilized with 0.1% Triton™ X-100 for 15 minutes, and blocked with 2% BSA for 45 minutes at room temperature. The cells were labeled with IFIT3 Polyclonal Antibody (Product # PA5-22230) at 1:100 dilution in 0.1% BSA, incubated at 4 degree celsius overnight and then labeled with Donkey anti-Rabbit IgG (H+L) Highly Cross-Adsorbed Secondary Antibody, Alexa Fluor Plus 488 (Product # A32790), (1:2000 dilution), for 45 minutes at room temperature (Panel a: Green). Nuclei (Panel b:Blue) were stained with ProLong™ Diamond Antifade Mountant with DAPI (Product # P36962). F-actin (Panel c: Red) was stained with Rhodamine Phalloidin (Product # R415, 1:300 dilution). Panel d represents the merged image showing cytoplasmic localization. Panel e represents no signal in untreated cells Panel f represents control cells with no primary antibody to assess background. The images were captured at 60X magnification.
Supportive validation
- Submitted by
- Invitrogen Antibodies (provider)
- Main image
- Experimental details
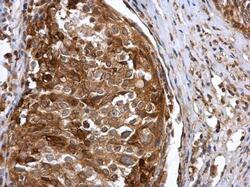
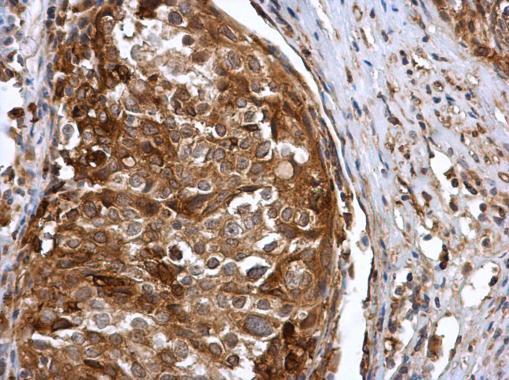
- Immunohistochemistry (Paraffin) analysis of IFIT3 was performed in paraffin-embedded human cervical carcinoma tissue using IFIT3 Polyclonal Antibody (Product # PA5-22230) at a dilution of 1:500.
Supportive validation
- Submitted by
- Invitrogen Antibodies (provider)
- Main image
- Experimental details
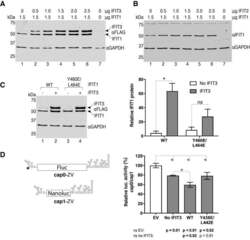
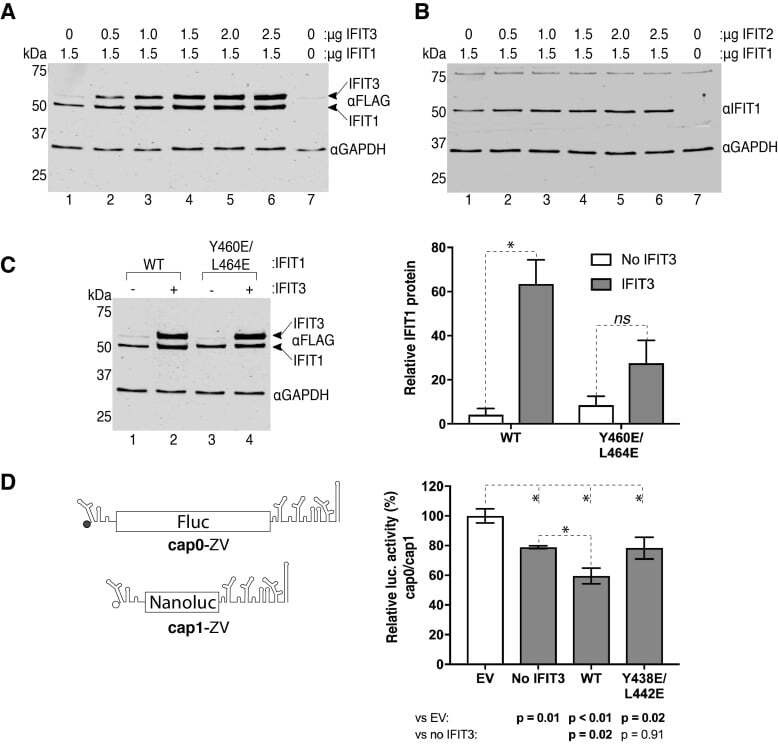
- Figure 6. IFIT3 stabilizes and promotes IFIT1 activity in cells. ( A and B ) HEK293T cells were transfected with the indicated amounts of plasmid encoding FLAG-tagged versions of IFIT1, IFIT2 and IFIT3. After 24 hours cell lysates were harvested and analyzed by western blotting. (A) anti-FLAG and (B) anti-IFIT1 blots are shown. Empty vector was used to normalize the amount of DNA used in each transfection. The blots shown are representative of three separate experiments. ( C ) HEK293T cells were transfected with 1.5 mug of FLAG-tagged wild type (WT) or mutant IFIT1 and 1.5 mug of FLAG-tagged IFIT3 or empty vector as indicated. After 24 h cell lysates were analyzed as in A. The graph on right shows the quantification of the IFIT1 protein expression relative to GAPDH probed as a loading control. Mean +- the standard deviation of three biological repeats. ( D ) Reporter luciferase was measured as described in the Materials and Methods and expressed as the ratio of Fluc (cap0) over Nanoluc (cap1) signal, normalized to the empty vector control, and shown as the mean +- the standard deviation of three biological repeats. Statistical analysis was performed using an unpaired, two-tailed Students t-test. P -values are indicated, and * denotes statistical significance.
- Submitted by
- Invitrogen Antibodies (provider)
- Main image
- Experimental details
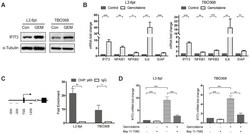
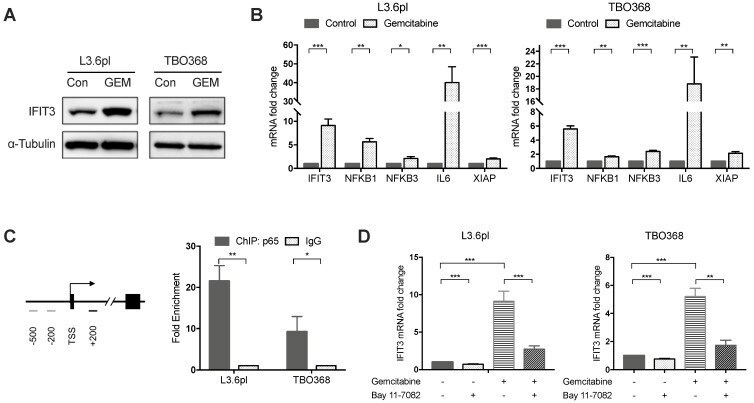
- Figure 2 IFIT3 interplays with NF-kappaB pathway during chemotherapy. (A) Western blot showed IFIT3 was up-regulated after gemcitabine treatment. Protein samples were collected from L3.6pl and TBO368 cells with or without gemcitabine treatment (3 ng/mL for L3.6pl and 400 ng/mL for TBO368) for indicated time. Membrane was stripped after IFIT3 detection and re-probed with alpha-Tubulin. (B) IFIT3 and NF-kB pathway was activated after gemcitabine treatment in L3.6pl and TBO368. NFKB1, NFKB3, IL6 and XIAP were selected as indicators for activation of NF-kappaB pathway. RNA samples were collected from L3.6pl and TBO368 cells with or without gemcitabine treatment for indicated time. (C) Three putative p65 binding sites on IFIT3 gene promoter are depicted. Chromatin immunoprecipitation indicates direct binding of p65 to the promoter region of IFIT3 (TSS +122 to +342, black bar). Chromatin was extracted from 1% PFA fixed L3.6pl and TBO368 cells pre-treated with gemcitabine and immunoprecipitated with anti-p65 antibody or normal IgG. (D) Expression of IFIT3 was diminished by NF-kappaB inhibitor Bay 11-7082 with or without gemcitabine treatment. Bay 11-7082, 10 uM. Data are presented as mean +- SEM of three independent experiments. * p < 0.05, ** p < 0.01, *** p < 0.001.
- Submitted by
- Invitrogen Antibodies (provider)
- Main image
- Experimental details
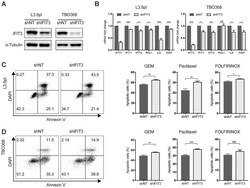
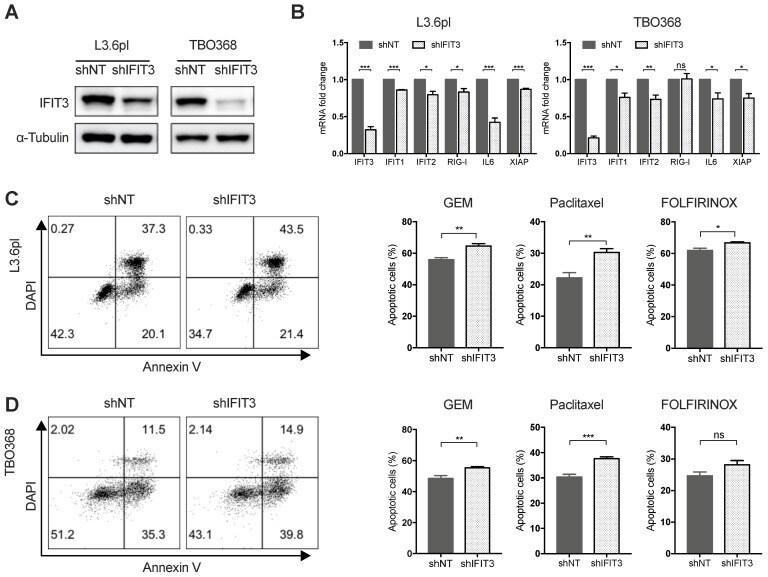
- Figure 3 IFIT3 renders chemotherapy resistance in PDAC cells. (A) IFIT3 knockdown was confirmed with western blot in both L3.6pl and TBO368 cells. Membrane was stripped after IFIT3 detection and re-probed with alpha-Tubulin. (B) IFN pathway and NF-kappaB pathway targeted genes, IFIT1, IFIT2, RIG-I, IL6, and XIAP were significantly down-regulated after knockdown of IFIT3. (C-D) Knockdown of IFIT3 increased sensitivity of L3.6pl (C) and TBO368 (D) to chemotherapy. Cells were treated with gemcitabine (3 ng/mL for L3.6pl and 400 ng/mL for TBO368), paclitaxel (10 nM) or FOLFIRINOX (Oxaliplatin: Irinotecan: Folinic acid Calcium: 5-Fluorouracil=1:2:4:25 uM as 1X, used as 0.025X for L3.6pl and 0.5X for TBO368) for indicated time. Apoptosis was determined by flow cytometry analysis of Annexin V/DAPI staining. Representative FACS dot plots are shown on the left. Bar graphs are presented as mean +- SEM of three independent experiments. * p < 0.05, ** p < 0.01, *** p < 0.001, ns: non-significant, p > 0.05.
- Submitted by
- Invitrogen Antibodies (provider)
- Main image
- Experimental details
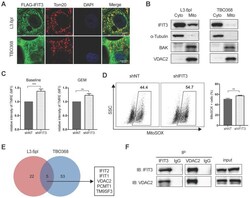
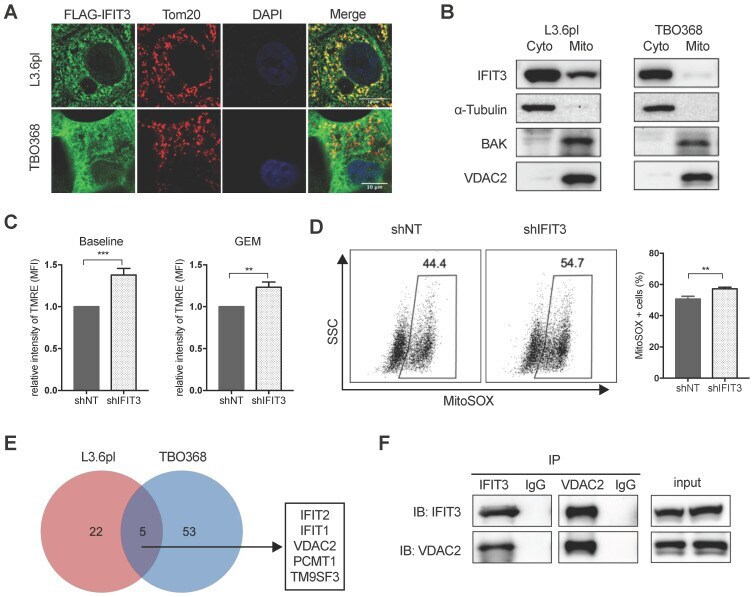
- Figure 4 IFIT3 regulates mitochondria-associated apoptosis. (A) Confocal immunofluorescence labeled with anti-FLAG ( green ), anti-Tom20 ( red ), and counterstained with DAPI ( blue ), showed co-localization of FLAG-tagged IFIT3 and Tom20 in mitochondria. L3.6pl and TBO368 cells stably express FLAG-tagged IFIT3 were used here. Scale was shown in the lower-right corner. (B) Western blot showed localization of IFIT3 in cytosol and mitochondria of L3.6pl and TBO368. Mitochondria were isolated as indicated in methods section. Cyto represent cytosol and Mito represent mitochondria. We probed alpha-Tubulin as cytosolic marker, BAK and VDAC2 as mitochondrial marker. (C) IFIT3 knockdown in L3.6pl altered mitochondrial membrane potential (DeltaPsim) with or without gemcitabine treatment. TMRE was used to determine the mitochondrial membrane potential (DeltaPsim). MFI: mean fluorescence intensity. (D) IFIT3 knockdown in L3.6pl showed more MitoSOX positive cells when treated with gemcitabine. Representative FACS dot plot and bar graph are shown. (E) Mass spectrometry results of immunoprecipitated samples by anti-IFIT3 antibody are shown in Venn diagram. Cells were treated with gemcitabine for indicated time before harvest. Proteins with p < 0.01 and log2 difference > 1 are considered significant. Proteins identified in the intersection of L3.6pl and TBO368 are listed beside the diagram. (F) Interaction between IFIT3 and VDAC2 was confirmed with western blot in L3.6pl. Data are presented
- Submitted by
- Invitrogen Antibodies (provider)
- Main image
- Experimental details
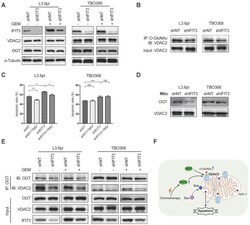
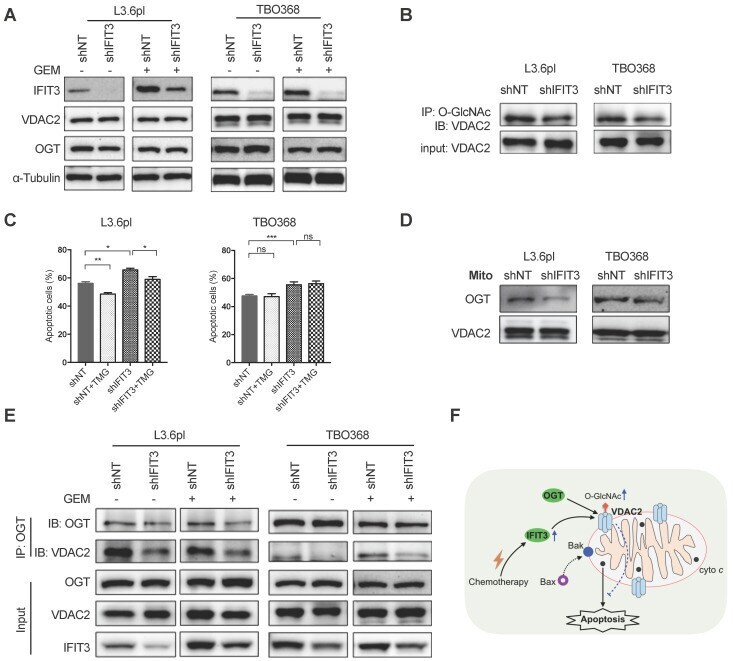
- Figure 6 IFIT3 modulates the O-GlcNAc level of VDAC2 through OGT. (A) IFIT3 knockdown did not alter the protein level of VDAC2 in both L3.6pl and TBO368. Membranes were probed with IFIT3, VDAC2 and OGT, then stripped and re-probed with alpha-Tubulin as loading control. (B) IFIT3 knockdown decreased the O-GlcNAc modification level of VDAC2. O-GlcNAc modified proteins were immunoprecipitated with anti-O-GlcNAc (RL2) antibody and blot was probed with anti-VDAC2 antibody. Input of VDAC2 was probed for loading control. (C) TMG reduced gemcitabine induced apoptosis in L3.6pl while show no difference in TBO368. Cells were treated as indicated for 48 h and 72 h, in L3.6pl and TBO368, respectively. TMG, 5 uM. Data are presented as mean +- SEM of three independent experiments. (D) OGT level in mitochondrial fraction was decreased in IFIT3 knockdown cells compared to non-target control cells. Mitochondria were isolated as indicated in methods section. VDAC2 was used as loading control. (E) Immunoprecipitation of OGT showed less binding of VDAC2 after knockdown of IFIT3 in both L3.6pl and TBO368, with or without gemcitabine treatment. (E) Schematic picture of IFIT3 regulating the O-GlcNAc modification of VDAC2 and protecting PDAC cells from chemotherapy induced apoptosis. * p < 0.05, ** p < 0.01, *** p < 0.001, ns: non-significant, p > 0.05.
- Submitted by
- Invitrogen Antibodies (provider)
- Main image
- Experimental details
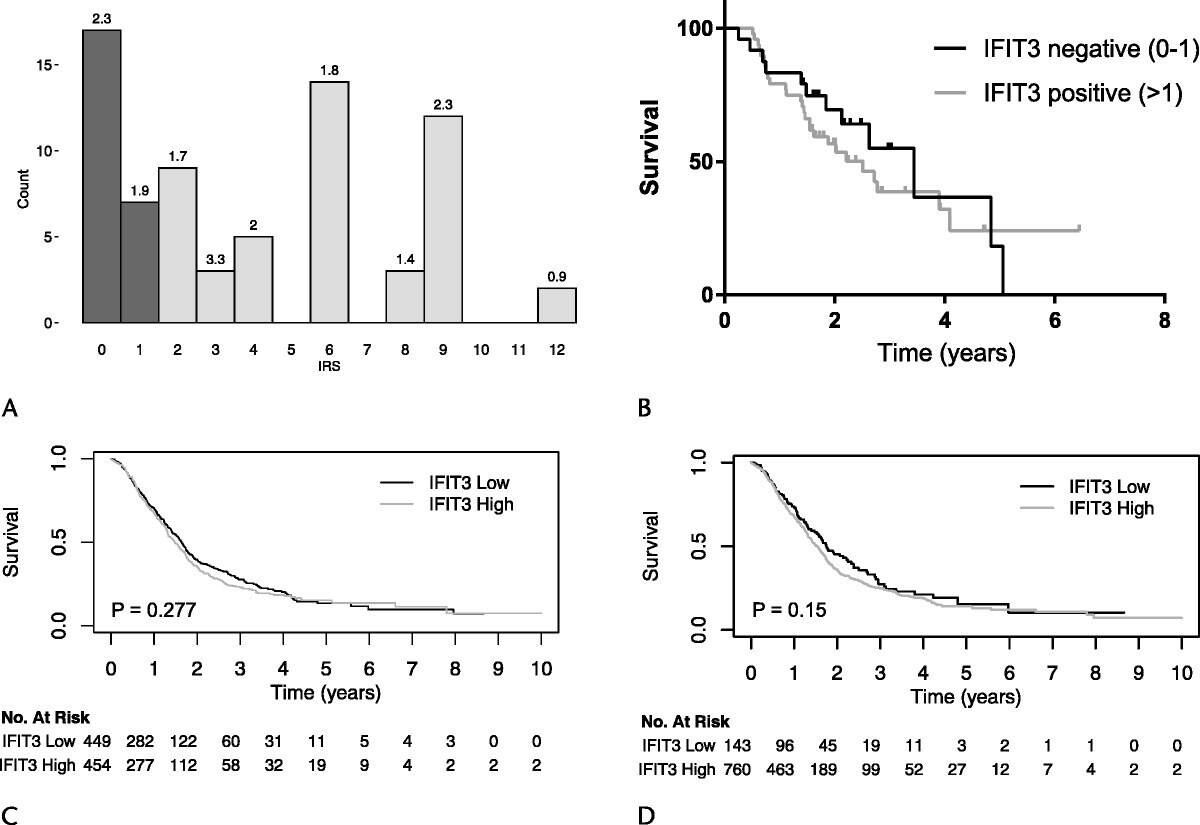
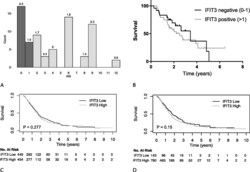
- FIGURE 2. Survival of primarily resected patients. Patients with IFIT3-negative tumors did not survive longer compared with patients with IFIT3-positive tumors. A, Histogram of the immunoreactive score (IRS) of the IFIT3 staining. The median survival of each IRS group is shown above the bars. B, Patients who are IFIT3-negative (score, 0-1) did not live significantly longer compared with IFIT3-positive (score, >1) patients (median survival, 3.4 vs 2.5 years; n = 72; P = 0.4702; log-rank test). C, Survival of patients from public databases with IFIT3-low-expressing (below the 50th percentile; median survival, 1.6 years) versus IFIT3-high-expressing (above the 50th percentile; median survival, 1.5 years) tumors. The overall survival is statistically equivalent (n = 903, P = 0.2775, log-rank test). D, Survival of patients from public databases with IFIT3-negative-expressing (below the 15.38th percentile; median survival, 1.8 years) versus IFIT3-positive-expressing (above the 15.38th percentile; median survival, 1.5 years) tumors. The overall survival is statistically equivalent (n = 903, P = 0.1504, log-rank test).