Explore
 Validate
 Learn
Learn Western blot
Antibody data
- Antibody Data
- Antigen structure
- References [3]
- Comments [0]
- Validations
- Western blot [3]
- Immunocytochemistry [2]
- Immunohistochemistry [4]
- Other assay [3]
Submit
Validation data
Reference
Comment
Report error
- Product number
- PA5-22081 - Provider product page

- Provider
- Invitrogen Antibodies
- Product name
- MCD Polyclonal Antibody
- Antibody type
- Polyclonal
- Antigen
- Recombinant full-length protein
- Description
- Recommended positive controls: 293T, A431, HeLa, HepG2, C8D30. Predicted reactivity: Mouse (95%), Rat (93%), Bovine (88%). Store product as a concentrated solution. Centrifuge briefly prior to opening the vial.
- Reactivity
- Human, Mouse
- Host
- Rabbit
- Isotype
- IgG
- Vial size
- 100 μL
- Concentration
- 1 mg/mL
- Storage
- Store at 4°C short term. For long term storage, store at -20°C, avoiding freeze/thaw cycles.
Submitted references Alcohol and Liver Clock Disruption Increase Small Droplet Macrosteatosis, Alter Lipid Metabolism and Clock Gene mRNA Rhythms, and Remodel the Triglyceride Lipidome in Mouse Liver.
Acute hypoxia influences collagen and matrix metalloproteinase expression by human keratoconus cells in vitro.
EphrinA1-Fc attenuates myocardial ischemia/reperfusion injury in mice.
Valcin JA, Udoh US, Swain TM, Andringa KK, Patel CR, Al Diffalha S, Baker PRS, Gamble KL, Bailey SM
Frontiers in physiology 2020;11:1048
Frontiers in physiology 2020;11:1048
Acute hypoxia influences collagen and matrix metalloproteinase expression by human keratoconus cells in vitro.
McKay TB, Hjortdal J, Priyadarsini S, Karamichos D
PloS one 2017;12(4):e0176017
PloS one 2017;12(4):e0176017
EphrinA1-Fc attenuates myocardial ischemia/reperfusion injury in mice.
DuSablon A, Parks J, Whitehurst K, Estes H, Chase R, Vlahos E, Sharma U, Wert D, Virag J
PloS one 2017;12(12):e0189307
PloS one 2017;12(12):e0189307
No comments: Submit comment
Supportive validation
- Submitted by
- Invitrogen Antibodies (provider)
- Main image
- Experimental details
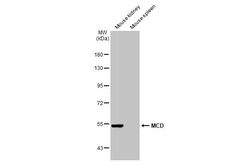
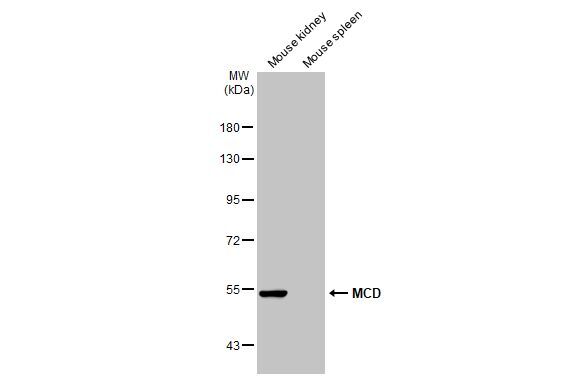
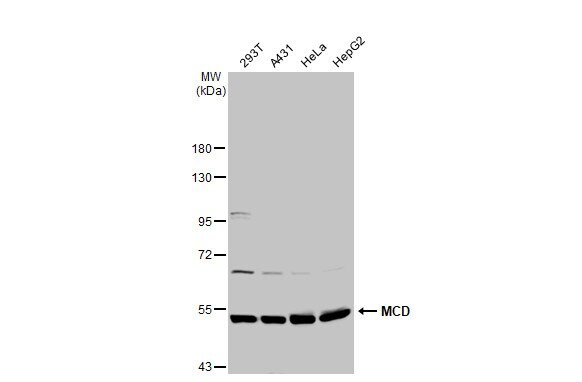
- Western Blot using MCD Polyclonal Antibody (Product # PA5-22081). Various tissue extracts (50 µg) were separated by 7.5% SDS-PAGE, and the membrane was blotted with MCD Polyclonal Antibody (Product # PA5-22081) diluted at 1:1,000. The HRP-conjugated anti-rabbit IgG antibody was used to detect the primary antibody.
- Submitted by
- Invitrogen Antibodies (provider)
- Main image
- Experimental details
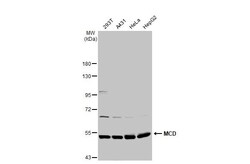
- Western Blot using MCD Polyclonal Antibody (Product # PA5-22081). Various whole cell extracts (30 µg) were separated by 7.5% SDS-PAGE, and the membrane was blotted with MCD Polyclonal Antibody (Product # PA5-22081) diluted at 1:500. The HRP-conjugated anti-rabbit IgG antibody was used to detect the primary antibody.
- Submitted by
- Invitrogen Antibodies (provider)
- Main image
- Experimental details
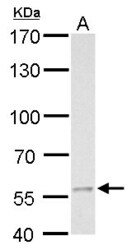
- MCD antibody detects MCD protein by western blot analysis. A. 30 µg C8D30 whole cell lysate/extract.7.5% SDS-PAGE. MCD antibody MCD Polyclonal Antibody (Product # PA5-22081) dilution: 1:500. The HRP-conjugated anti-rabbit IgG antibody was used to detect the primary antibody.

Supportive validation
- Submitted by
- Invitrogen Antibodies (provider)
- Main image
- Experimental details
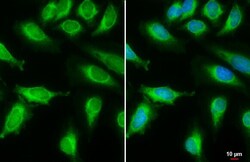
- Immunocytochemistry-Immunofluorescence analysis of MCD was performed in HeLa cells fixed in 4% paraformaldehyde at RT for 15 min. Green: MCD Polyclonal Antibody (Product # PA5-22081) diluted at 1:2000. Blue: Hoechst 33342 staining. Scale bar = 10 µm.

- Submitted by
- Invitrogen Antibodies (provider)
- Main image

- Experimental details
- Immunocytochemistry-Immunofluorescence analysis of MCD was performed in HeLa cells fixed in 4% paraformaldehyde at RT for 15 min. Green: MCD Polyclonal Antibody (Product # PA5-22081) diluted at 1:2000. Blue: Hoechst 33342 staining. Scale bar = 10 µm.

Supportive validation
- Submitted by
- Invitrogen Antibodies (provider)
- Main image
- Experimental details
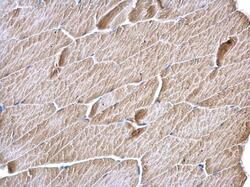
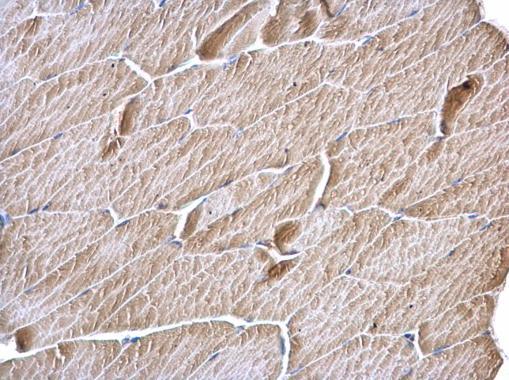
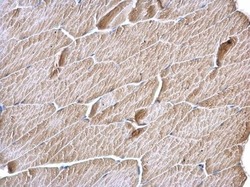
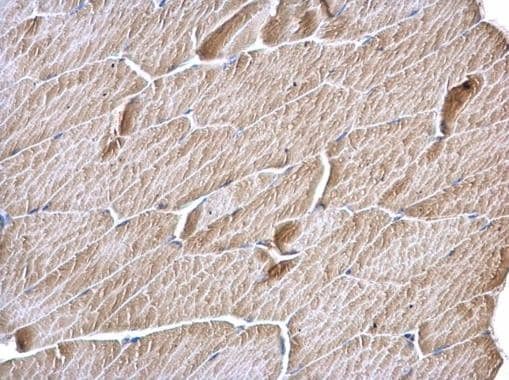
- MCD Polyclonal Antibody detects MCD protein at cytosol on mouse muscle by immunohistochemical analysis. Sample: Paraffin-embedded mouse muscle. MCD Polyclonal Antibody (Product # PA5-22081) dilution: 1:500. Antigen Retrieval: EDTA based buffer, pH 8.0, 15 min.
- Submitted by
- Invitrogen Antibodies (provider)
- Main image
- Experimental details
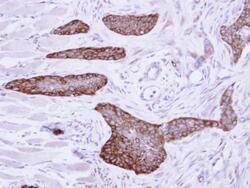
- Immunohistochemical analysis of paraffin-embedded H661 xenograft, using MCD (Product # PA5-22081) antibody at 1:500 dilution. Antigen Retrieval: EDTA based buffer, pH 8.0, 15 min.

- Submitted by
- Invitrogen Antibodies (provider)
- Main image
- Experimental details
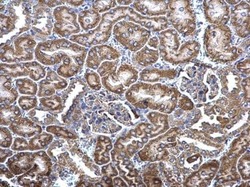
- MCD Polyclonal Antibody detects MCD protein at cytosol on mouse kidney by immunohistochemical analysis. Sample: Paraffin-embedded mouse kidney. MCD Polyclonal Antibody (Product # PA5-22081) dilution: 1:500. Antigen Retrieval: EDTA based buffer, pH 8.0, 15 min.

- Submitted by
- Invitrogen Antibodies (provider)
- Main image
- Experimental details
- MCD Polyclonal Antibody detects MCD protein at cytosol on mouse muscle by immunohistochemical analysis. Sample: Paraffin-embedded mouse muscle. MCD Polyclonal Antibody (Product # PA5-22081) dilution: 1:500. Antigen Retrieval: EDTA based buffer, pH 8.0, 15 min.
Supportive validation
- Submitted by
- Invitrogen Antibodies (provider)
- Main image
- Experimental details
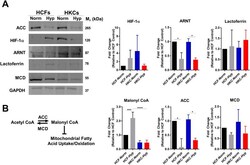
- Fig 1 Regulation of hypoxia-inducible proteins and malonyl CoA levels by hypoxia. (A) Protein expression of hypoxia-inducible proteins, including HIF-1alpha, aryl hydrocarbon receptor nuclear transport (ARNT), and lactoferrin. (B) Schematic depicting regulation of malonyl CoA levels by acetyl CoA carboxylase (ACC) and malonyl CoA decarboxylase (MCD). Protein expression of ACC and MCD measured by Western blot with quantification determined using densitometry with background subtraction. The contrast and brightness were altered to 46% and -20%, respectively, uniformly throughout the ARNT blot in order to enable increased distinction of the band from the background. The unmodified, uncropped western blots are provided in the supplemental material. Malonyl CoA levels in HCFs and HKCs were measured by ELISA. All data was normalized to HCF-Normoxic control. n>=3, error bars represent SEM. An ANOVA was used to determine statistical significance with *p

- Submitted by
- Invitrogen Antibodies (provider)
- Main image
- Experimental details
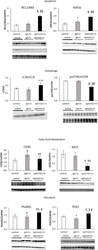
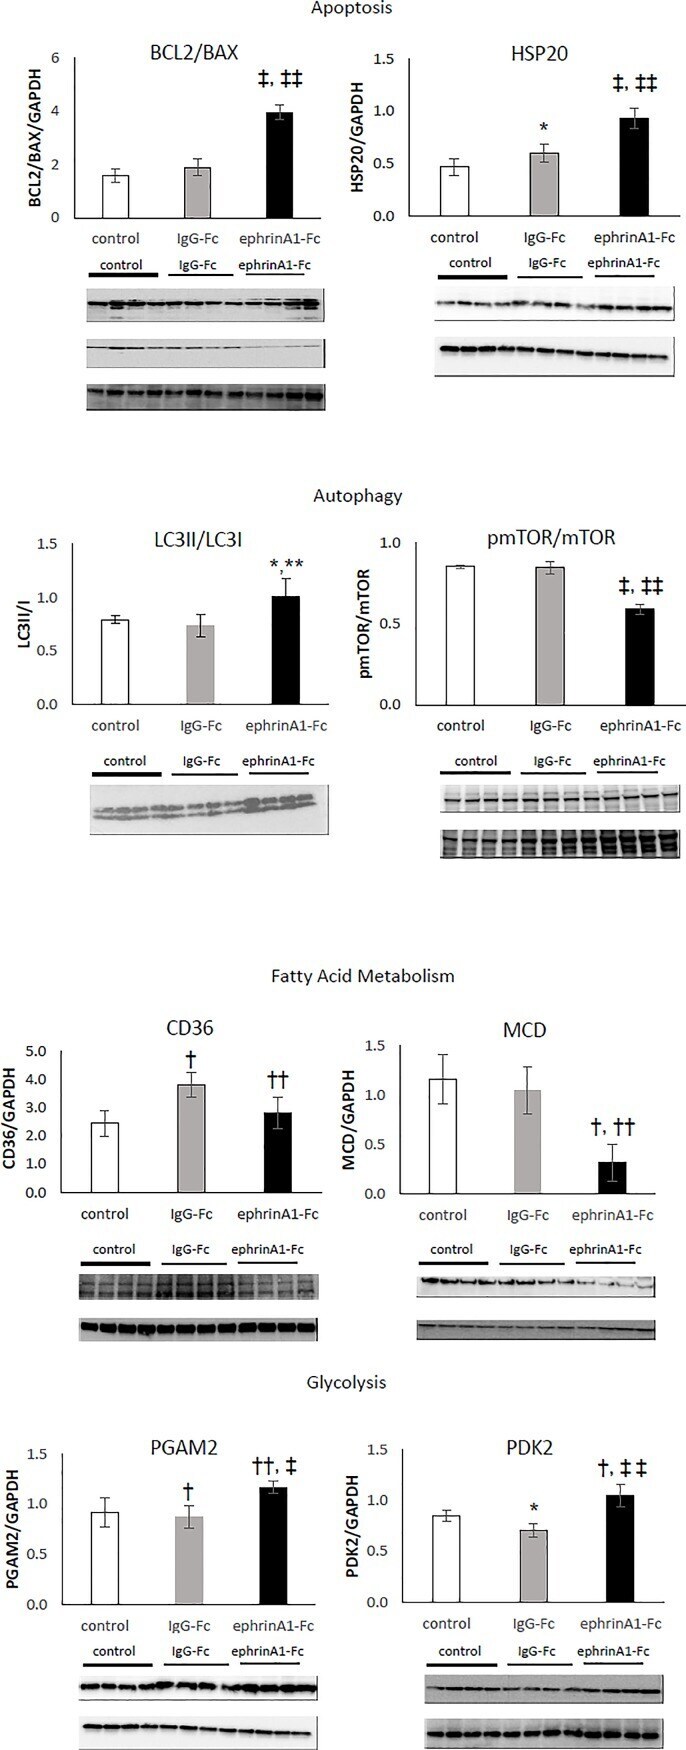
- Fig 5 Western blots of markers for apoptosis, autophagy, fatty acid metabolism, and glycolysis in left ventricular homogenates of control, IgG-Fc-treated, and ephrinA1-Fc-treated mouse hearts at 24hrs. (a)The ratio of bcl2/bax increased 2-fold and HSP20 increased by 35%, both of which are indicative of reduced apoptosis in ephrinA1-Fc treated mouse hearts compared to IgG-Fc. (b) The ratios of LC3II/LC3I increased 28% and pmTOR/mTOR decreased by 31%, indicating increased autophagy in ephrinA1-Fc relative to IgG-Fc-treated mouse hearts. (c) Decreased CD36 and MCD in ephrinA1-Fc-treated mice by 35% and 70% respectively compared to IgG-Fc treated mice is suggestive of reduced deleterious fatty acid accumulation and increased (d) PGAM2 and PDK2 by 26% and 33% respectively indicate altered glycolytic flux. *p
- Submitted by
- Invitrogen Antibodies (provider)
- Main image
- Experimental details
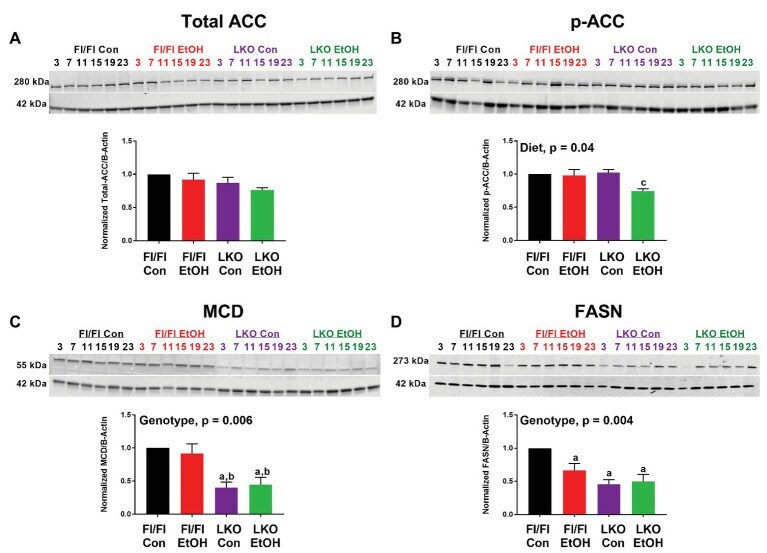
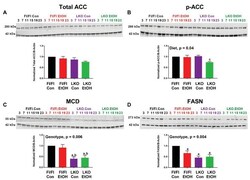
- Figure 6 Chronic alcohol and liver clock disruption alter abundance and phosphorylation state of select fatty acid metabolism proteins. Diurnal protein abundances of total acetyl CoA carboxylase (Total ACC; A ), phosphorylated acetyl CoA carboxylase (p-ACC; B ), malonyl-CoA decarboxylase (MCD; C ), and fatty acid synthase (FASN; D ) were determined by western blotting using liver homogenates of control-fed (black) and alcohol-fed (red) Bmal1 Flox/Flox (Fl/Fl) and control-fed (purple) and alcohol-fed (green) Bmal1 liver-specific knockout (LKO) mice from ZT 3, 7, 11, 15, 19, and 23 (ZT 0: lights on/inactive period, ZT 12: lights off/active period). Protein abundances were detected using the LI-COR Odyssey (r) digital imaging system. A representative image is presented for each protein of interest showing a full time course. The bar graphs indicate the average protein abundance calculated over the 24 h day normalized to beta-actin, and levels are displayed as a fold-change from the control-fed Fl/Fl group. Data are shown as mean +- SEM n = 3-4 mice/genotype/diet. Significant two-factor ANOVA results are included in graphs. Letters indicate statistically significant differences ( p < 0.05) for comparisons to control-fed Fl/Fl mice (a), alcohol-fed Fl/Fl mice (b), and control-fed LKO mice (c).