 Explore
 Validate
 Learn
Learn Flow cytometry
Antibody data
- Antibody Data
- Antigen structure
- References [42]
- Comments [0]
- Validations
- Flow cytometry [1]
- Other assay [29]
Submit
Validation data
Reference
Comment
Report error
- Product number
- 12-9987-80 - Provider product page

- Provider
- Invitrogen Antibodies
- Product name
- CD235a (Glycophorin A) Monoclonal Antibody (HIR2 (GA-R2)), PE, eBioscience™
- Antibody type
- Monoclonal
- Antigen
- Other
- Description
- Description: The HIR2 monoclonal antibody reacts with human glycophorin A, sialoglycoproteins expressed by erythroid precursors and mature circulating red cells. Applications Reported: The HIR2 (also GA-R2) antibody has been reported for use in flow cytometric analysis. Applications Tested: The HIR2 (also GA-R2) antibody has been tested by flow cytometric analysis of normal human peripheral blood cells. This can be used at less than or equal to 0.015 µg per test. A test is defined as the amount (µg) of antibody that will stain a cell sample in a final volume of 100 µL. Cell number should be determined empirically but can range from 10^5 to 10^8 cells/test. It is recommended that the antibody be carefully titrated for optimal performance in the assay of interest. Excitation: 488-561 nm; Emission: 578 nm; Laser: Blue Laser, Green Laser, Yellow-Green Laser. Filtration: 0.2 µm post-manufacturing filtered.
- Reactivity
- Human
- Host
- Mouse
- Conjugate
- Yellow dye
- Isotype
- IgG
- Antibody clone number
- HIR2 (GA-R2)
- Vial size
- 25 µg
- Concentration
- 0.2 mg/mL
- Storage
- 4° C, store in dark, DO NOT FREEZE!
Submitted references Human serum albumin promotes self-renewal and expansion of umbilical cord blood CD34(+) hematopoietic stem/progenitor cells.
Autophagy regulated by the HIF/REDD1/mTORC1 signaling is progressively increased during erythroid differentiation under hypoxia.
Polycomb Factor PHF19 Controls Cell Growth and Differentiation Toward Erythroid Pathway in Chronic Myeloid Leukemia Cells.
Extracellular vesicles are associated with C-reactive protein in sepsis.
In vitro differentiation of human embryonic stem cells to hemogenic endothelium and blood progenitors via embryoid body formation.
Iron control of erythroid microtubule cytoskeleton as a potential target in treatment of iron-restricted anemia.
Negative Regulation of Erythroid Differentiation via the CBX8-TRIM28 Axis.
The immunoregulatory function of peripheral blood CD71(+) erythroid cells in systemic-onset juvenile idiopathic arthritis.
The TRACE-Seq method tracks recombination alleles and identifies clonal reconstitution dynamics of gene targeted human hematopoietic stem cells.
Heterogeneous disease-propagating stem cells in juvenile myelomonocytic leukemia.
A Human Skeletal Muscle Atlas Identifies the Trajectories of Stem and Progenitor Cells across Development and from Human Pluripotent Stem Cells.
Microglia promote glioblastoma via mTOR-mediated immunosuppression of the tumour microenvironment.
Proteosomal degradation of NSD2 by BRCA1 promotes leukemia cell differentiation.
Arsenic sulfide nanoformulation induces erythroid differentiation in chronic myeloid leukemia cells through degradation of BCR-ABL.
Rats provide a superior model of human stress erythropoiesis.
Gene-centric functional dissection of human genetic variation uncovers regulators of hematopoiesis.
Transcriptional States and Chromatin Accessibility Underlying Human Erythropoiesis.
Genetic programming of macrophages generates an in vitro model for the human erythroid island niche.
GATA/Heme Multi-omics Reveals a Trace Metal-Dependent Cellular Differentiation Mechanism.
P38α/JNK signaling restrains erythropoiesis by suppressing Ezh2-mediated epigenetic silencing of Bim.
Knockdown of HSPA9 induces TP53-dependent apoptosis in human hematopoietic progenitor cells.
Dimethyl fumarate increases fetal hemoglobin, provides heme detoxification, and corrects anemia in sickle cell disease.
Variant-aware saturating mutagenesis using multiple Cas9 nucleases identifies regulatory elements at trait-associated loci.
Activation of KLF1 Enhances the Differentiation and Maturation of Red Blood Cells from Human Pluripotent Stem Cells.
Platelets confound the measurement of extracellular miRNA in archived plasma.
Definitive Hematopoietic Multipotent Progenitor Cells Are Transiently Generated From Hemogenic Endothelial Cells in Human Pluripotent Stem Cells.
Antithymocyte Globulin at Clinically Relevant Concentrations Kills Leukemic Blasts.
ASXL1 plays an important role in erythropoiesis.
Genetic Variability Overrides the Impact of Parental Cell Type and Determines iPSC Differentiation Potential.
PDL1 Expression on Plasma and Dendritic Cells in Myeloma Bone Marrow Suggests Benefit of Targeted anti PD1-PDL1 Therapy.
BCL11A enhancer dissection by Cas9-mediated in situ saturating mutagenesis.
PPAR-α and glucocorticoid receptor synergize to promote erythroid progenitor self-renewal.
Circulating microparticles carry oxidation-specific epitopes and are recognized by natural IgM antibodies.
Altered translation of GATA1 in Diamond-Blackfan anemia.
PML4 facilitates erythroid differentiation by enhancing the transcriptional activity of GATA-1.
EDAG positively regulates erythroid differentiation and modifies GATA1 acetylation through recruiting p300.
Erythropoiesis suppression is associated with anthrax lethal toxin-mediated pathogenic progression.
A feedback loop consisting of microRNA 23a/27a and the β-like globin suppressors KLF3 and SP1 regulates globin gene expression.
Terminal differentiation and loss of tumorigenicity of human cancers via pluripotency-based reprogramming.
α-1,6-Fucosyltransferase (FUT8) inhibits hemoglobin production during differentiation of murine and K562 human erythroleukemia cells.
Role of ZBP-89 in human globin gene regulation and erythroid differentiation.
Differential IL-7 responses in developing human thymocytes.
Hua J, Jiao T, Qiao Y, Zhang S, Xiao T, Zhang Y, Yan J
Annals of translational medicine 2023 Jan 31;11(2):62
Annals of translational medicine 2023 Jan 31;11(2):62
Autophagy regulated by the HIF/REDD1/mTORC1 signaling is progressively increased during erythroid differentiation under hypoxia.
Li J, Quan C, He YL, Cao Y, Chen Y, Wang YF, Wu LY
Frontiers in cell and developmental biology 2022;10:896893
Frontiers in cell and developmental biology 2022;10:896893
Polycomb Factor PHF19 Controls Cell Growth and Differentiation Toward Erythroid Pathway in Chronic Myeloid Leukemia Cells.
García-Montolio M, Ballaré C, Blanco E, Gutiérrez A, Aranda S, Gómez A, Kok CH, Yeung DT, Hughes TP, Vizán P, Di Croce L
Frontiers in cell and developmental biology 2021;9:655201
Frontiers in cell and developmental biology 2021;9:655201
Extracellular vesicles are associated with C-reactive protein in sepsis.
Fendl B, Weiss R, Eichhorn T, Linsberger I, Afonyushkin T, Puhm F, Binder CJ, Fischer MB, Weber V
Scientific reports 2021 Mar 26;11(1):6996
Scientific reports 2021 Mar 26;11(1):6996
In vitro differentiation of human embryonic stem cells to hemogenic endothelium and blood progenitors via embryoid body formation.
Garcia-Alegria E, Potts B, Menegatti S, Kouskoff V
STAR protocols 2021 Mar 19;2(1):100367
STAR protocols 2021 Mar 19;2(1):100367
Iron control of erythroid microtubule cytoskeleton as a potential target in treatment of iron-restricted anemia.
Goldfarb AN, Freeman KC, Sahu RK, Elagib KE, Holy M, Arneja A, Polanowska-Grabowska R, Gru AA, White Z 3rd, Khalil S, Kerins MJ, Ooi A, Leitinger N, Luckey CJ, Delehanty LL
Nature communications 2021 Mar 12;12(1):1645
Nature communications 2021 Mar 12;12(1):1645
Negative Regulation of Erythroid Differentiation via the CBX8-TRIM28 Axis.
Kim HJ, Park JW, Kang JY, Seo SB
Molecules and cells 2021 Jul 31;44(7):444-457
Molecules and cells 2021 Jul 31;44(7):444-457
The immunoregulatory function of peripheral blood CD71(+) erythroid cells in systemic-onset juvenile idiopathic arthritis.
Kanemasa H, Ishimura M, Eguchi K, Tanaka T, Nanishi E, Shiraishi A, Goto M, Motomura Y, Ohga S
Scientific reports 2021 Jul 13;11(1):14396
Scientific reports 2021 Jul 13;11(1):14396
The TRACE-Seq method tracks recombination alleles and identifies clonal reconstitution dynamics of gene targeted human hematopoietic stem cells.
Sharma R, Dever DP, Lee CM, Azizi A, Pan Y, Camarena J, Köhnke T, Bao G, Porteus MH, Majeti R
Nature communications 2021 Jan 20;12(1):472
Nature communications 2021 Jan 20;12(1):472
Heterogeneous disease-propagating stem cells in juvenile myelomonocytic leukemia.
Louka E, Povinelli B, Rodriguez-Meira A, Buck G, Wen WX, Wang G, Sousos N, Ashley N, Hamblin A, Booth CAG, Roy A, Elliott N, Iskander D, de la Fuente J, Fordham N, O'Byrne S, Inglott S, Norfo R, Salio M, Thongjuea S, Rao A, Roberts I, Mead AJ
The Journal of experimental medicine 2021 Feb 1;218(2)
The Journal of experimental medicine 2021 Feb 1;218(2)
A Human Skeletal Muscle Atlas Identifies the Trajectories of Stem and Progenitor Cells across Development and from Human Pluripotent Stem Cells.
Xi H, Langerman J, Sabri S, Chien P, Young CS, Younesi S, Hicks M, Gonzalez K, Fujiwara W, Marzi J, Liebscher S, Spencer M, Van Handel B, Evseenko D, Schenke-Layland K, Plath K, Pyle AD
Cell stem cell 2020 Jul 2;27(1):158-176.e10
Cell stem cell 2020 Jul 2;27(1):158-176.e10
Microglia promote glioblastoma via mTOR-mediated immunosuppression of the tumour microenvironment.
Dumas AA, Pomella N, Rosser G, Guglielmi L, Vinel C, Millner TO, Rees J, Aley N, Sheer D, Wei J, Marisetty A, Heimberger AB, Bowman RL, Brandner S, Joyce JA, Marino S
The EMBO journal 2020 Aug 3;39(15):e103790
The EMBO journal 2020 Aug 3;39(15):e103790
Proteosomal degradation of NSD2 by BRCA1 promotes leukemia cell differentiation.
Park JW, Kang JY, Hahm JY, Kim HJ, Seo SB
Communications biology 2020 Aug 21;3(1):462
Communications biology 2020 Aug 21;3(1):462
Arsenic sulfide nanoformulation induces erythroid differentiation in chronic myeloid leukemia cells through degradation of BCR-ABL.
Wang T, Wen T, Li H, Han B, Hao S, Wang C, Ma Q, Meng J, Liu J, Xu H
International journal of nanomedicine 2019;14:5581-5594
International journal of nanomedicine 2019;14:5581-5594
Rats provide a superior model of human stress erythropoiesis.
Zhang J, Liu Y, Han X, Mei Y, Yang J, Zhang ZJ, Lu X, Ji P
Experimental hematology 2019 Oct;78:21-34.e3
Experimental hematology 2019 Oct;78:21-34.e3
Gene-centric functional dissection of human genetic variation uncovers regulators of hematopoiesis.
Nandakumar SK, McFarland SK, Mateyka LM, Lareau CA, Ulirsch JC, Ludwig LS, Agarwal G, Engreitz JM, Przychodzen B, McConkey M, Cowley GS, Doench JG, Maciejewski JP, Ebert BL, Root DE, Sankaran VG
eLife 2019 May 9;8
eLife 2019 May 9;8
Transcriptional States and Chromatin Accessibility Underlying Human Erythropoiesis.
Ludwig LS, Lareau CA, Bao EL, Nandakumar SK, Muus C, Ulirsch JC, Chowdhary K, Buenrostro JD, Mohandas N, An X, Aryee MJ, Regev A, Sankaran VG
Cell reports 2019 Jun 11;27(11):3228-3240.e7
Cell reports 2019 Jun 11;27(11):3228-3240.e7
Genetic programming of macrophages generates an in vitro model for the human erythroid island niche.
Lopez-Yrigoyen M, Yang CT, Fidanza A, Cassetta L, Taylor AH, McCahill A, Sellink E, von Lindern M, van den Akker E, Mountford JC, Pollard JW, Forrester LM
Nature communications 2019 Feb 20;10(1):881
Nature communications 2019 Feb 20;10(1):881
GATA/Heme Multi-omics Reveals a Trace Metal-Dependent Cellular Differentiation Mechanism.
Tanimura N, Liao R, Wilson GM, Dent MR, Cao M, Burstyn JN, Hematti P, Liu X, Zhang Y, Zheng Y, Keles S, Xu J, Coon JJ, Bresnick EH
Developmental cell 2018 Sep 10;46(5):581-594.e4
Developmental cell 2018 Sep 10;46(5):581-594.e4
P38α/JNK signaling restrains erythropoiesis by suppressing Ezh2-mediated epigenetic silencing of Bim.
Hu P, Nebreda AR, Hanenberg H, Kinnebrew GH, Ivan M, Yoder MC, Filippi MD, Broxmeyer HE, Kapur R
Nature communications 2018 Aug 29;9(1):3518
Nature communications 2018 Aug 29;9(1):3518
Knockdown of HSPA9 induces TP53-dependent apoptosis in human hematopoietic progenitor cells.
Liu T, Krysiak K, Shirai CL, Kim S, Shao J, Ndonwi M, Walter MJ
PloS one 2017;12(2):e0170470
PloS one 2017;12(2):e0170470
Dimethyl fumarate increases fetal hemoglobin, provides heme detoxification, and corrects anemia in sickle cell disease.
Krishnamoorthy S, Pace B, Gupta D, Sturtevant S, Li B, Makala L, Brittain J, Moore N, Vieira BF, Thullen T, Stone I, Li H, Hobbs WE, Light DR
JCI insight 2017 Oct 19;2(20)
JCI insight 2017 Oct 19;2(20)
Variant-aware saturating mutagenesis using multiple Cas9 nucleases identifies regulatory elements at trait-associated loci.
Canver MC, Lessard S, Pinello L, Wu Y, Ilboudo Y, Stern EN, Needleman AJ, Galactéros F, Brugnara C, Kutlar A, McKenzie C, Reid M, Chen DD, Das PP, A Cole M, Zeng J, Kurita R, Nakamura Y, Yuan GC, Lettre G, Bauer DE, Orkin SH
Nature genetics 2017 Apr;49(4):625-634
Nature genetics 2017 Apr;49(4):625-634
Activation of KLF1 Enhances the Differentiation and Maturation of Red Blood Cells from Human Pluripotent Stem Cells.
Yang CT, Ma R, Axton RA, Jackson M, Taylor AH, Fidanza A, Marenah L, Frayne J, Mountford JC, Forrester LM
Stem cells (Dayton, Ohio) 2017 Apr;35(4):886-897
Stem cells (Dayton, Ohio) 2017 Apr;35(4):886-897
Platelets confound the measurement of extracellular miRNA in archived plasma.
Mitchell AJ, Gray WD, Hayek SS, Ko YA, Thomas S, Rooney K, Awad M, Roback JD, Quyyumi A, Searles CD
Scientific reports 2016 Sep 13;6:32651
Scientific reports 2016 Sep 13;6:32651
Definitive Hematopoietic Multipotent Progenitor Cells Are Transiently Generated From Hemogenic Endothelial Cells in Human Pluripotent Stem Cells.
Bai H, Liu Y, Xie Y, Hoyle DL, Brodsky RA, Cheng L, Cheng T, Wang ZZ
Journal of cellular physiology 2016 May;231(5):1065-76
Journal of cellular physiology 2016 May;231(5):1065-76
Antithymocyte Globulin at Clinically Relevant Concentrations Kills Leukemic Blasts.
Dabas R, Lee R, Servito MT, Dharmani-Khan P, Modi M, van Slyke T, Luider J, Durand C, Larratt L, Brandwein J, Morris D, Daly A, Khan FM, Storek J
Biology of blood and marrow transplantation : journal of the American Society for Blood and Marrow Transplantation 2016 May;22(5):815-24
Biology of blood and marrow transplantation : journal of the American Society for Blood and Marrow Transplantation 2016 May;22(5):815-24
ASXL1 plays an important role in erythropoiesis.
Shi H, Yamamoto S, Sheng M, Bai J, Zhang P, Chen R, Chen S, Shi L, Abdel-Wahab O, Xu M, Zhou Y, Yang FC
Scientific reports 2016 Jun 29;6:28789
Scientific reports 2016 Jun 29;6:28789
Genetic Variability Overrides the Impact of Parental Cell Type and Determines iPSC Differentiation Potential.
Kyttälä A, Moraghebi R, Valensisi C, Kettunen J, Andrus C, Pasumarthy KK, Nakanishi M, Nishimura K, Ohtaka M, Weltner J, Van Handel B, Parkkonen O, Sinisalo J, Jalanko A, Hawkins RD, Woods NB, Otonkoski T, Trokovic R
Stem cell reports 2016 Feb 9;6(2):200-12
Stem cell reports 2016 Feb 9;6(2):200-12
PDL1 Expression on Plasma and Dendritic Cells in Myeloma Bone Marrow Suggests Benefit of Targeted anti PD1-PDL1 Therapy.
Sponaas AM, Moharrami NN, Feyzi E, Standal T, Holth Rustad E, Waage A, Sundan A
PloS one 2015;10(10):e0139867
PloS one 2015;10(10):e0139867
BCL11A enhancer dissection by Cas9-mediated in situ saturating mutagenesis.
Canver MC, Smith EC, Sher F, Pinello L, Sanjana NE, Shalem O, Chen DD, Schupp PG, Vinjamur DS, Garcia SP, Luc S, Kurita R, Nakamura Y, Fujiwara Y, Maeda T, Yuan GC, Zhang F, Orkin SH, Bauer DE
Nature 2015 Nov 12;527(7577):192-7
Nature 2015 Nov 12;527(7577):192-7
PPAR-α and glucocorticoid receptor synergize to promote erythroid progenitor self-renewal.
Lee HY, Gao X, Barrasa MI, Li H, Elmes RR, Peters LL, Lodish HF
Nature 2015 Jun 25;522(7557):474-7
Nature 2015 Jun 25;522(7557):474-7
Circulating microparticles carry oxidation-specific epitopes and are recognized by natural IgM antibodies.
Tsiantoulas D, Perkmann T, Afonyushkin T, Mangold A, Prohaska TA, Papac-Milicevic N, Millischer V, Bartel C, Hörkkö S, Boulanger CM, Tsimikas S, Fischer MB, Witztum JL, Lang IM, Binder CJ
Journal of lipid research 2015 Feb;56(2):440-8
Journal of lipid research 2015 Feb;56(2):440-8
Altered translation of GATA1 in Diamond-Blackfan anemia.
Ludwig LS, Gazda HT, Eng JC, Eichhorn SW, Thiru P, Ghazvinian R, George TI, Gotlib JR, Beggs AH, Sieff CA, Lodish HF, Lander ES, Sankaran VG
Nature medicine 2014 Jul;20(7):748-53
Nature medicine 2014 Jul;20(7):748-53
PML4 facilitates erythroid differentiation by enhancing the transcriptional activity of GATA-1.
Wu J, Zhou LQ, Yu W, Zhao ZG, Xie XM, Wang WT, Xiong J, Li M, Xue Z, Wang X, Zhang P, Mao BB, Hao DL, Lv X, Liu DP
Blood 2014 Jan 9;123(2):261-70
Blood 2014 Jan 9;123(2):261-70
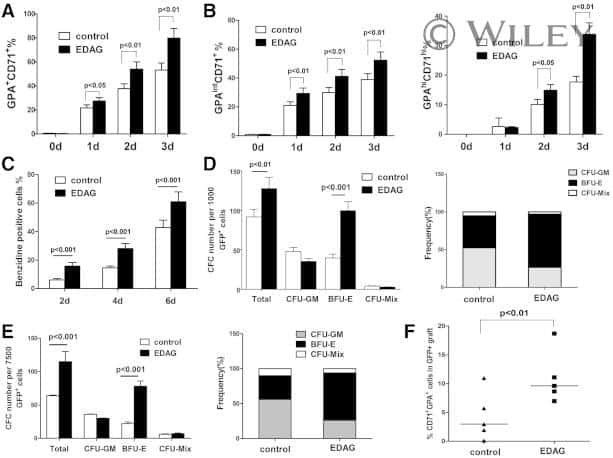
EDAG positively regulates erythroid differentiation and modifies GATA1 acetylation through recruiting p300.
Zheng WW, Dong XM, Yin RH, Xu FF, Ning HM, Zhang MJ, Xu CW, Yang Y, Ding YL, Wang ZD, Zhao WB, Tang LJ, Chen H, Wang XH, Zhan YQ, Yu M, Ge CH, Li CY, Yang XM
Stem cells (Dayton, Ohio) 2014 Aug;32(8):2278-89
Stem cells (Dayton, Ohio) 2014 Aug;32(8):2278-89
Erythropoiesis suppression is associated with anthrax lethal toxin-mediated pathogenic progression.
Chang HH, Wang TP, Chen PK, Lin YY, Liao CH, Lin TK, Chiang YW, Lin WB, Chiang CY, Kau JH, Huang HH, Hsu HL, Liao CY, Sun DS
PloS one 2013;8(8):e71718
PloS one 2013;8(8):e71718
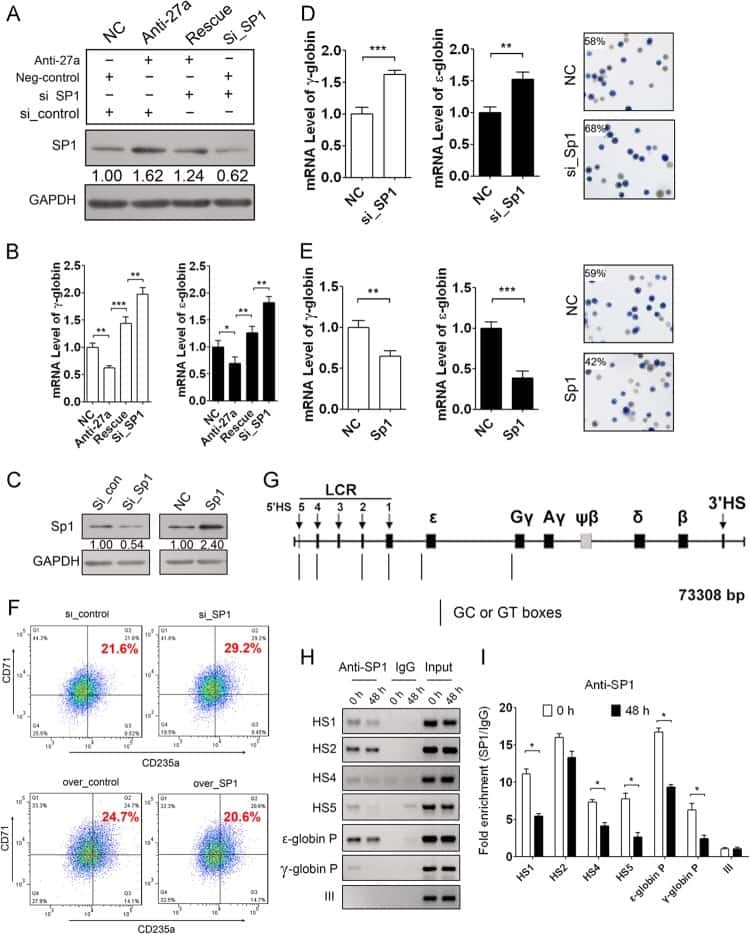
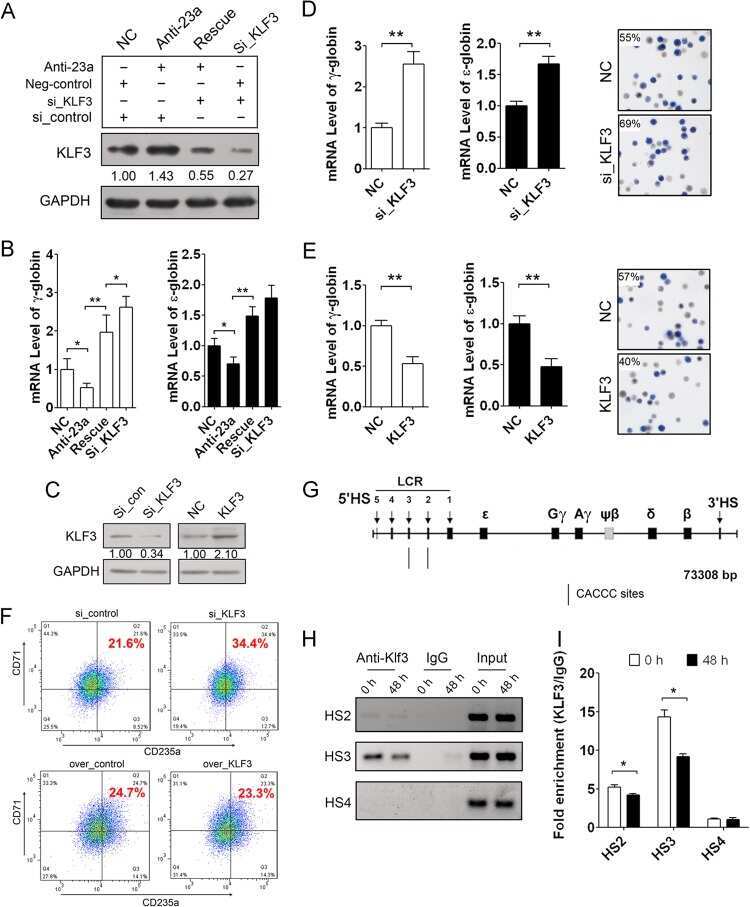
A feedback loop consisting of microRNA 23a/27a and the β-like globin suppressors KLF3 and SP1 regulates globin gene expression.
Ma Y, Wang B, Jiang F, Wang D, Liu H, Yan Y, Dong H, Wang F, Gong B, Zhu Y, Dong L, Yin H, Zhang Z, Zhao H, Wu Z, Zhang J, Zhou J, Yu J
Molecular and cellular biology 2013 Oct;33(20):3994-4007
Molecular and cellular biology 2013 Oct;33(20):3994-4007
Terminal differentiation and loss of tumorigenicity of human cancers via pluripotency-based reprogramming.
Zhang X, Cruz FD, Terry M, Remotti F, Matushansky I
Oncogene 2013 May 2;32(18):2249-60, 2260.e1-21
Oncogene 2013 May 2;32(18):2249-60, 2260.e1-21
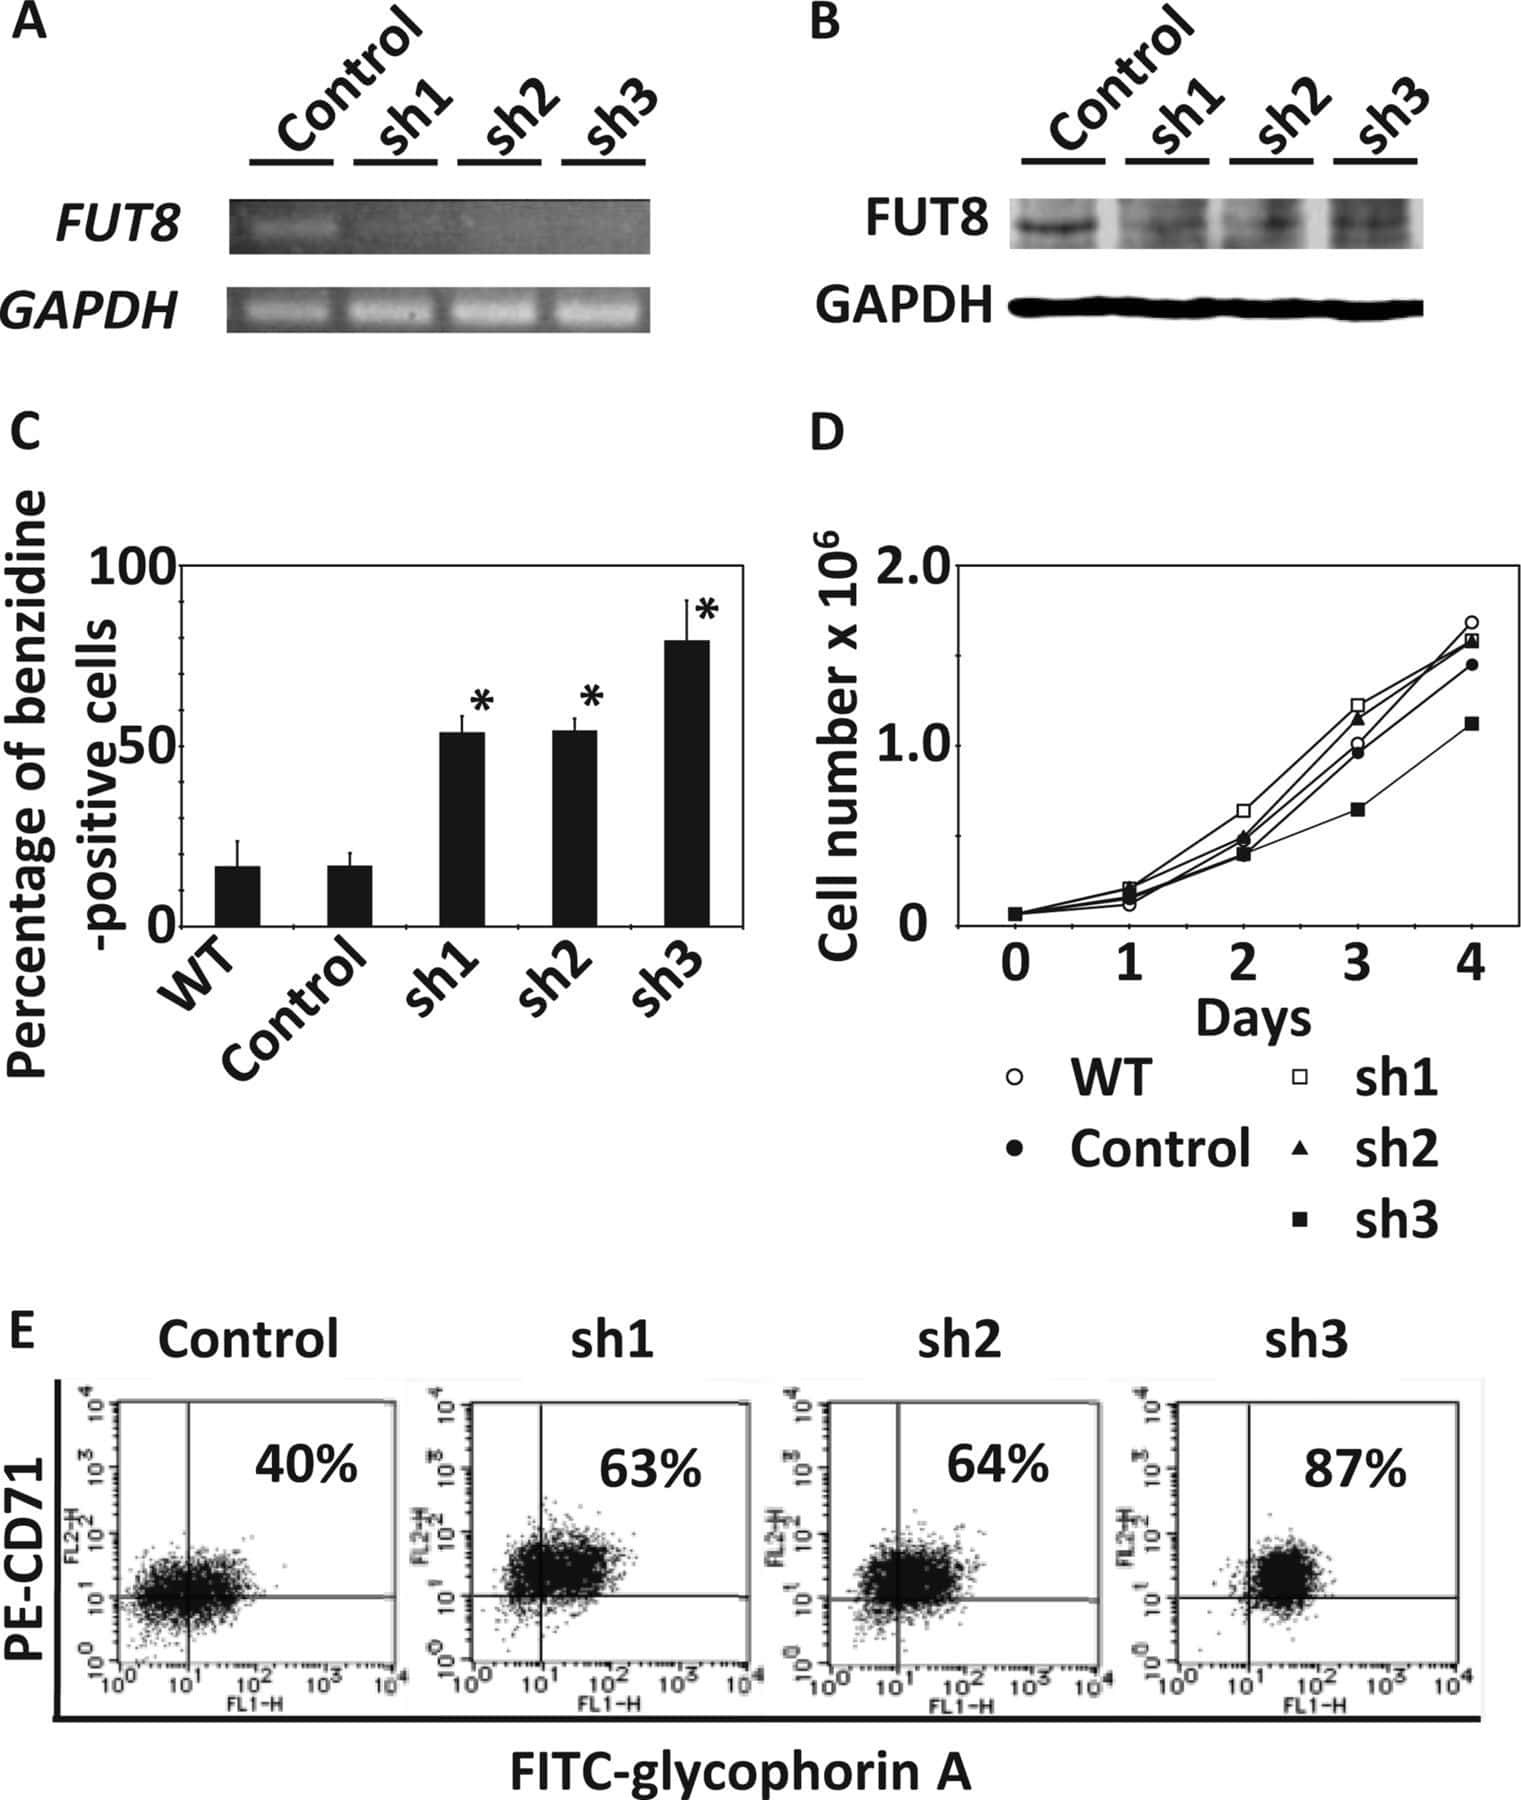
α-1,6-Fucosyltransferase (FUT8) inhibits hemoglobin production during differentiation of murine and K562 human erythroleukemia cells.
Sasaki H, Toda T, Furukawa T, Mawatari Y, Takaesu R, Shimizu M, Wada R, Kato D, Utsugi T, Ohtsu M, Murakami Y
The Journal of biological chemistry 2013 Jun 7;288(23):16839-16847
The Journal of biological chemistry 2013 Jun 7;288(23):16839-16847
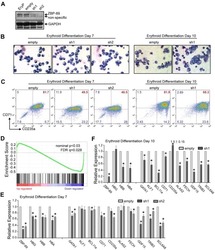
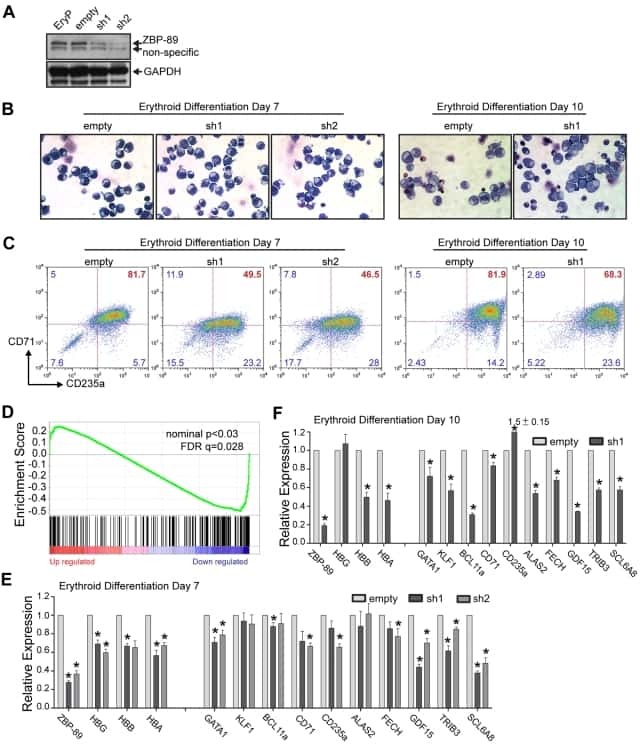
Role of ZBP-89 in human globin gene regulation and erythroid differentiation.
Woo AJ, Kim J, Xu J, Huang H, Cantor AB
Blood 2011 Sep 29;118(13):3684-93
Blood 2011 Sep 29;118(13):3684-93
Differential IL-7 responses in developing human thymocytes.
Marino JH, Tan C, Taylor AA, Bentley C, Van De Wiele CJ, Ranne R, Paliotta M, Broughan TA, Teague TK
Human immunology 2010 Apr;71(4):329-33
Human immunology 2010 Apr;71(4):329-33
No comments: Submit comment
Supportive validation
- Submitted by
- Invitrogen Antibodies (provider)
- Main image
- Experimental details
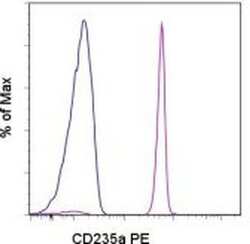
- Staining of normal human peripheral blood cells with Mouse IgG2b kappa Isotype Control PE (Product # 12-4732-81) (blue histogram) or Anti-Human CD235a (Glycophorin A) PE (purple histogram). Non-leukocytes were used for analysis.
- Conjugate
- Yellow dye

Supportive validation
- Submitted by
- Invitrogen Antibodies (provider)
- Main image

- Experimental details
- NULL
- Conjugate
- Yellow dye
- Submitted by
- Invitrogen Antibodies (provider)
- Main image
- Experimental details
- NULL
- Conjugate
- Yellow dye
- Submitted by
- Invitrogen Antibodies (provider)
- Main image
- Experimental details
- NULL
- Conjugate
- Yellow dye
- Submitted by
- Invitrogen Antibodies (provider)
- Main image

- Experimental details
- NULL
- Conjugate
- Yellow dye
- Submitted by
- Invitrogen Antibodies (provider)
- Main image
- Experimental details
- NULL
- Conjugate
- Yellow dye
- Submitted by
- Invitrogen Antibodies (provider)
- Main image
- Experimental details
- NULL
- Conjugate
- Yellow dye

- Submitted by
- Invitrogen Antibodies (provider)
- Main image

- Experimental details
- NULL
- Conjugate
- Yellow dye
- Submitted by
- Invitrogen Antibodies (provider)
- Main image

- Experimental details
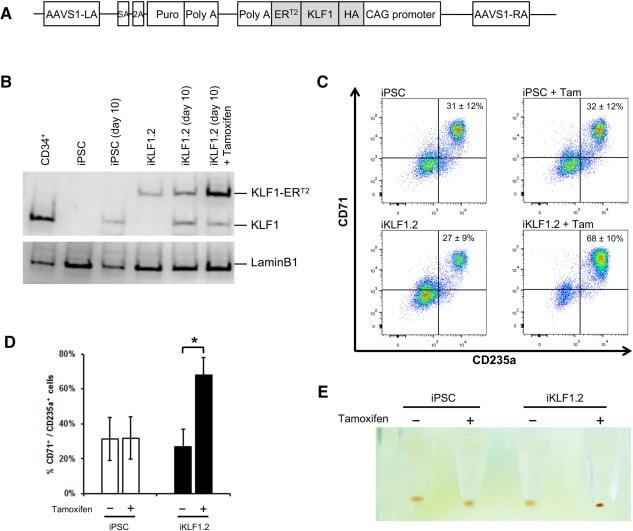
- Figure 3 Activation of KLF1 at day 10 of differentiation results in enhanced erythroid differentiation of hiPSCs. (A) : Schematic of the pZDonor-AAVS1 Puro-CAG-HA-KLF1-ER T2 -PA construct. (B) : Western blot analyses of nuclear cell lysates from adult CD34 + cells that had been differentiated for 6 days into erythroid progenitors, control undifferentiated and differentiated (day 10) induced pluripotent stem cells (iPSCs), undifferentiated iKLF1.2 iPSCs and iKLF1.2 iPSC that had been differentiated for 10 days then treated with tamoxifen for 3 hours. Endogenous KLF1 and the expected larger sized KLF1-ER T2 fusion protein was detected with the anti-KLF1 antibody and the anti-Lamin B1 antibody was used to detect nuclear proteins as a loading control. (C) : Flow cytometry analysis using antibodies against CD235a and CD71 of cells present at day 15 of the erythroid differentiation protocol in control iPSCs and iKLF1.2 iPSC cell lines in the presence (+) and absence (-) of tamoxifen from day 10. ( D) : Quantitation of flow cytometry data representing three independent experiments. Error bars represent SEM. p values were calculated using one-way ANOVA followed by Holm-Sidak's multiple comparison test (* p < .05). ( E) : Image showing the cell pellets from one representative experiment demonstrating a smaller but more intense red pellet in the tamoxifen-treated iKLF1.2 cell line. Abbreviation: iPSCs, induced pluripotent stem cells.
- Conjugate
- Yellow dye
- Submitted by
- Invitrogen Antibodies (provider)
- Main image
- Experimental details
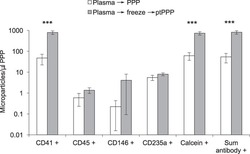
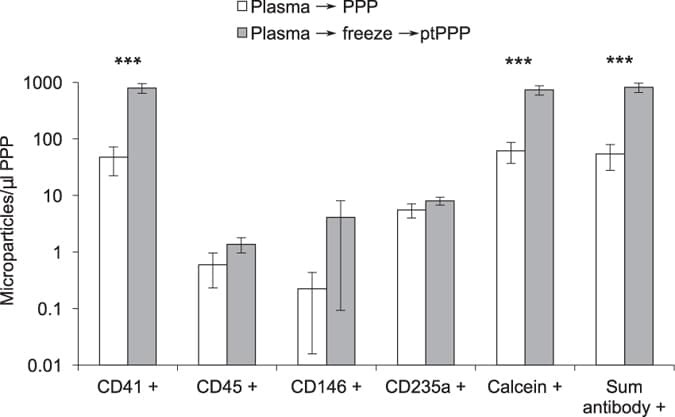
- Figure 3 Freeze/thaw of standard plasma increased platelet MPs in platelet poor plasma (PPP). Standard plasma from six healthy volunteers was either immediately processed to PPP or exposed to a single freeze/thaw cycle prior to a second centrifugation step to remove residual platelets. Platelet (CD41+), leukocyte (CD45+), endothelial (CD146+), and RBC (CD235a) MPs were quantified by flow cytometry. Total number of MPs in a sample was either calculated by the sum of positive events detected by antibody staining (Sum antibody+) or measured by staining with calcein-AM, a non-specific dye that fluorescently labels intact vesicles. Results were similar and showed marked increase after freeze-thaw of standard plasma *** indicates P < 0.001. This effect was largely due to an increase in platelet derived MPs (CD41+).
- Conjugate
- Yellow dye
- Submitted by
- Invitrogen Antibodies (provider)
- Main image
- Experimental details
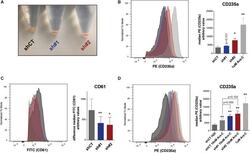
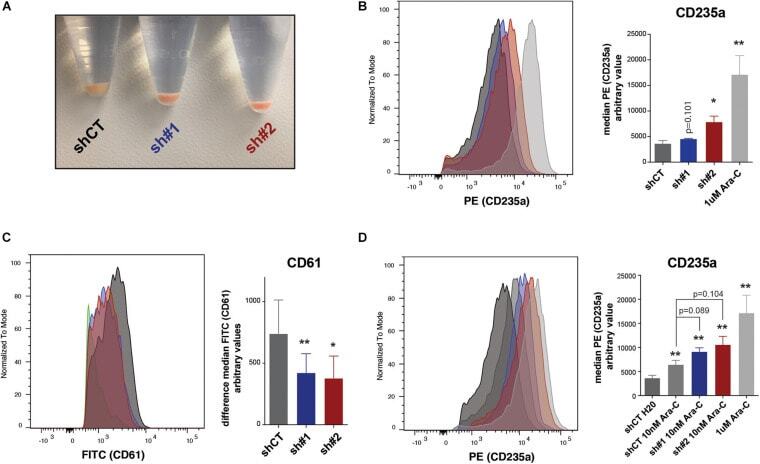
- FIGURE 5 (A) Picture of pelleted K562 infected with an empty short hairpin RNA (shRNA, shCT ) and two shRNAs against PHF19 ( sh #1 and sh#2 ) 5 days after puromycin selection. (B) CD235a marker levels measured by flow cytometry in shCT-, sh# 1-, sh#2-infected cells 4 days after puromycin selection and 1 muM of Ara-C treatment in uninfected cells as a positive control. Left , representative plot of a single experiment. Right , bar plot of the mean of median cytometry values (shCt and sh#1, n = 4; sh#1 and 1 muM of Ara-C, n = 3) + SEM. (C) CD61 marker levels measured by flow cytometry in shCT-, sh# 1-, and sh#2-infected cells 4 days after puromycin selection and treated with 1 nM phorbol myristate acetate (PMA) for 24 h. Left , representative plot of a single experiment. Right , bar plot of the mean of median cytometry values ( n = 3) + SEM. (D) CD235a marker levels measured by flow cytometry at 4 days in shCT-, sh# 1-, and sh#2-infected cells after puromycin selection and treated with 10 nM of Ara-C for 72 h, with 1 muM of Ara-C treatment in uninfected cells as a positive control. Left , representative plot of a single experiment. Right , bar plot of the mean of median cytometry values (shCt, 10 nM Ara-C; sh#1, 10 nM Ara-C, n = 24; sh#1, 10 nM Ara-C, and 1 muM of Ara-C, n = 3) + SEM. * p < 0.05 ; p * * < 0.01 .
- Conjugate
- Yellow dye
- Submitted by
- Invitrogen Antibodies (provider)
- Main image
- Experimental details
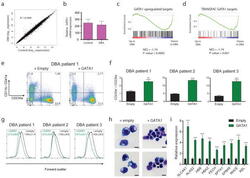
- Figure 4 Global disruption of GATA1 transcriptional activity in DBA patients and rescue of ribosomal protein haploinsufficiency with exogenous GATA1 ( a ) Mean gene expression values of DBA and control patient samples are plotted on a scatter plot with a linear regression shown in red. The coefficient of determination is shown. ( b ) Relative GATA1 mRNA levels are plotted from DBA and control samples. ( c, d ) Enrichment profiles from GSEA comparing the relative expression of genes in DBA patients versus controls and examining the distribution of GATA1 target genes in this data (shown as black bars). ( e ) Representative FACS plots on transduction of bone marrow mononuclear cells from a DBA patient with GATA1 or HMD (empty) control lentiviruses. ( f ) The ratio of erythroid (CD235a + ) to non-erythroid (CD235a - ) -cells is shown after transduction of GATA1 for three independent DBA patients. The data are shown as the mean +- the standard deviation (n = 3). (** p < 0.01; *** p < 0.001). ( g ) Representative FACS forward scatter histogram plots (measuring cell size) of cultured DBA patient cells transduced with control or GATA1 lentivirus. The mean forward scatter intensity is shown +- the standard deviation (n = 3). ( h ) Representative cytospin images of cultured DBA patient cells transduced with control or GATA1 lentivirus. Transduced cells were sorted based on GFP expression and stained with May-Grunwald-Giemsa staining. Scale bar = 10 mum. ( i ) Gene expression analysis b
- Conjugate
- Yellow dye

- Submitted by
- Invitrogen Antibodies (provider)
- Main image

- Experimental details
- Fig. 3 KLF1-activated iPSC-DMs enhance erythroid maturation. a , b . Flow cytometry analyses of live CD235a + -gated cells of UCB-CD34 + erythroid cells cultured alone or in co-culture with iKLF1.2-DMs in the presence and absence of tamoxifen at day 14 ( a ) and day 21 ( b ) stained with anti-CD71 antibody and Hoechst dye (see Supplementary Fig. 3 for gating strategy and FMO controls). c Quantification and statistical analysis of absolute numbers of fully mature enucleated erythroid cells of replicate co-culture experiments ( n = 5 biologically independent samples; two-way ANOVA with Tukey''s post-test). d Cytospin of co-culture of KLF1-activated macrophages and UCB CD34 + cells showing close association and a fully mature erythroid cell with biconcave shape (arrow) (scale bar, 20 mum). e Cytospins of UCB CD34 + erythroid cells cultured alone or in co-culture with iKLF1.2-DM in the presence and absence of tamoxifen at day 14 (upper panels) and day 21 (lower panels); arrows point to enucleated cells (scale bar, 20 mum). * p < 0.05, ** p < 0.01, *** p < 0.001, **** p < 0.0001
- Conjugate
- Yellow dye

- Submitted by
- Invitrogen Antibodies (provider)
- Main image
- Experimental details
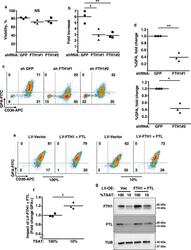
- Fig. 4 Implication of FTH1 in the erythroid iron restriction response. a , b Influence of FTH1 levels on viability and proliferation. Graphs: mean % viable cells and fold increases in cell number for human CD34+ progenitors transduced with lentiviral shRNA vectors targeting either green fluorescent protein (GFP) or ferritin heavy chain (FTH1), and cultured 4 days in iron-replete erythroid medium. Error bars, SEM; n = 3 biologically independent experiments; *, ** P = 0.011, 0.009, one-way ANOVA with Tukey post hoc. NS not significant. GPA glycophorin A. c Influence of FTH1 levels on erythroid differentiation as determined by flow cytometry on cells treated as in a . d Mean fold change in GPA+ cells associated with lentiviral transductions and 4 days culture in iron-replete erythroid medium. Error bars, SEM; n = 3 independent experiments; *, ** P = 0.019, 0.013, unpaired two-sided Student''s t test. Note: most experiments separately assessed FTH1#1 and FTH1#2. e Distinct consequences of ferritin enforcement in iron-replete versus iron-restricted progenitors. Flow cytometry analysis of CD34+ progenitors transduced with lentiviral (LV) expression vectors for ferritin heavy (FTH1) and light (FTL) chains followed by 4 days culture in iron-replete (100% TSAT) or deficient (10% TSAT) erythroid medium. f Mean fold change in GPA+ cells associated with ferritin enforcement in cells cultured as in e . Error bars, SEM; n = 3 independent experiments; * P = 0.02, unpaired two-sided Student'
- Conjugate
- Yellow dye
- Submitted by
- Invitrogen Antibodies (provider)
- Main image
- Experimental details
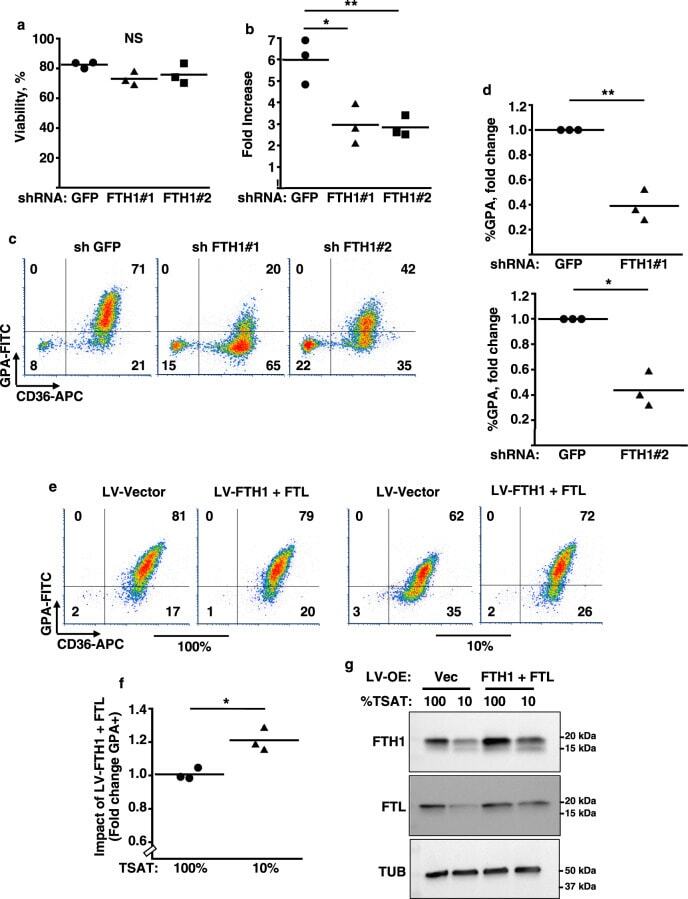
- Figure 1. An Epigenomic and Transcriptional Time Course of Human Erythroid Differentiation (A) Schematic outline of generating matched transcriptome and open chromatin profiles across human erythropoiesis. (B) FACS gating scheme showing expression of surface markers CD71, CD235a, CD49d, and BAND3 used to sort indicated populations P1-P8 (P1, MyP; P2, CFU-E; P3, ProE1; P4, ProE1; P5, BasoE; P6, PolyE; P7, OrthoE; P8, Ortho/Ret). (C and D) Principal-components plots of (C) RNA-seq data and (D) ATAC-seq data, colored by FACS-sorted populations. Color code indicated below. (E) Number of chromatin accessibility peaks across populations. Error bars represent SEM number of peaks per population between replicates. (F) Heatmap showing relative numbers of differentially accessible peaks (top, blue shades) and differentially expressed genes (bottom, red shade) between populations.
- Conjugate
- Yellow dye

- Submitted by
- Invitrogen Antibodies (provider)
- Main image
- Experimental details
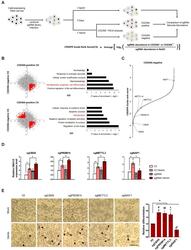
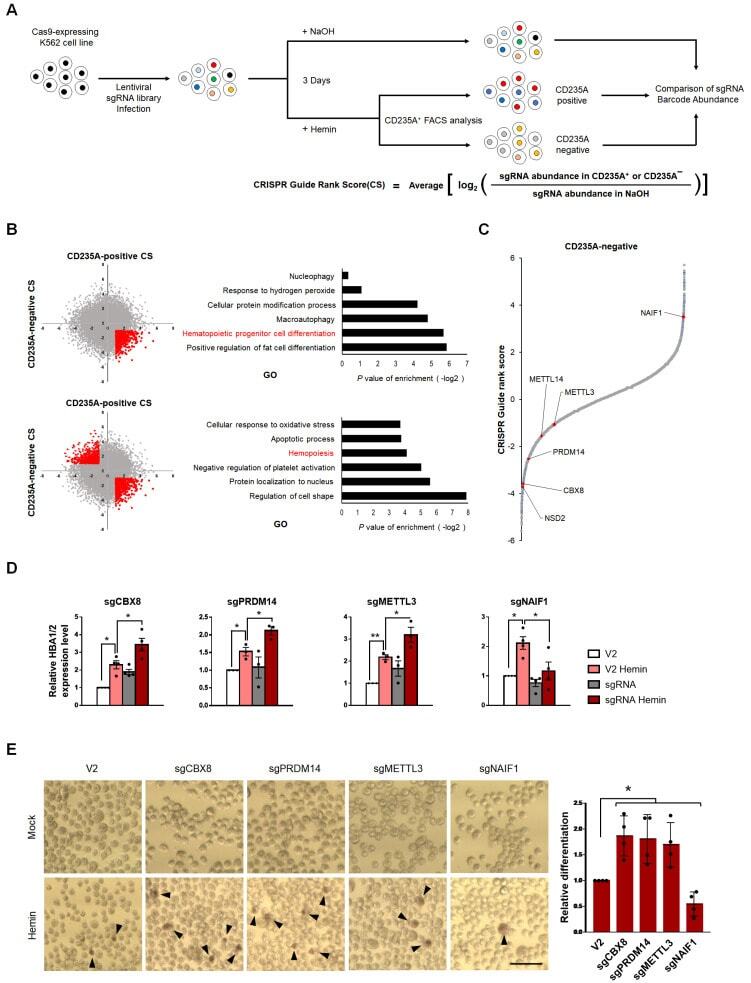
- Fig. 1 Genome-wide CRISPR screening reveals CBX8 as a regulator of K562 cell differentiation. (A) Schematic representation of genome-wide CRISPR-Cas9 screening in K562 cells with and without 3 days 30 uM hemin treatment to induce erythroid differentiation. (B) (left) Scatterplots of CS of CD235A - positive versus CD235A - negative K562 cells. (right) Gene ontology analysis of genes in the indicated regions (red). (C) CS (derived from the average of the four sgRNAs CRISPR-Cas9 guide scores within the sgRNAs targeting a given gene) for CD235A - negative K562 cells by hemin sorted after 3 days. Candidate genes and previously identified genes are indicated in red. (D) RT-qPCR of HBA1/2 in K562 cells with sgV2 (control vector) or sgCBX8, sgPRDM14, sgMETTL3, sgNAIF1 under hemin treatment. (E) (left) Cell differentiation was measured by hemoglobin staining of K562 cells with O-dianisidine. Hemin treatments were conducted for 3 days. Black arrowheads indicate O-dianisidine-positive cells. Scale bar = 25 um. (right) Quantifications are shown. (D) Values are presented as mean +- SEM (n = 3-4). (E) Values are presented as mean +- SD (n = 4). * P < 0.05, ** P < 0.01; Student's t -test.
- Conjugate
- Yellow dye
- Submitted by
- Invitrogen Antibodies (provider)
- Main image

- Experimental details
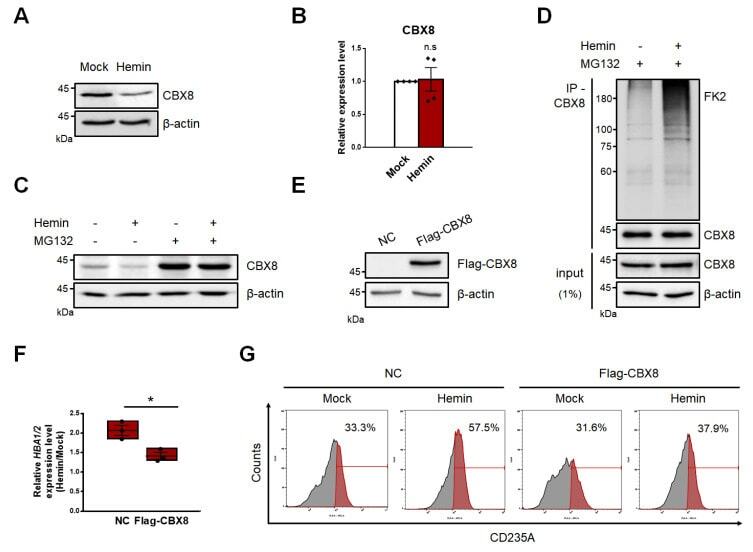
- Fig. 2 CBX8 negatively regulates hemin-mediated K562 cell differentiation. (A) Immunoblots were performed using K562 cell lysates, which were treated with 30 uM hemin for 2 days. (B) RT-qPCR of CBX8 was performed using K562 cells treated with 30 uM hemin for 2 days. n.s, not significant. (C) Immunoblots were performed using K562 cell lysates, which were treated with 30 uM hemin for 2 days and 20 uM MG132 proteasome inhibitor for 8 h before harvested. (D) IP of endogenous CBX8 in K562 cells was performed to investigate polyubiquitination chains of CBX8. Cell lysates were immunoprecipitated using anti-CBX8 antibodies, and polyubiquitination chains were immunoblotted using FK2 antibodies that detect mono- and poly-ubiquitin. (E) Overexpression of flag-tagged CBX8 was confirmed by immunoblots. NC, normal control. (F) RT-qPCR of HBA1/2 was performed using K562 cells stably expressing flag-tagged CBX8. The relative increase of expression in cells treated with 30 uM hemin for 2 days was quantified compared to that of a mock experiment. (G) Histogram showing erythroid differentiation upon 30 uM hemin treatment for 3 days. K562 cells expressing control vector (NC) or flag-tagged CBX8 were stained with anti-APC-CD235A and FACS sorted. (B and F) Values are presented as mean +- SEM (n = 3-4). * P < 0.05; Student's t -test.
- Conjugate
- Yellow dye
- Submitted by
- Invitrogen Antibodies (provider)
- Main image
- Experimental details
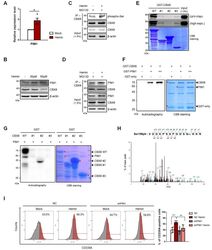
- Fig. 4 Phosphorylation of serine 196 on CBX8 by PIM1 affects K562 cell differentiation. (A) RT-qPCR of PIM1 was performed using K562 cells treated with 30 uM hemin for 2 days. (B) Immunoblots were performed using K562 cell lysates, which were treated with 30 uM, 50 uM hemin for 2 days. (C) IP of endogenous CBX8 in K562 cells was performed and proteins were immunoblotted with the indicated antibodies. (D) IP of endogenous CBX8 was performed using K562 cells treated with 30 uM hemin for 2 days and proteins were immunoblotted with the indicated antibodies. (E) GST-CBX8 WT and deletion constructs were used for GST pulldown assay with 293T cell lysates transiently expressed GFP-tagged PIM1, followed by elution and separation by SDS-PAGE. The amount of GST-CBX8 WT or deletion constructs were determined by Coomassie brilliant blue (CBB) staining. (F) In vitro kinase assay using GST-CBX8 and GST-PIM1. The phosphorylated GST-CBX8 by PIM1 were visualized via autoradiography and the amounts of GST-fusion proteins used in the assay are shown in the CBB staining. (G) In vitro kinase assay using GST-CBX8 deletion mutants and GST-PIM1. The phosphorylated GST-CBX8 WT and #2 deletion mutant were visualized via autoradiography. The amounts of GST-fusion proteins used in the assay are shown in the CBB staining. (H) GST-CBX8 modified with phosphorylation on serine 196. Mass spectrometry analysis (LC-MS / MS) was performed after in vitro kinase assay with GST-CBX8 and GST-PIM1. The graph shown in
- Conjugate
- Yellow dye

- Submitted by
- Invitrogen Antibodies (provider)
- Main image

- Experimental details
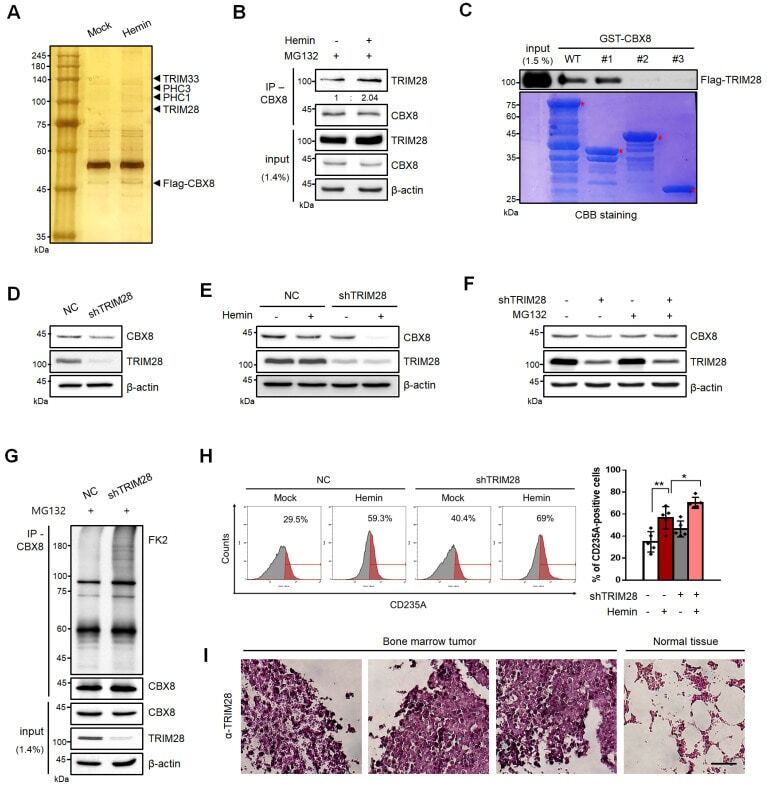
- Fig. 5 TRIM28 induces CBX8 protein stabilization. (A) K562 cells stably expressing flag-tagged CBX8 were treated with 30 uM hemin for 2 days. Proteins in complexes with flag-tagged CBX8 were separated by SDS-PAGE after immunoprecipitation and visualized via silver staining. (B) IP of endogenous CBX8 in K562 cells was performed to confirm the interaction between TRIM28 and CBX8. K562 cells were treated with 30 uM hemin for 2 days and MG132 for 8 h before harvested. (C) GST-CBX8 WT and deletion mutants were used for GST pulldown assays. Extracts of 293T cells transiently expressing flag-tagged TRIM28 were incubated with GST-CBX8 or GST-CBX8 deletion mutants followed by elution and separation by SDS-PAGE. The amount of GST-CBX8 WT or deletion constructs were determined by CBB staining. (D) Immunoblots were performed using normal control (NC) and shTRIM28 K562 cells. (E) Immunoblots were performed using NC and shTRIM28 K562 cells treated with 30 uM hemin for 2 days. Each protein was blotted with the indicated antibodies. (F) Immunoblots were performed using NC and shTRIM28 K562 cells, treated with 30 uM hemin for 2 days and 20 uM MG132 for 8 h before being harvested. (G) IP of endogenous CBX8 in K562 cells was performed to investigate polyubiquitination chains of CBX8. NC and shTRIM28 K562 cells were treated with 20 uM MG132 for 8 h before harvested. Cell lysates were immunoprecipitated using anti-CBX8 antibodies and polyubiquitination chains were immunoblotted using FK2 antibodi
- Conjugate
- Yellow dye
- Submitted by
- Invitrogen Antibodies (provider)
- Main image
- Experimental details
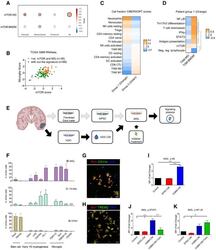
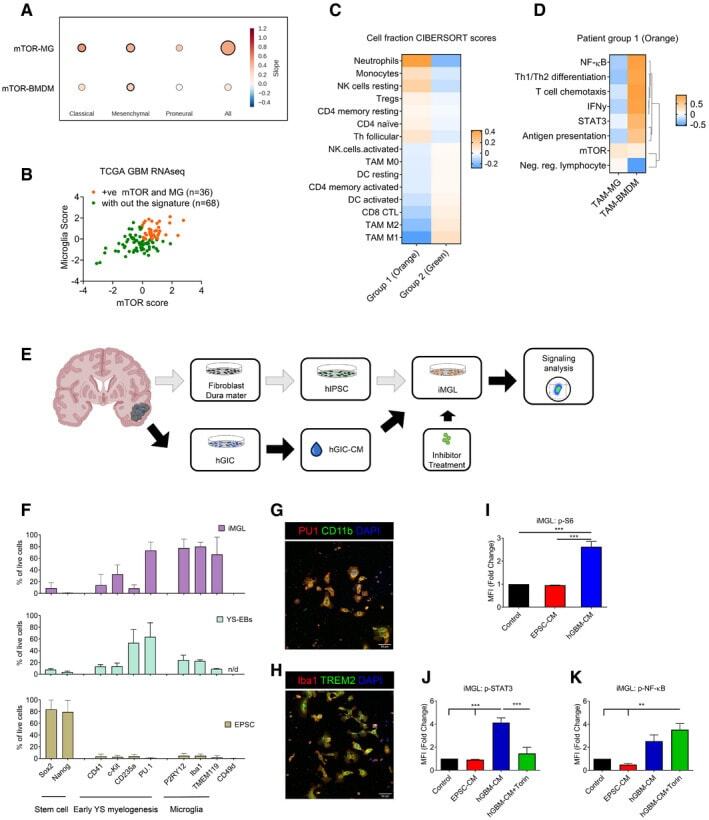
- Figure 7 mTOR signalling in TAM - MG promotes immune evasion mechanisms in human glioblastoma A Correlation between ssGSEA enrichment scores for the mTOR signature versus TAM-MG or TAM-BMDM signatures in TCGA-GBM transcriptomic data. Comparison carried out on all IDH-wild-type samples and in a subgroup-specific manner according to Wang's classifier. Size of circle is indicative of R-square value, and bold outline represents a P
- Conjugate
- Yellow dye
- Submitted by
- Invitrogen Antibodies (provider)
- Main image

- Experimental details
- Figure 10 Hematopoiesis analysis Flow cytometry analysis of the indicated cell surface markers at day 4 of hemogenic endothelium culture.
- Conjugate
- Yellow dye
- Submitted by
- Invitrogen Antibodies (provider)
- Main image
- Experimental details
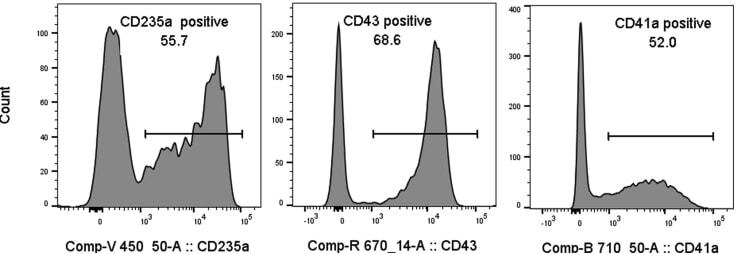
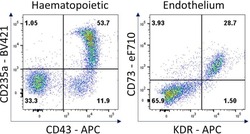
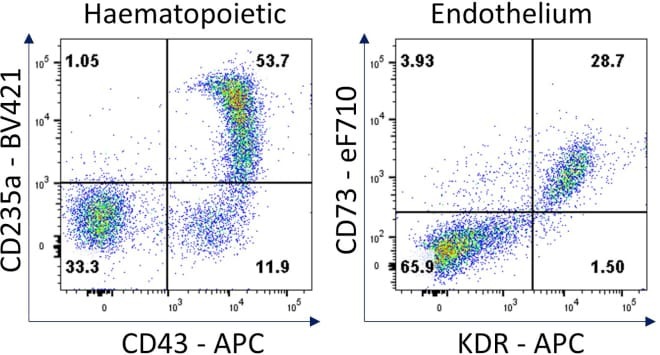
- Figure 7 Hematopoietic and endothelial cell characterization Flow cytometry analysis of day 4 hemogenic culture for hematopoietic (CD43, CD235a) and endothelial (KDR, CD73) cell surface markers.
- Conjugate
- Yellow dye
- Submitted by
- Invitrogen Antibodies (provider)
- Main image
- Experimental details
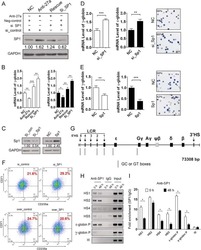
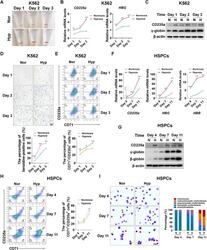
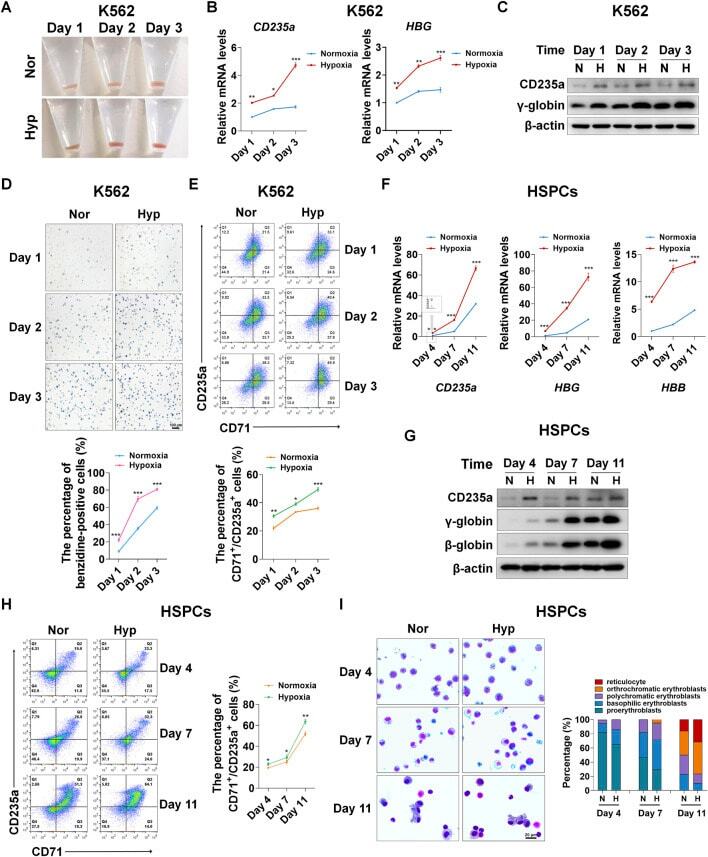
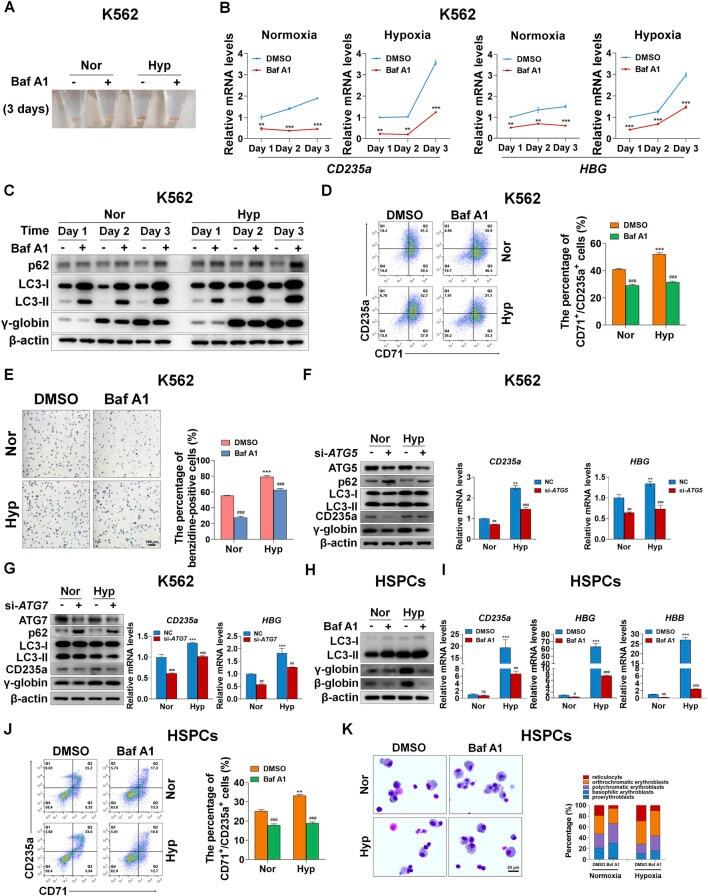
- FIGURE 1 Hypoxia accelerates erythroid differentiation (A) Reddish pellets of K562 cells in the process of erythroid differentiation under normoxia and hypoxia. Redder pellets indicate more accumulation of hemoglobin (B) qRT-PCR analysis of the relative mRNA levels of specific erythrocyte markers CD235a and HBG. qRT-PCR was performed at the indicated time points after K562 cells were exposed to normoxia or hypoxia during erythroid differentiation. * p < 0.05, ** p < 0.01, *** p < 0.001, versus the corresponding normoxia group at different time points (C) Western blot analysis of CD235a and gamma-globin protein expression at the indicated time points after K562 cells were exposed to normoxia or hypoxia. N: normoxia; (H) hypoxia (D) Representative images of benzidine staining in K562 cells differentiated into erythrocytes. The line graph below shows the percentage of benzidine-positive cells. Scale Bar = 100 mum *** p < 0.001, versus the corresponding normoxia group. Nor: normoxia; Hyp: hypoxia (E) Flow cytometry plots show the expression of CD235a and CD71 in K562 cells. The line graph below shows the percentage of CD71 + /CD235a + cells. * p < 0.05, ** p < 0.01, *** p < 0.001, versus the respective normoxia group (F) qRT-PCR analysis of the relative mRNA levels of CD235a, HBG and HBB in HSPCs. qRT-PCR was performed at the indicated time points after HSPCs were exposed to normoxia or hypoxia during erythroid differentiation. *** p < 0.001, versus the respective normoxia group
- Conjugate
- Yellow dye
- Submitted by
- Invitrogen Antibodies (provider)
- Main image

- Experimental details
- FIGURE 3 Autophagy mediates erythroid differentiation promoted by hypoxia (A) Reddish pellets of K562 cells differentiated into erythrocytes treated with DMSO or Baf A1 (20 nM) under normoxia and hypoxia. The red color of pellets was lightened by Baf A1 in both normoxia and hypoxia (B) qRT-PCR analysis of the relative mRNA levels of CD235a and HBG at the indicated time points after K562 cells treated with DMSO (-) as control or Baf A1 (+, 20 nM) were induced into erythroid differentiation under normoxia or hypoxia conditions. ** p < 0.01; *** p < 0.001. versus the respective normoxia group at different time points (C) Western blot analysis of p62, LC3 and gamma-globin protein expression at the indicated time points after K562 cells differentiated into erythrocytes were treated with DMSO (-) as control or Baf A1 (+, 20 nM) under normoxia or hypoxia. Nor: normoxia; Hyp: hypoxia (D) Flow cytometry plots show the expression of CD235a and CD71 in K562 cells differentiated into erythrocytes that were treated with DMSO (-) as control or Baf A1 (+, 20 nM) under normoxia or hypoxia for 3 days. The graph on the right shows the percentage of CD71 + /CD235a + cells. *** p < 0.001, versus the DMSO group under normoxia. ### p < 0.001, versus the respective DMSO group under normoxia or hypoxia (E) Representative images of benzidine staining in K562 cells treated the same as (D) . The right graph shows the percentage of benzidine-positive cells. Scale Bar = 100 mum *** p < 0.001, versus the
- Conjugate
- Yellow dye
- Submitted by
- Invitrogen Antibodies (provider)
- Main image
- Experimental details
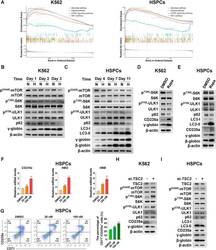
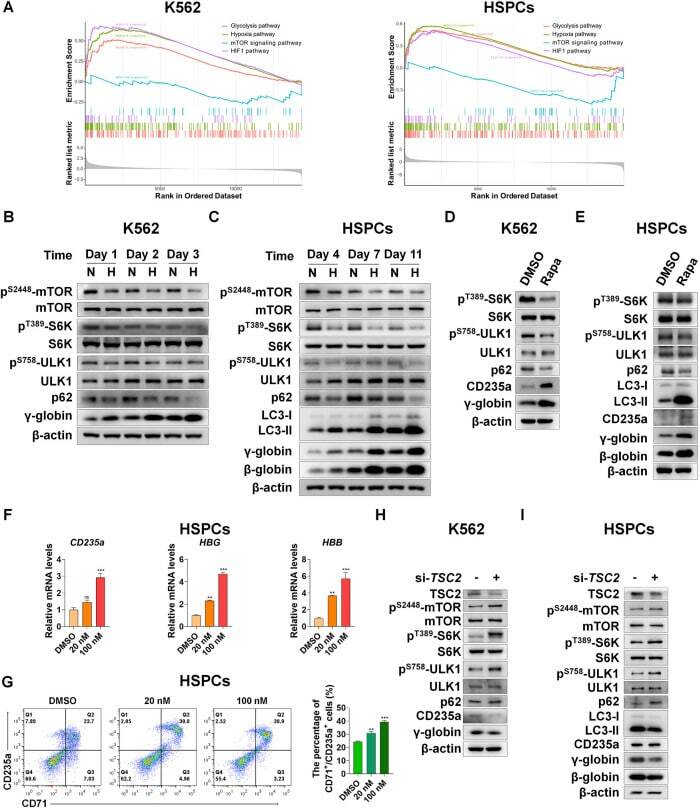
- FIGURE 4 Suppression of mTORC1 is required for inducing autophagy and accelerating erythroid differentiation under hypoxia (A) After K562 cells (left) and HSPCs (right) differentiated erythrocytes were exposed to normoxia or hypoxia for 3 day and 7 days, respectively, RNA-seq was performed, and then GSEA was used to analyze the major pathways related to hypoxia. NES, normalized enrichment score (B,C) Western blot shows the effects of hypoxia on p62, LC3, gamma-globin or beta-globin protein levels and mTORC1 activity at different time points in the process of erythroid differentiation of K562 cells or HSPCs (D,E) Western blot analysis of the effects of Rapa (100 nM) on p62, LC3, CD235a, gamma-globin or beta-globin protein levels and mTORC1 activity in K562- or HSPCs-differentiated erythrocytes under normoxia (F) qRT-PCR analysis of the relative mRNA levels of CD235a, HBG and HBB after HSPCs were differentiated into erythrocytes which were treated with DMSO or different concentrations of Rapa for 3 days from the fourth day to the seventh day of differentiation under normoxia. ns, not significant, ** p < 0.01, *** p < 0.001, versus the DMSO group (G) Flow cytometry plots show the expression of CD235a and CD71 in HSPCs-differentiated erythrocytes treated the same as (F) . The graph on the right shows the percentage of CD71 + /CD235a + cells. ** p < 0.01, *** p < 0.001. versus the DMSO group (H,I) Western blot analysis of the effects of TSC2 knockdown on p62, LC3, CD235a, gamma-gl
- Conjugate
- Yellow dye
- Submitted by
- Invitrogen Antibodies (provider)
- Main image

- Experimental details
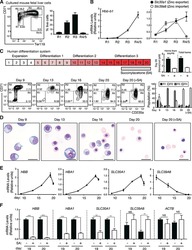
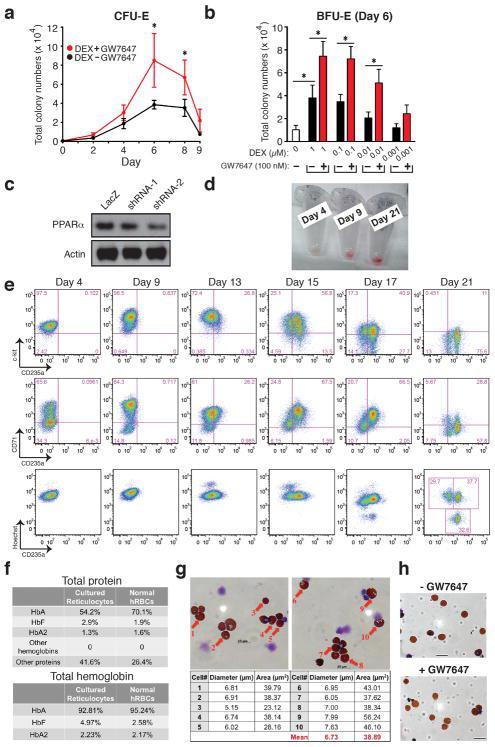
- Extended Figure 2 Human CD34 + Erythroid Differentiation System a , Total CFU-E colonies formed during day 0-9. CFU-E colony numbers were quantified by plating 1000 cells from various time points during day 0-9 of the human CD34 + erythroid culture on methylcellulose. CFU-E colonies were quantified after 12-14 days. Total CFU-E colony numbers in culture under conditions without GW7647 (black line) or with GW7647 (red line) were calculated using the total cell numbers at corresponding time points in Figure 2a. b , Human CD34+ cells were treated at day 1 with 100 nM GW7647 with or without DEX at the concentration indicated in the figure. At day 6, total cell numbers were counted and cells were collected for BFU-E colony assays. c , Protein expression of PPARalpha demonstrating shRNA knock-down efficiency via lentiviral transduction. LacZ shRNA is used as a control. shRNA-1 and -2 are both specific for PPARalpha . shRNA-2 has higher knock-down efficiency. d , Cell pellets of 1 million cells demonstrating hemoglobin accumulation during the differentiation process. e , Flow cytometry analyses of erythroid markers during the 21-day human CD34 + erythroid culture. (top row) c-kit vs. CD235a; (middle row) CD71 vs. CD235a. Note the sequential induction of c-kit, CD71 and CD235a, as well as the sequential down-regulation of c-kit and CD71, (bottom row) Enucleated reticulocytes are CD235a + Hoechst - , nuclei are CD235a - Hoechst + , and nucleated erythroblasts are CD235a + Hoechst + .
- Conjugate
- Yellow dye
- Submitted by
- Invitrogen Antibodies (provider)
- Main image
- Experimental details
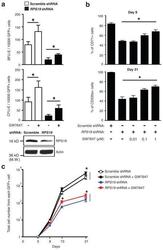
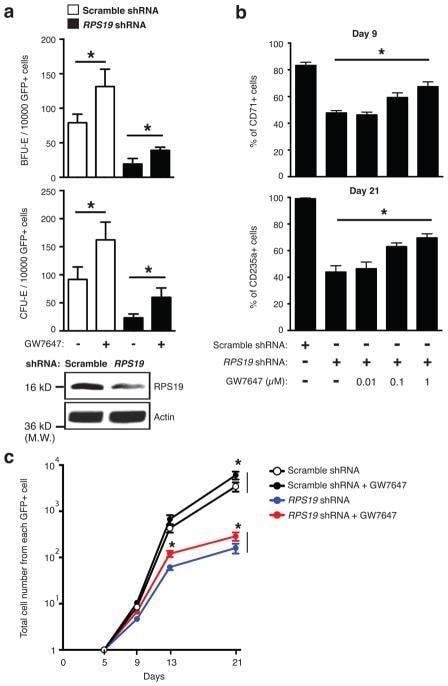
- Extended Figure 3 GW7647 increases erythroid progenitors and CD235a + cells in RPS19 knock down human progenitor cells a , Human CD34 + hematopoietic progenitors were transduced with lentivirus encoding GFP and either a scrambled shRNA or an shRNA targeting RPS19. Then transduced cells were treated with or without 100 nM GW7647. After 48 hrs, GFP + cells were sorted by FACS and plated for BFU-E and CFU-E colony forming assays. RPS19 knocking down efficiency is shown at the bottom. (* p < 0.05; Student t test. Error bars represent mean +- S.D. from three independent experiments.) b. Sorted GFP + cells were returned to culture with the indicated concentration of GW7647. (Top) Percentage of CD71 + cells at day 9 in was determined by FACS; (Bottom) Percentage of CD235a + cells at day 21 was determined by FACS. (* p < 0.05; Student t test. Error bars represent mean +- S.D. from three independent experiments.) c. Total cell numbers generated from one GFP positive cell at the indicated times of culture. (* p < 0.05; Student t test. Error bars represent mean +- S.D. from three independent experiments.)
- Conjugate
- Yellow dye
- Submitted by
- Invitrogen Antibodies (provider)
- Main image
- Experimental details
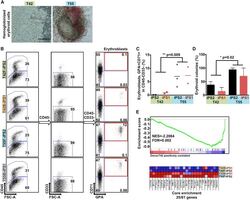
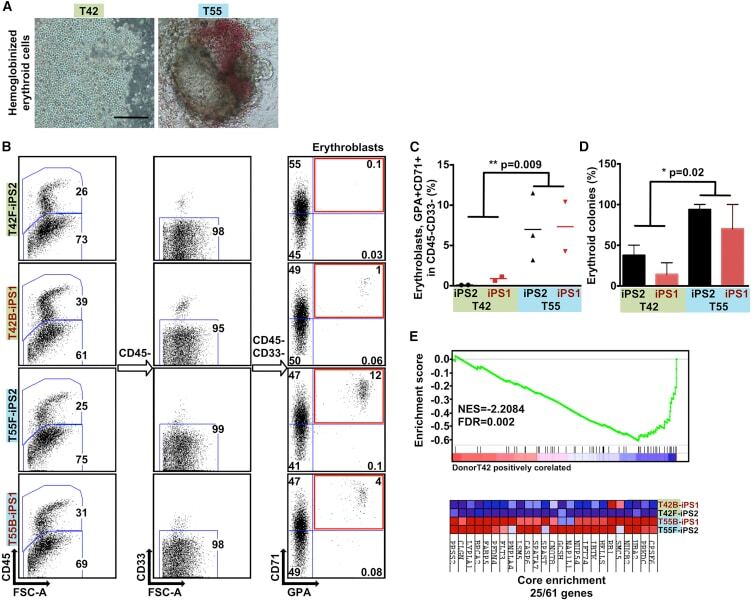
- Figure 5 iPSCs Derived from Different Donors Show Variable Erythroid Lineage Differentiation Propensity (A) Representative micrographs showing the hematopoietic cells differentiated from iPSCs with reduced hemoglobinized erythroid cells in iPSCs derived from T42 (left panel). Scale bar, 100 mum. (B) Representative FACS plots of differentiated genetically matched F- and B-iPSC lines (n = 4) showing the percentage of erythroblasts (GPA+ CD71+ gated from CD45- CD33-). (C) Scatter graphs presenting percentage of erythroblasts generated from the genetically matched F- and B-iPSC lines. Each dot represents an independent experiment. (D) Percentage of erythroid colonies out of the total colony number generated from iPSC lines. Values are mean +- SEM. Statistics performed by Student's t test, in three or four biological replicates. (E) Gene set enrichment plot and heatmap showing the genes constituting the core enrichment of overlap between multi-potent progenitors sorted from the bone marrow of DBA patients and iPSC lines derived from T42 cells. T42 iPSC lines show decreased expression levels of genes that are downregulated in Diamond-Blackfan anemia patients.
- Conjugate
- Yellow dye
- Submitted by
- Invitrogen Antibodies (provider)
- Main image
- Experimental details
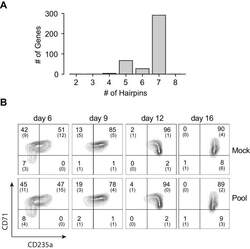
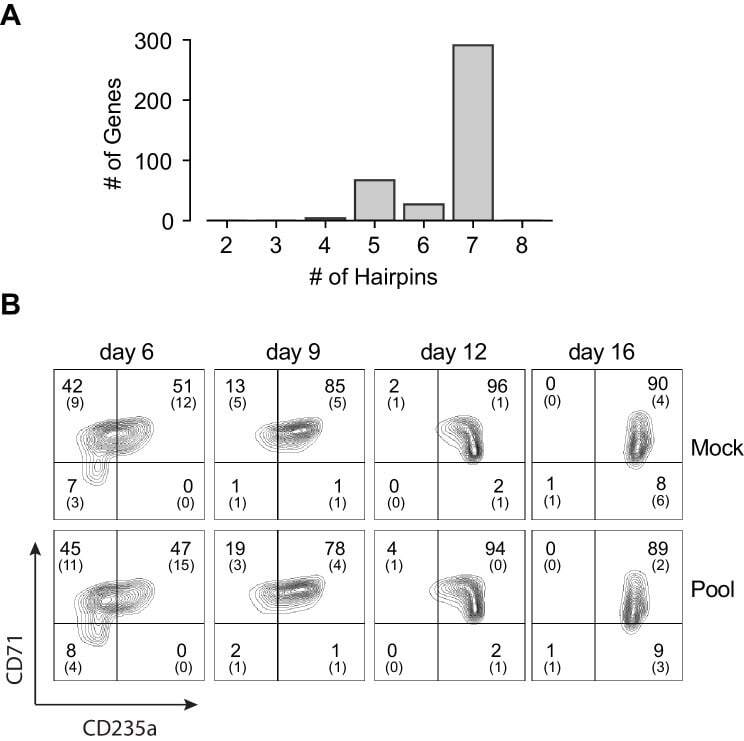
- Figure 1--figure supplement 3. Pooled shRNA screen in primary HSPCs undergoing erythroid differentiation. ( A ) Histogram showing distribution of number of independent hairpins included in the library to target each of the candidate's genes. ( B ) Representative FACS plots of erythroid cell surface markers CD71 (transferrin receptor) and CD235a (Glycophorin A) expression at various time points during erythroid differentiation at which deep sequencing of shRNAs was performed. Percentages in each quadrant is represented as mean and standard deviation of 3 experiments from independent donors that were uninfected (Mock) or infected with the shRNA library (Pool).
- Conjugate
- Yellow dye
- Submitted by
- Invitrogen Antibodies (provider)
- Main image
- Experimental details
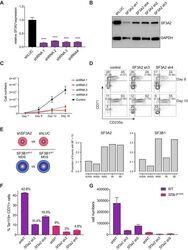
- Figure 6. SF3A2 is a Key regulator of Human Erythropoiesis and Modulates Erythropoiesis Defects in a Murine Model of MDS. ( A ) Quantitative RT-PCR and ( B ) Western blot showing the expression of SF3A2 in human CD34 + cells five days post-infection with the respective lentiviral shRNAs targeting SF3A2 (sh1-4) and a control luciferase gene (shLUC). ( C ) Growth curves showing that downregulation of SF3A2 results in reduced total cell numbers during erythroid differentiation from three independent experiments. ( D ) Representative FACS plots of erythroid cell surface markers CD71 (transferrin receptor) and CD235a (Glycophorin A) expression at various time points during erythroid differentiation. Percentages in each quadrant are represented as mean and standard deviation of three independent experiments ( E ) Altered splicing events identified by RNA-Seq analysis of stage matched erythroid cells (shSF3A2 vs. shLUC). Overlapping changes observed in SF3B1 mutant BM cells from MDS patients (Obeng et al) ( Figure 6--source data 5 and 6 ). Differentially expressed genes and pathway analysis available in Figure 6--source data 1 - 4 . ( F ) Lineage negative bone marrow cells from wildtype (WT) and Sf3b1 K700E mice were infected with shRNAs targeting murine Sf3a2 gene co-expressing a reporter GFP gene. Percentage of Ter119 + CD71 + erythroid cells within the GFP compartment after 48 hr in erythroid differentiation. ( G ) Total cell numbers of GFP + erythroid cells after
- Conjugate
- Yellow dye
