Explore
 Validate
 Learn
LearnPA5-55656
antibody from Invitrogen Antibodies
Targeting: SORBS1
CAP, FLJ12406, KIAA1296, ponsin, SH3D5, sh3p12
 Western blot
 Immunocytochemistry
Antibody data
- Antibody Data
- Antigen structure
- References [1]
- Comments [0]
- Validations
- Immunocytochemistry [2]
- Immunohistochemistry [5]
- Other assay [2]
Submit
Validation data
Reference
Comment
Report error
- Product number
- PA5-55656 - Provider product page

- Provider
- Invitrogen Antibodies
- Product name
- SORBS1 Polyclonal Antibody
- Antibody type
- Polyclonal
- Antigen
- Recombinant protein fragment
- Description
- Immunogen sequence: DSSPLLNEVS SSLIGTDSQA FPSVSKPSSA YPSTTIVNPT IVLLQHNREQ QKRLSSLSDP VSERRVGEQD SAPTQEKPTS PGKAIEKRAK DDSRRVVKST QDLSDVSMDE VGIPLRNTER SKDWYKTMFK QIHKLNR Highest antigen sequence identity to the following orthologs: Mouse - 84%, Rat - 85%.
- Reactivity
- Human
- Host
- Rabbit
- Isotype
- IgG
- Vial size
- 100 μL
- Concentration
- 0.3 mg/mL
- Storage
- Store at 4°C short term. For long term storage, store at -20°C, avoiding freeze/thaw cycles.
Submitted references MicroRNA miR-3646 promotes malignancy of lung adenocarcinoma cells by suppressing sorbin and SH3 domain-containing protein 1 via the c-Jun NH2-terminal kinase signaling pathway.
Wang C, Cheng B
Bioengineered 2022 Mar;13(3):4869-4884
Bioengineered 2022 Mar;13(3):4869-4884
No comments: Submit comment
Supportive validation
- Submitted by
- Invitrogen Antibodies (provider)
- Main image
- Experimental details
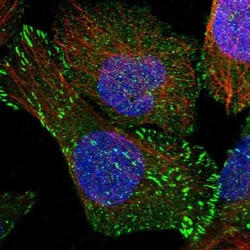
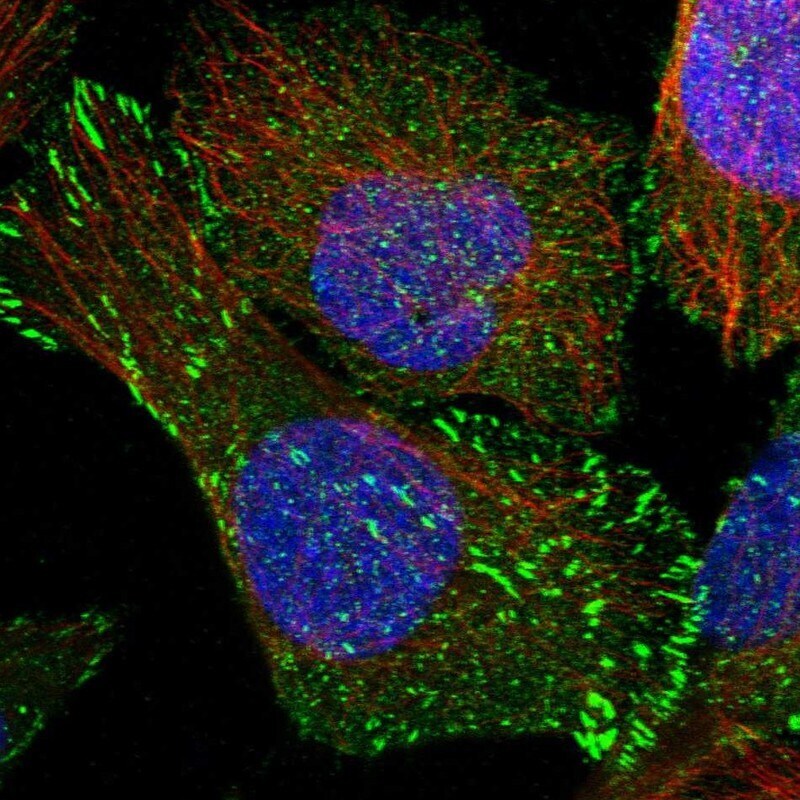
- Immunofluorescent staining of SORBS1 in human cell line U-2 OS shows positivity in plasma membrane, centrosome & focal adhesion sites. Samples were probed using a SORBS1 Polyclonal Antibody (Product # PA5-55656).

- Submitted by
- Invitrogen Antibodies (provider)
- Main image

- Experimental details
- Immunofluorecent analysis of SORBS1 in human cell line U-2 OS using SORBS1 Polyclonal Antibody (Product # PA5-55656). Staining shows localization to plasma membrane, centrosome and focal adhesion sites.
Supportive validation
- Submitted by
- Invitrogen Antibodies (provider)
- Main image
- Experimental details
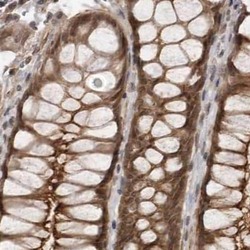
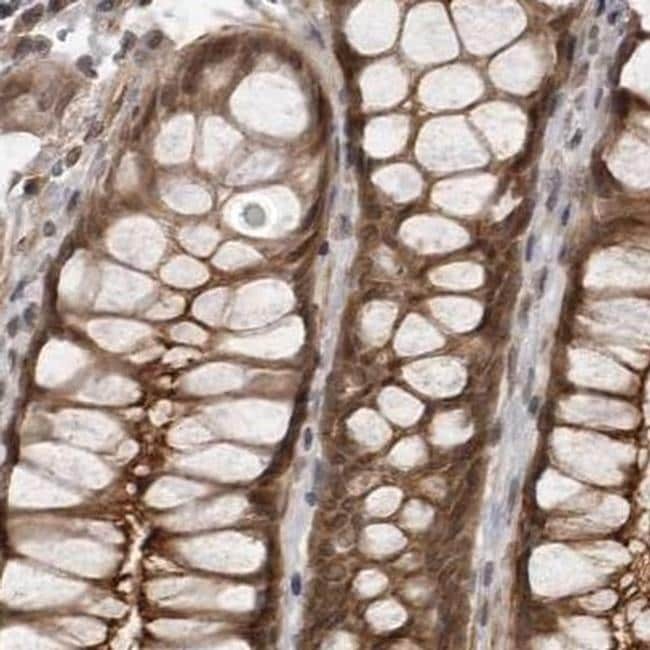
- Immunohistochemical staining of SORBS1 in human colon using SORBS1 Polyclonal Antibody (Product # PA5-55656).
- Submitted by
- Invitrogen Antibodies (provider)
- Main image

- Experimental details
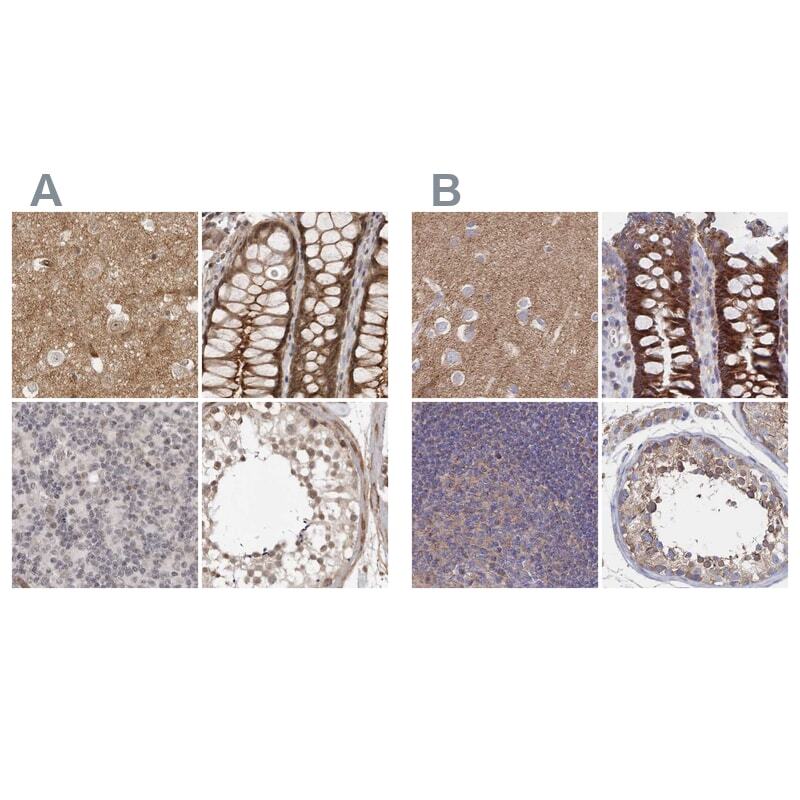
- Immunohistochemical staining of SORBS1 in human cerebral cortex, colon, lymph node and testis using SORBS1 Polyclonal Antibody (Product # PA5-55656) (A) shows similar protein distribution across tissues to an independent SORBS1 Polyclonal Antibody (B).
- Submitted by
- Invitrogen Antibodies (provider)
- Main image

- Experimental details
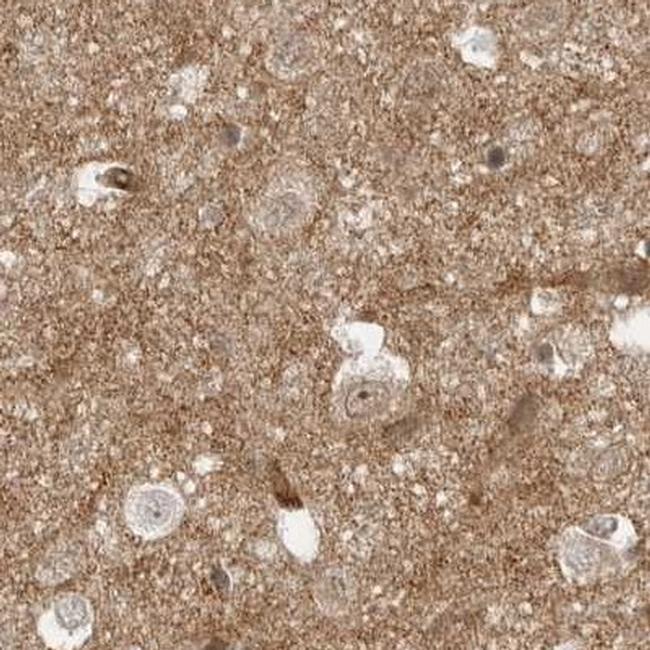
- Immunohistochemical staining of SORBS1 in human cerebral cortex using SORBS1 Polyclonal Antibody (Product # PA5-55656).
- Submitted by
- Invitrogen Antibodies (provider)
- Main image

- Experimental details
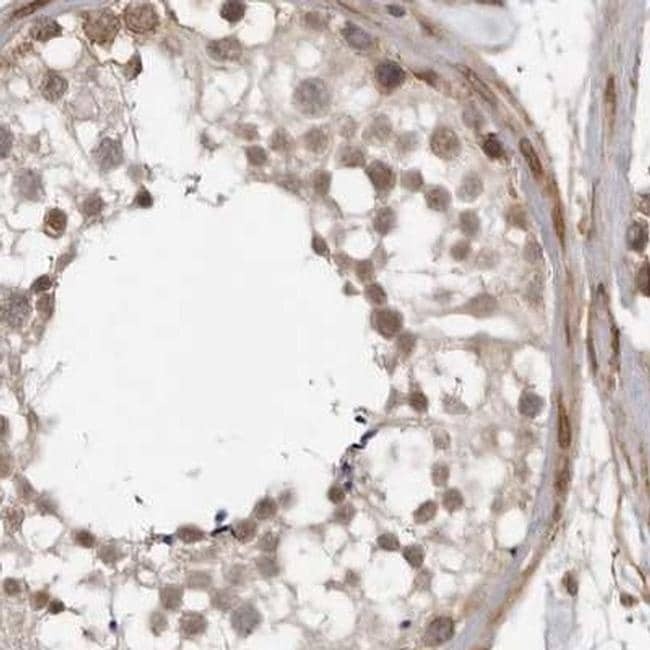
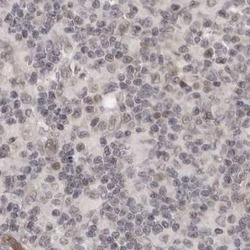
- Immunohistochemical staining of SORBS1 in human testis using SORBS1 Polyclonal Antibody (Product # PA5-55656).
- Submitted by
- Invitrogen Antibodies (provider)
- Main image
- Experimental details
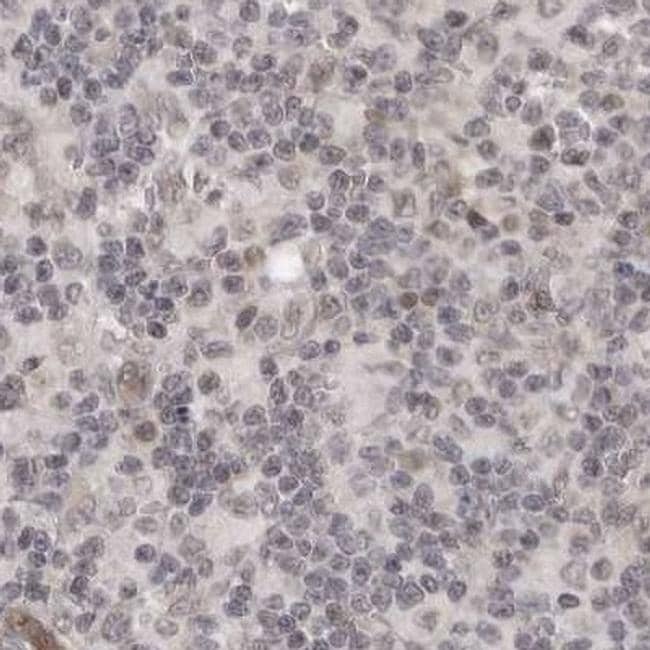
- Immunohistochemical staining of SORBS1 in human lymph node using SORBS1 Polyclonal Antibody (Product # PA5-55656).
Supportive validation
- Submitted by
- Invitrogen Antibodies (provider)
- Main image
- Experimental details
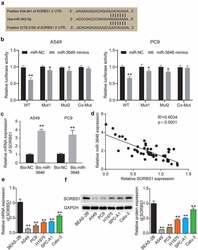
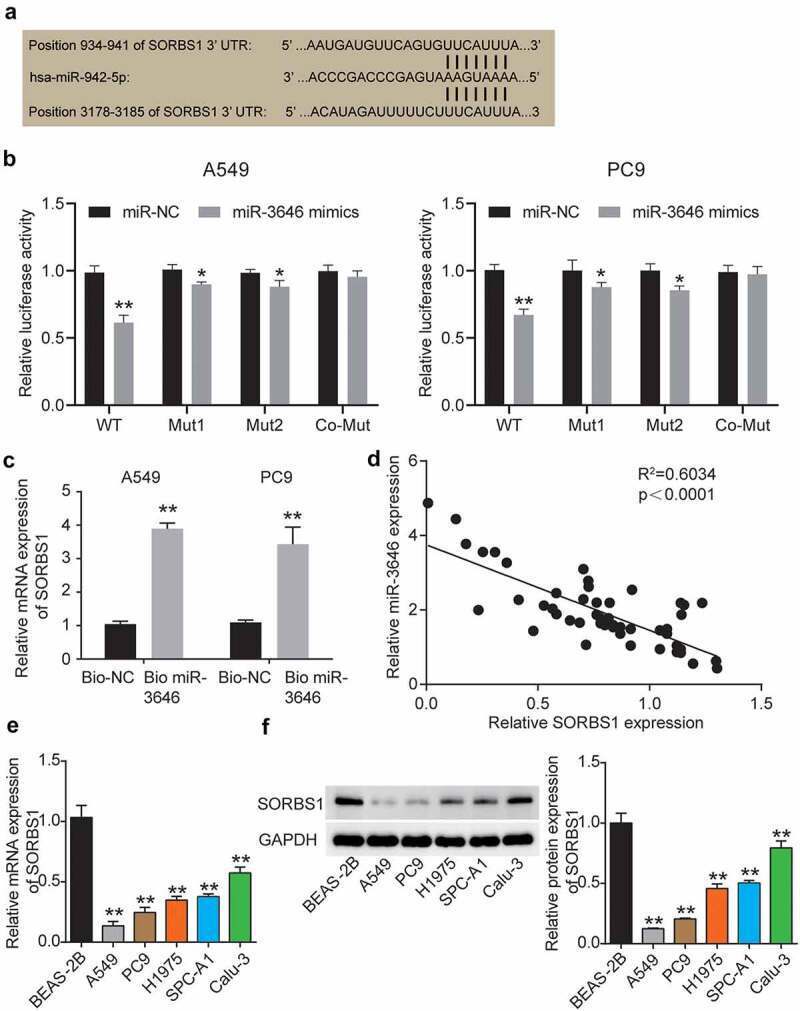
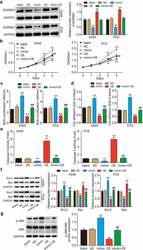
- Figure 3. MiR-3646 targeted SORBS1 by binding to its 3'UTR oligonucleotide sequence. (a) TargetScan Human 7.2 was used to predict the potential binding site between miR-3646 and its targeted gene. (b) Potential binding between miR-3646 and the 3'UTR of SORBS1 mRNA was demonstrated by the luciferase reporter assay. *P < 0.05, **P < 0.001, compared with corresponding miR-NC group. (c) The interaction between SORBS1 and miR-3646 was evaluated by RNA pull-down analysis. **P < 0.001, compared with Bio-NC group. (d) Negative correlation between miR-3646 and SORBS1 expression was identified by Pearson's correlation analysis. (e) SORBS1 mRNA expression in LUAD cell lines was analyzed by qRT-PCR. Except for Beas-2B cell line, the others are LUAD cell lines. LUAD cell lines including A549, PC9, Calu-3, SPC-A1 and H1975 showed lower expression of SORBS1 mRNA compared to Beas-2B cell line. **P < 0.001, compared with Beas-2B cell line. (f) SORBS1 protein expression in LUAD cell lines was analyzed by Western blotting. Except for Beas-2B cell line, the others are LUAD cell lines. LUAD cell lines including A549, PC9, Calu-3, SPC-A1 and H1975 showed lower expression of SORBS1 protein compared to Beas-2B cell line. The error bars were derived from 3 independent parallel experiments. **P < 0.001, compared with Beas-2B cell line.
- Submitted by
- Invitrogen Antibodies (provider)
- Main image
- Experimental details
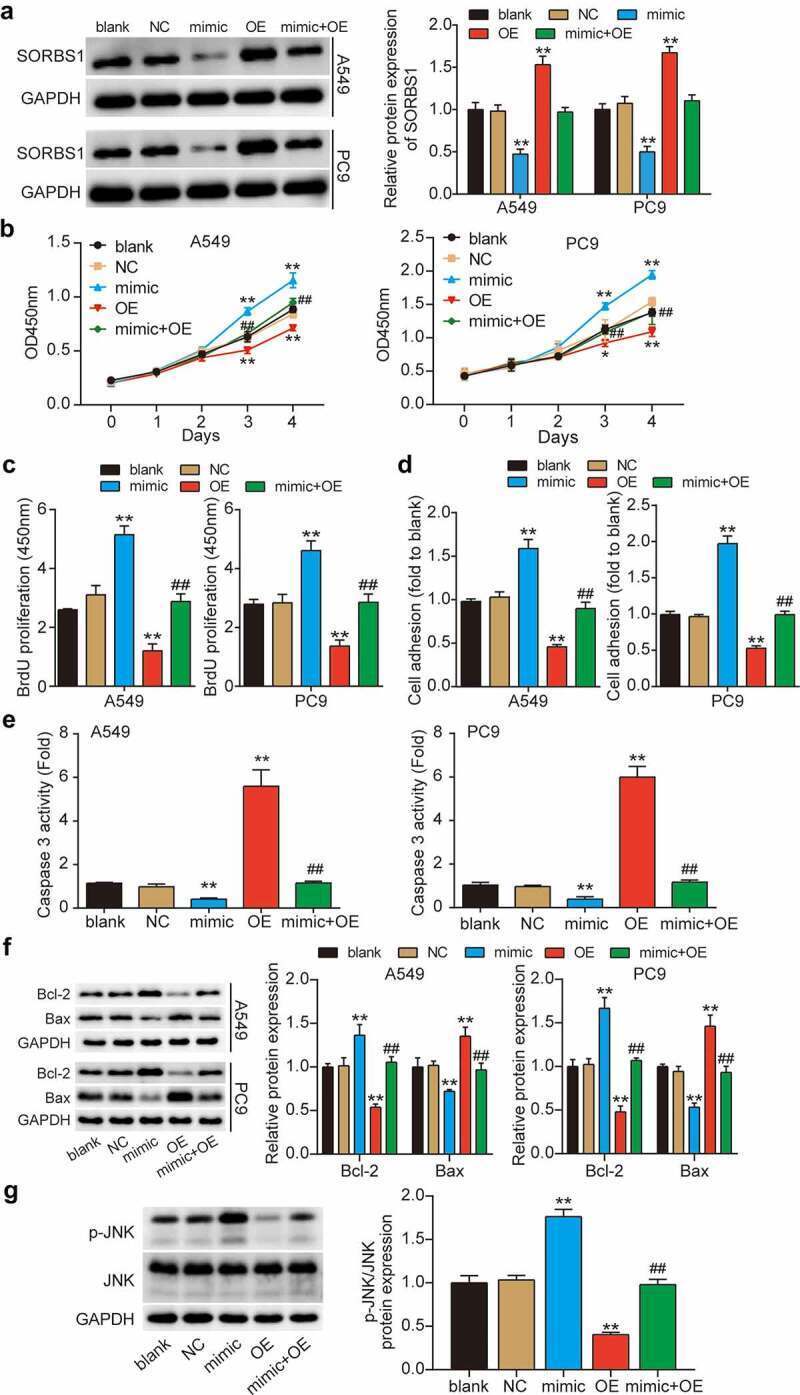
- Figure 4. MiR-3646 advanced LUAD by targeting SORBS1 mRNA. (a) Western blot analysis of SORBS1 was used to evaluate the transfection efficiency of A549 and PC9 cells undergoing transfection with miR-3646 mimic (mimic group), OE-SORBS1 (OE), miR-3646 mimic plus OE-SORBS1 (mimic+OE) or negative control (NC), with GADPH as the internal control. Blank group indicated untreated cells. (b) The cell viability of the transfected A549 and PC9 cells was measured by CCK-8 assay. (c) The proliferation of the transfected A549 and PC9 cells was measured by BrdU incorporation assay. (d) Cell-matrix adhesion assay was used to determine the adhesion ability of transfected A549 and PC9 cells. (e) Caspase-3 activity assay was conducted to measure A549 and PC9 cell apoptosis. (f) Western blots analysis of Bcl-2 and Bax protein levels in A549 and PC9 cells. (The error bars were derived from 3 independent parallel experiments). (g) Western blots analysis of p-JNK and JNK. The error bars were derived from 3 independent parallel experiments. *P < 0.05, **P < 0.001, compared with blank group; ##P < 0.001, compared with OE-SORBS1 group.