 Explore
 Validate
 Learn
Learn Western blot
 Immunocytochemistry
Antibody data
- Antibody Data
- Antigen structure
- References [0]
- Comments [0]
- Validations
- Immunocytochemistry [2]
- Immunohistochemistry [3]
- Flow cytometry [1]
- Chromatin Immunoprecipitation [2]
- Other assay [3]
Submit
Validation data
Reference
Comment
Report error
- Product number
- 700712 - Provider product page

- Provider
- Invitrogen Antibodies
- Product name
- LC3B Recombinant Rabbit Monoclonal Antibody (2H30L32)
- Antibody type
- Monoclonal
- Antigen
- Recombinant full-length protein
- Description
- This antibody is predicted to react with mouse based on sequence homology. Intact IgG appears on a non-reducing gel as ~150 kDa band and upon reduction generating a ~25 kDa light chain band and a ~50 kDa heavy chain. Recombinant rabbit monoclonal antibodies are produced using in vitro expression systems. The expression systems are developed by cloning in the specific antibody DNA sequences from immunoreactive rabbits. Then, individual clones are screened to select the best candidates for production. The advantages of using recombinant rabbit monoclonal antibodies include: better specificity and sensitivity, lot-to-lot consistency, animal origin-free formulations, and broader immunoreactivity to diverse targets due to larger rabbit immune repertoire.
- Reactivity
- Human, Mouse, Rat
- Host
- Rabbit
- Isotype
- IgG
- Antibody clone number
- 2H30L32
- Vial size
- 100 μg
- Concentration
- 0.5 mg/mL
- Storage
- Store at 4°C short term. For long term storage, store at -20°C, avoiding freeze/thaw cycles.
No comments: Submit comment
Supportive validation
- Submitted by
- Invitrogen Antibodies (provider)
- Main image
- Experimental details
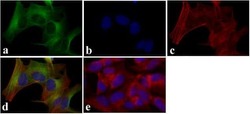
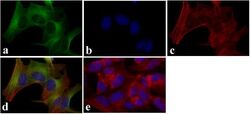
- Immunofluorescent analysis of LC3B was done on 70% confluent log phase SHSY5Y cells. The cells were fixed with 4% paraformaldehyde for 15 minutes, permeabilized with 0.25% Triton X-100 for 10 minutes, and blocked with 5% BSA for 1 hour at room temperature. The cells were labeled with LC3B Recombinant Rabbit Monoclonal Antibody (Product # 700712) at 2 µg/mL and incubated for 3 hours at room temperature and then labeled with Alexa Fluor 488 Goat anti-Rabbit IgG Secondary Antibody (Product # A-11008) at a dilution of 1:400 for 30 minutes at room temperature (Panel a: green). Nuclei (Panel b: blue) were stained with SlowFade® Gold Antifade Mountant with DAPI (Product # S36938). F-actin (Panel c: red) was stained with Alexa Fluor 594 Phalloidin (Product # A12381). Panel d is a merged image showing cytoplasmic localization. Panel e shows no primary antibody control. The images were captured at 20X magnification.
- Submitted by
- Invitrogen Antibodies (provider)
- Main image
- Experimental details
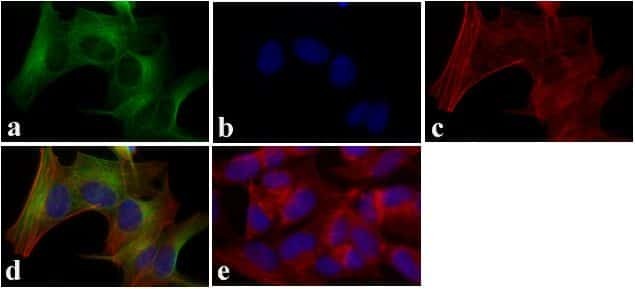
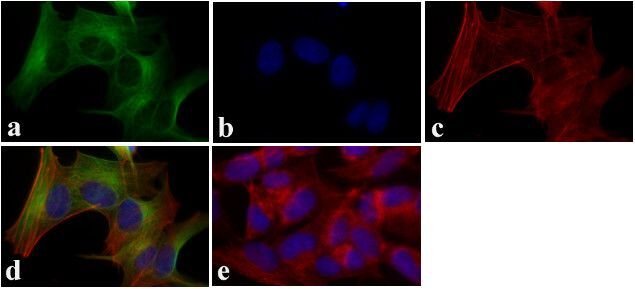
- Immunofluorescent analysis of LC3B was done on 70% confluent log phase SHSY5Y cells. The cells were fixed with 4% paraformaldehyde for 15 minutes, permeabilized with 0.25% Triton X-100 for 10 minutes, and blocked with 5% BSA for 1 hour at room temperature. The cells were labeled with LC3B Recombinant Rabbit Monoclonal Antibody (Product # 700712) at 2 µg/mL and incubated for 3 hours at room temperature and then labeled with Alexa Fluor 488 Goat anti-Rabbit IgG Secondary Antibody (Product # A-11008) at a dilution of 1:400 for 30 minutes at room temperature (Panel a: green). Nuclei (Panel b: blue) were stained with SlowFade® Gold Antifade Mountant with DAPI (Product # S36938). F-actin (Panel c: red) was stained with Alexa Fluor 594 Phalloidin (Product # A12381). Panel d is a merged image showing cytoplasmic localization. Panel e shows no primary antibody control. The images were captured at 20X magnification.
Supportive validation
- Submitted by
- Invitrogen Antibodies (provider)
- Main image

- Experimental details
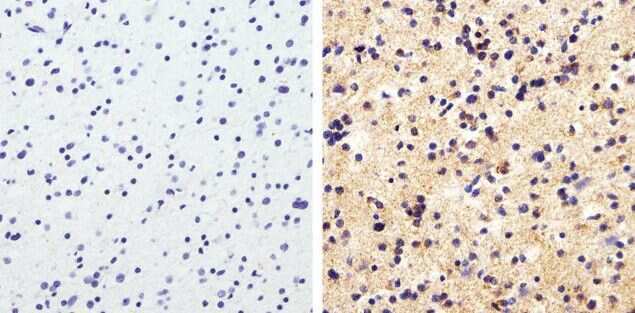
- Immunohistochemistry analysis of MAP1LC3B showing staining in the cytoplasm of paraffin-embedded human astroglioma (right) compared to a negative control without primary antibody (left). To expose target proteins, antigen retrieval was performed using 10 mM sodium citrate (pH 6.0), microwaved for 8-15 min. Following antigen retrieval, tissues were blocked in 3% H2O2-methanol for 15 min at room temperature, washed with ddH2O and PBS, and then probed with MAP1LC3B (2H30L32) Monoclonal antibody (Product # 700712) diluted in 3% BSA-PBS at a dilution of 1:50 overnight at 4°C in a humidified chamber. Tissues were washed extensively in PBST and detection was performed using a HRP-conjugated secondary antibody followed by colorimetric detection using a DAB kit. Tissues were counterstained with hematoxylin and dehydrated with ethanol and xylene to prep for mounting.
- Submitted by
- Invitrogen Antibodies (provider)
- Main image
- Experimental details
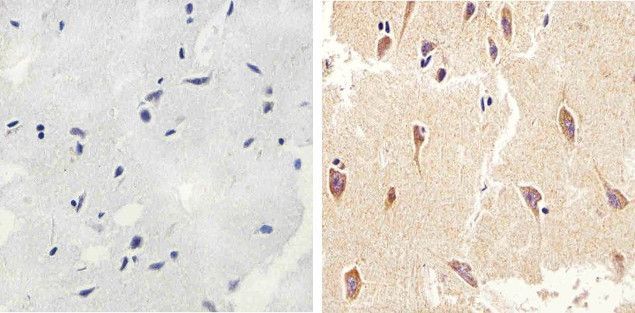
- Immunohistochemistry analysis of MAP1LC3B showing staining in the cytoplasm of paraffin-embedded human brain tissue (right) compared to a negative control without primary antibody (left). To expose target proteins, antigen retrieval was performed using 10 mM sodium citrate (pH 6.0), microwaved for 8-15 min. Following antigen retrieval, tissues were blocked in 3% H2O2-methanol for 15 min at room temperature, washed with ddH2O and PBS, and then probed with MAP1LC3B (2H30L32) Monoclonal antibody (Product # 700712) diluted in 3% BSA-PBS at a dilution of 1:50 overnight at 4°C in a humidified chamber. Tissues were washed extensively in PBST and detection was performed using a HRP-conjugated secondary antibody followed by colorimetric detection using a DAB kit. Tissues were counterstained with hematoxylin and dehydrated with ethanol and xylene to prep for mounting.
- Submitted by
- Invitrogen Antibodies (provider)
- Main image
- Experimental details
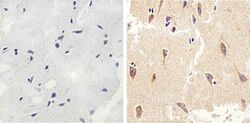
- Immunohistochemistry analysis of MAP1LC3B showing staining in the cytoplasm of paraffin-embedded rat brain tissue (right) compared to a negative control without primary antibody (left). To expose target proteins, antigen retrieval was performed using 10 mM sodium citrate (pH 6.0), microwaved for 8-15 min. Following antigen retrieval, tissues were blocked in 3% H2O2-methanol for 15 min at room temperature, washed with ddH2O and PBS, and then probed with MAP1LC3B (2H30L32) Monoclonal antibody (Product # 700712) diluted in 3% BSA-PBS at a dilution of 1:100 overnight at 4°C in a humidified chamber. Tissues were washed extensively in PBST and detection was performed using a HRP-conjugated secondary antibody followed by colorimetric detection using a DAB kit. Tissues were counterstained with hematoxylin and dehydrated with ethanol and xylene to prep for mounting.

Supportive validation
- Submitted by
- Invitrogen Antibodies (provider)
- Main image
- Experimental details
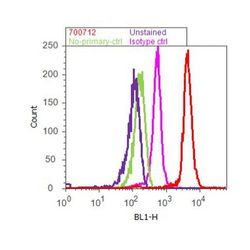
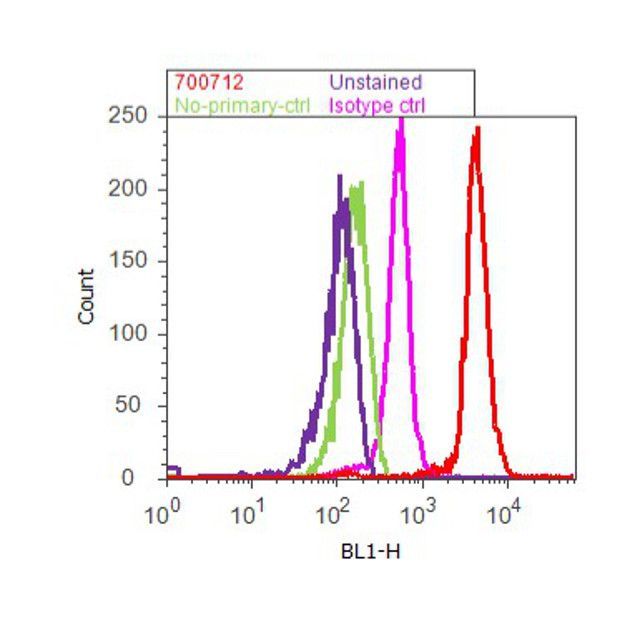
- Flow cytometry analysis of LC3B was done on SH-SY5Y cells. Cells were fixed with 70% ethanol for 10 minutes, permeabilized with 0.25% Triton™ X-100 for 20 minutes, and blocked with 5% BSA for 30 minutes at room temperature. Cells were labeled with ABfinity™ LC3B Recombinant Rabbit Monoclonal Antibody (700712, red histogram) or with rabbit isotype control (pink histogram) at 3-5 µg/million cells in 2.5% BSA. After incubation at room temperature for 2 hours, the cells were labeled with Alexa Fluor® 488 Goat Anti-Rabbit Secondary Antibody (A11008) at a dilution of 1:400 for 30 minutes at room temperature. The representative 10,000 cells were acquired and analyzed for each sample using an Attune® Acoustic Focusing Cytometer. The purple histogram represents unstained control cells and the green histogram represents no-primary-antibody control.
Supportive validation
- Submitted by
- Invitrogen Antibodies (provider)
- Main image
- Experimental details
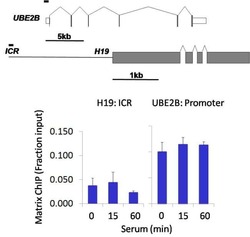
- Chromatin immunoprecipitation analysis of MAP1LC3B was performed using cross-linked chromatin from 1 x 10^6 HCT116 human colon carcinoma cells treated with serum for 0, 15, and 60 minutes. Immunoprecipitation was performed using a multiplex microplate Matrix ChIP assay (see reference for Matrix ChIP protocol: http://www.ncbi.nlm.nih.gov/pubmed/22098709) with 1.0 µL/100 µL well volume of a MAP1LC3B rabbit monoclonal antibody (Product # 700712). Chromatin aliquots from ~1 x 10^5 cells were used per ChIP pull-down. Quantitative PCR data were done in quadruplicate using 1 µL of eluted DNA in 2 µL SYBR real-time PCR reactions containing primers to amplify the promoter region of human UBE2B, or the imprinting control region (ICR) of the human H19 locus. PCR calibration curves were generated for each primer pair from a dilution series of sheared total genomic DNA. Quantitation of immunoprecipitated chromatin is presented as signal relative to the total amount of input chromatin. Results represent the mean +/- SEM for three experiments. A schematic representation of the human UBE2B and H19 loci are shown above the data where boxes represent exons (grey boxes = translated regions, white boxes = untranslated regions), the zigzag lines represent introns, and the straight line represents upstream sequence. Regions amplified by UBE2B and H19 primers are represented by black bars. Data courtesy of the Innovators Program.

- Submitted by
- Invitrogen Antibodies (provider)
- Main image

- Experimental details
- Chromatin immunoprecipitation analysis of MAP1LC3B was performed using cross-linked chromatin from 1 x 10^6 HCT116 human colon carcinoma cells treated with serum for 0, 15, and 60 minutes. Immunoprecipitation was performed using a multiplex microplate Matrix ChIP assay (see reference for Matrix ChIP protocol: http://www.ncbi.nlm.nih.gov/pubmed/22098709) with 1.0 µL/100 µL well volume of a MAP1LC3B rabbit monoclonal antibody (Product # 700712). Chromatin aliquots from ~1 x 10^5 cells were used per ChIP pull-down. Quantitative PCR data were done in quadruplicate using 1 µL of eluted DNA in 2 µL SYBR real-time PCR reactions containing primers to amplify the promoter region of human UBE2B, or the imprinting control region (ICR) of the human H19 locus. PCR calibration curves were generated for each primer pair from a dilution series of sheared total genomic DNA. Quantitation of immunoprecipitated chromatin is presented as signal relative to the total amount of input chromatin. Results represent the mean +/- SEM for three experiments. A schematic representation of the human UBE2B and H19 loci are shown above the data where boxes represent exons (grey boxes = translated regions, white boxes = untranslated regions), the zigzag lines represent introns, and the straight line represents upstream sequence. Regions amplified by UBE2B and H19 primers are represented by black bars. Data courtesy of the Innovators Program.

Supportive validation
- Submitted by
- Invitrogen Antibodies (provider)
- Main image

- Experimental details
- NULL
- Submitted by
- Invitrogen Antibodies (provider)
- Main image
- Experimental details
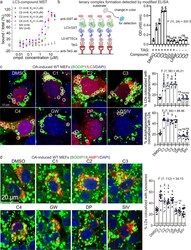
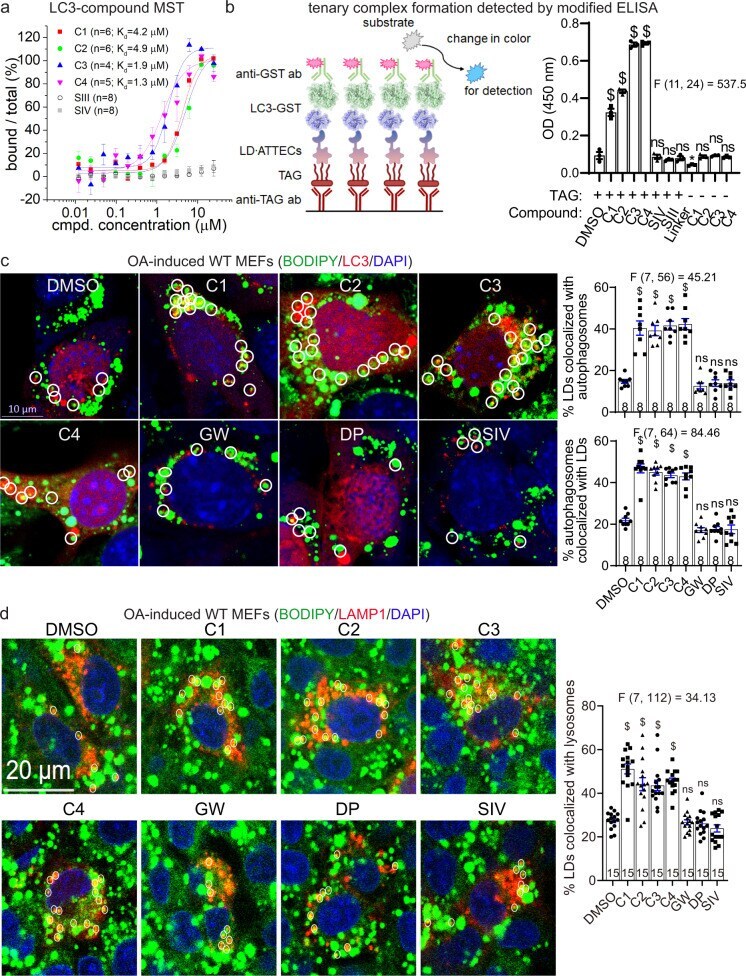
- Fig. 4 Formation of the LC3B-ATTEC-LD ternary complex and colocalization between LC3B and LD. a Measurements of the C1-LC3B, C2-LC3B, C3-LC3B, C4-LC3B, SIII-LC3B and SIV-LC3B binding affinity by MST. Submicromolar to micromolar K d values were observed for the interaction between LC3B and LD*ATTECs (C1-C4), but not LD probes (SIII and SIV). b Left: schematic illustration of the measurements of the ternary complex formation using modified ELISA assays; Right: the blank-corrected ELISA signals of the indicated samples ( n = 3, independent assay wells). All samples were added with recombinant purified LC3-GST for the final detection with the GST antibody, and the wells containing recombinant purified GST alone were used as the blank control. c Representative images and quantifications of mCherry-LC3B-transfected MEFs showing LDs (stained with BODIPY 493/503, green), autophagosomes (LC3B puncta, red) and nuclei (DAPI, blue). LD*ATTECs (C1-C4) but not the control compounds (all at 5 muM) induced significant partial colocalizations of LD and autophagosomes. The percentage of LDs that are partially colocalized with autophagosomes in each sample was analyzed by visual counting in a blinded manner. The replicate number indicates the number of fields from 2 independent batches of transfections. d Similar to c , but in LAMP1-mCherry-transfected MEFs showing colocalization between LDs and lysosomes (LAMP1). Bars indicate means +- SEM. ns, P > 0.05; $ P < 0.0001 by one-way ANOVA (the F an
- Submitted by
- Invitrogen Antibodies (provider)
- Main image
- Experimental details
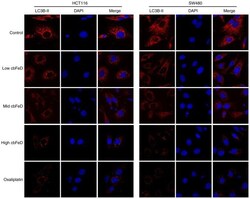
- Figure 5 Immunofluorescence images of LC3B-II in HCT116 and SW480 cells. Cells were treated with cb FeD-containing serum solutions prepared from mice treated by gastrogavage with saline (control), or 5 (low), 10 (mid) or 20 (high) g/kg of cb FeD, followed by immunofluorescence staining of LC3B-II (magnification, x200). Red, LC3B-II; blue, DAPI; Merge, LC3B-II+DAPI. cb FeD, Codonopis bulleynana Forest ex Diels; LC3, LC3, microtubule-associated protein 1 light chain 3.
