Explore
 Validate
 Learn
Learn Western blot
 Immunohistochemistry
Antibody data
- Antibody Data
- Antigen structure
- References [1]
- Comments [0]
- Validations
- Immunohistochemistry [2]
- Other assay [1]
Submit
Validation data
Reference
Comment
Report error
- Product number
- PA5-47913 - Provider product page

- Provider
- Invitrogen Antibodies
- Product name
- GKN1 Polyclonal Antibody
- Antibody type
- Polyclonal
- Antigen
- Recombinant full-length protein
- Description
- In direct ELISAs, approximately 10% cross-reactivity with recombinant human Gastrokine 1 is observed. Reconstitute in sterile PBS to a final concentration of 0.2 mg/mL.
- Reactivity
- Human, Mouse
- Host
- Sheep
- Isotype
- IgG
- Vial size
- 100 μg
- Concentration
- 0.2 mg/mL
- Storage
- -20°C, Avoid Freeze/Thaw Cycles
Submitted references Single-cell transcriptomes of pancreatic preinvasive lesions and cancer reveal acinar metaplastic cells' heterogeneity.
Schlesinger Y, Yosefov-Levi O, Kolodkin-Gal D, Granit RZ, Peters L, Kalifa R, Xia L, Nasereddin A, Shiff I, Amran O, Nevo Y, Elgavish S, Atlan K, Zamir G, Parnas O
Nature communications 2020 Sep 9;11(1):4516
Nature communications 2020 Sep 9;11(1):4516
No comments: Submit comment
Supportive validation
- Submitted by
- Invitrogen Antibodies (provider)
- Main image
- Experimental details
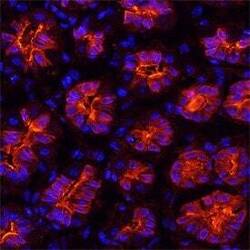
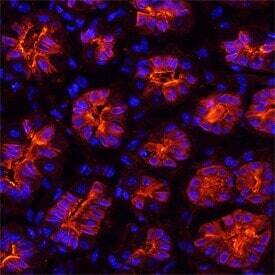
- Immunohistochemical analysis of GKN1 in perfusion fixed frozen sections of mouse stomach. Samples were incubated with GKN1 polyclonal antibody (Product # PA5-47913) using a dilution of 15 µg/mL overnight at 4 °C followed by NorthernLights™ 557-conjugated Anti-Sheep IgG Secondary Antibody (red) and counterstained with DAPI (blue). Specific staining was localized to islets.
- Submitted by
- Invitrogen Antibodies (provider)
- Main image

- Experimental details
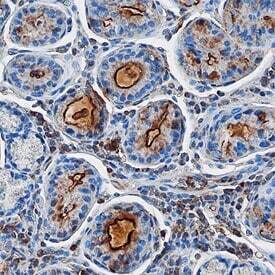
- Immunohistochemical analysis of GKN1 in immersion fixed paraffin-embedded sections of human stomach. Samples were incubated in GKN1 polyclonal antibody (Product # PA5-47913) using a dilution of 10 µg/mL overnight at 4 °C. Before incubation with the primary antibody, tissue was subjected to heat-induced epitope retrieval using Antigen Retrieval Reagent-Basic. Tissue was stained using the Anti-Sheep HRP-DAB Cell & Tissue Staining Kit (brown) and counterstained with hematoxylin (blue). Specific staining was localized to islets.
Supportive validation
- Submitted by
- Invitrogen Antibodies (provider)
- Main image
- Experimental details
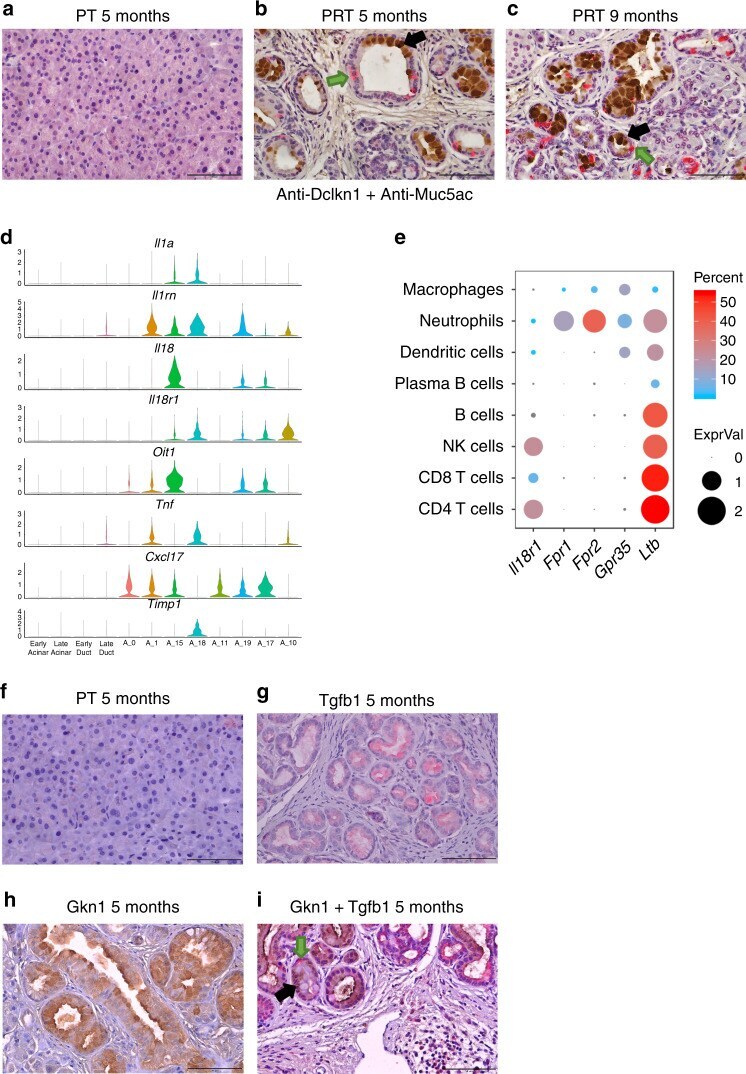
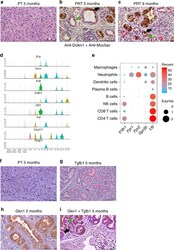
- Fig. 5 Potential metaplastic cell-cell interactions and co-localization of different metaplastic cell types to the same PanINs. a - c Immunostaining of histological sections with anti-Dclk1 (red) and anti-Muc5ac (brown) antibodies. Arrows mark representative cells in the PanINs that stained positive with anti-Dclk1 (green arrow) or with anti-Muc5ac (black arrow). a Section taken from control, 5 months PT mouse, b section taken from 5 months PRT mouse, c section taken from 9 months PRT mouse. Scale bars 100 um. d Violin plot showing the expression level (normalized expression) of a selected set of secreted molecules and receptors. On the x -axis: Early acinar/ductal cells (control, 17 days and 6 weeks PTI samples), late (all other time points), and clusters of metaplastic cells. e Dot plot showing the expression of a set of receptors ( x -axis) across the different subset of immune cells ( y -axis). Immune cells subtypes are determined based on data presented in Fig. 7 . The average expression level is shown by the size of the dot and the percentage of cells is indicated by the color. f , i Immunostaining of histological sections of the pancreas, double stain with anti-Tgfb1 (red) and with anti-Gkn1 (brown), representative cell marked with arrows, anti-Tgfb1 (green arrow), and anti-Gkn1 (black arrow), f control, 5 months PT mouse, i 5 months PRT mouse. g 5 months PRT mouse section, stained with anti-Tgfb1, h 5 months PRT mouse section, stained with anti-Gkn1. i . Scale bars 10