Explore
 Validate
 Learn
Learn Western blot
 Immunocytochemistry
Antibody data
- Antibody Data
- Antigen structure
- References [1]
- Comments [0]
- Validations
- Immunocytochemistry [1]
- Other assay [1]
Submit
Validation data
Reference
Comment
Report error
- Product number
- PA5-101901 - Provider product page

- Provider
- Invitrogen Antibodies
- Product name
- SLC8B1 Polyclonal Antibody
- Antibody type
- Polyclonal
- Antigen
- Synthetic peptide
- Description
- Antibody detects endogenous levels of total SLC24A6.
- Reactivity
- Human
- Host
- Rabbit
- Isotype
- IgG
- Vial size
- 100 μL
- Concentration
- 1 mg/mL
- Storage
- -20°C
Submitted references Calcium Signaling and Mitochondrial Function in Presenilin 2 Knock-Out Mice: Looking for Any Loss-of-Function Phenotype Related to Alzheimer's Disease.
Rossi A, Galla L, Gomiero C, Zentilin L, Giacca M, Giorgio V, Calì T, Pozzan T, Greotti E, Pizzo P
Cells 2021 Jan 21;10(2)
Cells 2021 Jan 21;10(2)
No comments: Submit comment
Supportive validation
- Submitted by
- Invitrogen Antibodies (provider)
- Main image
- Experimental details
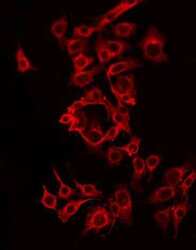
- Immunofluorescent analysis of SLC8B1 in MCF7. Samples were fixed with paraformaldehyde, permeabilized with 0.1% Triton X-100, blocked with 10% serum (45 min at 25°C) incubated with SLC8B1 polyclonal antibody (Product # PA5-101901) using a dilution of 1:200 (1 hr, 37°C), and followed by goat anti-rabbit IgG Alexa Fluor 594 at a dilution of 1:600.

Supportive validation
- Submitted by
- Invitrogen Antibodies (provider)
- Main image
- Experimental details
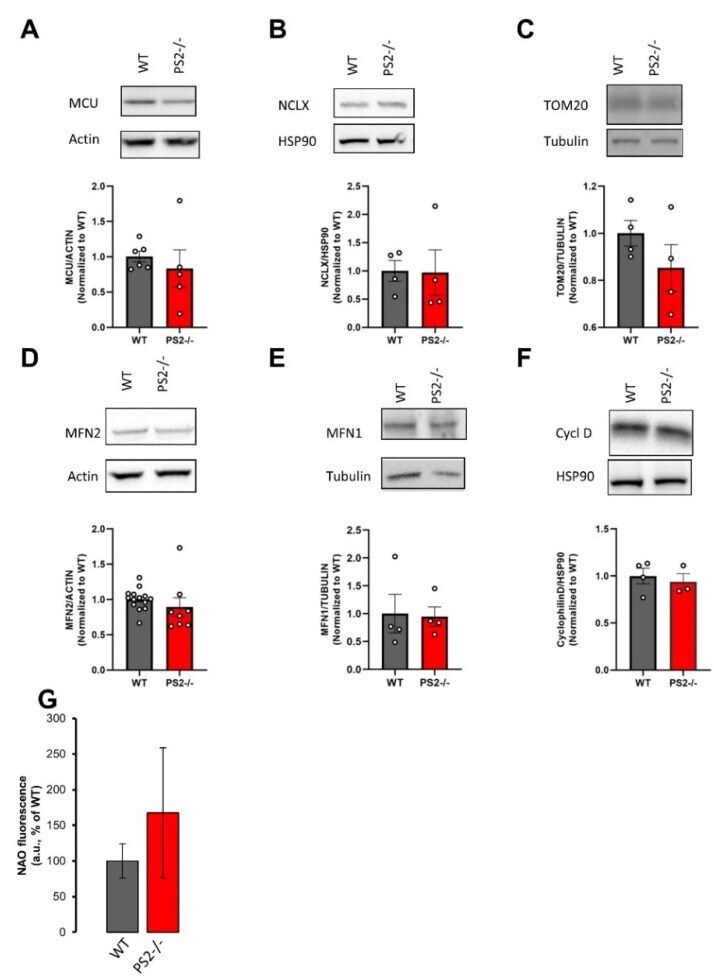
- Figure 3 The lack of PS2 does not affect the mitochondrial mass. Representative Western blots of different mitochondrial protein levels in WT and PS2-/- cortical neurons. Each sample was run in duplicate. The corresponding scatter plot represents the mean values +- SEM. Values were first normalized to their internal housekeeping proteins (as indicated) and then to those of WT samples. ( A - G ) Representative Western blot and quantification of: ( A ) mitochondrial Ca 2+ uniporter (MCU) protein levels of 6 independent cultures from WT mice and 5 independent cultures from PS2-/- mice; ( B ) NCLX protein levels of 4 independent cultures from WT mice and from PS2-/- mice; ( C ) TOM20 protein levels of 4 independent cultures from WT mice and from PS2-/- mice; ( D ) MFN2 protein levels of 14 independent cultures from WT mice and 8 independent cultures from PS2-/- mice; ( E ) MFN1 protein levels of 4 independent cultures from WT mice and from PS2-/- mice; ( F ) cyclophilin D (cycl D) protein levels of 4 independent cultures from WT mice and 3 independent cultures from PS2-/- mice. ( G ) The bar graph shows the mean values +- SEM of Nonyl Acridine Orange (NAO) fluorescence (arbitrary units) from 4 independent cultures from WT mice and 3 independent cultures from PS2-/- mice, as a percentage of WT.