 Explore
 Validate
 Learn
Learn14-0299-82
antibody from Invitrogen Antibodies
Targeting: ITGB1
CD29, FNRB, GPIIA, MDF2, MSK12
 Western blot
 Immunocytochemistry
 Immunoprecipitation Immunohistochemistry Flow cytometry Other assay
Antibody data
- Antibody Data
- Antigen structure
- References [19]
- Comments [0]
- Validations
- Immunocytochemistry [2]
- Flow cytometry [2]
- Other assay [16]
Submit
Validation data
Reference
Comment
Report error
- Product number
- 14-0299-82 - Provider product page

- Provider
- Invitrogen Antibodies
- Product name
- CD29 (Integrin beta 1) Monoclonal Antibody (TS2/16), eBioscience™
- Antibody type
- Monoclonal
- Antigen
- Other
- Description
- Description: The TS2/16 monoclonal antibody reacts with human CD29, also known as integrin beta 1, an approximately 130 kDa single-pass transmembrane glycoprotein. CD29 complexes with one of nine integrin alpha subunits to form the very late antigen (VLA) subfamily of adhesion molecules. Integrin heterodimers containing CD29 are involved in cell-cell and cell-matrix adhesion. CD29 is expressed broadly on lymphocytes and monocytes, with lower levels of expression on granulocytes. The TS2/16 antibody has been found to possess activating activity for beta 1 integrins. Applications Reported: This TS2/16 antibody has been reported for use in flow cytometric analysis, immunoprecipitation, and immunohistochemical staining. Applications Tested: This TS2/16 antibody has been tested by flow cytometric analysis of normal human peripheral blood cells. This can be used at less than or equal to 0.25 µg per test. A test is defined as the amount (µg) of antibody that will stain a cell sample in a final volume of 100 µL. Cell number should be determined empirically but can range from 10^5 to 10^8 cells/test. It is recommended that the antibody be carefully titrated for optimal performance in the assay of interest. Purity: Greater than 90%, as determined by SDS-PAGE. Aggregation: Less than 10%, as determined by HPLC. Filtration: 0.2 µm post-manufacturing filtered.
- Reactivity
- Human
- Host
- Mouse
- Isotype
- IgG
- Antibody clone number
- TS2/16
- Vial size
- 100 μg
- Concentration
- 0.5 mg/mL
- Storage
- 4°C
Submitted references Impairment of the Retinal Endothelial Cell Barrier Induced by Long-Term Treatment with VEGF-A(165) No Longer Depends on the Growth Factor's Presence.
Beovu, but not Lucentis impairs the function of the barrier formed by retinal endothelial cells in vitro.
Photoreceptor protection by mesenchymal stem cell transplantation identifies exosomal MiR-21 as a therapeutic for retinal degeneration.
Integrin alpha-V is an important driver in pancreatic adenocarcinoma progression.
The proprotein convertase furin inhibits IL-13-induced inflammation in airway smooth muscle by regulating integrin-associated signaling complexes.
Sitagliptin and the Blood-Retina Barrier: Effects on Retinal Endothelial Cells Manifested Only after Prolonged Exposure.
Apoptotic bodies derived from mesenchymal stem cells promote cutaneous wound healing via regulating the functions of macrophages.
Myogenic Progenitor Cell Lineage Specification by CRISPR/Cas9-Based Transcriptional Activators.
Reparative effect of mesenchymal stromal cells on endothelial cells after hypoxic and inflammatory injury.
Accelerated Wound Healing by Fibroblasts Differentiated from Human Embryonic Stem Cell-Derived Mesenchymal Stem Cells in a Pressure Ulcer Animal Model.
The scaffold protein p140Cap limits ERBB2-mediated breast cancer progression interfering with Rac GTPase-controlled circuitries.
Human adipose-derived stem cells partially rescue the stroke syndromes by promoting spatial learning and memory in mouse middle cerebral artery occlusion model.
Tumor-penetrating iRGD peptide inhibits metastasis.
PDGFR-β (+) perivascular cells from infantile hemangioma display the features of mesenchymal stem cells and show stronger adipogenic potential in vitro and in vivo.
Annexin A2 regulates β1 integrin internalization and intestinal epithelial cell migration.
GATA3 suppresses metastasis and modulates the tumour microenvironment by regulating microRNA-29b expression.
GMP-compliant isolation and large-scale expansion of bone marrow-derived MSC.
Sequential regulation of alpha 4 beta 1 and alpha 5 beta 1 integrin avidity by CC chemokines in monocytes: implications for transendothelial chemotaxis.
Glycoproteins of 210,000 and 130,000 m.w. on activated T cells: cell distribution and antigenic relation to components on resting cells and T cell lines.
Deissler HL, Rehak M, Wolf A
Biomolecules 2022 May 23;12(5)
Biomolecules 2022 May 23;12(5)
Beovu, but not Lucentis impairs the function of the barrier formed by retinal endothelial cells in vitro.
Deissler HL, Busch C, Wolf A, Rehak M
Scientific reports 2022 Jul 21;12(1):12493
Scientific reports 2022 Jul 21;12(1):12493
Photoreceptor protection by mesenchymal stem cell transplantation identifies exosomal MiR-21 as a therapeutic for retinal degeneration.
Deng CL, Hu CB, Ling ST, Zhao N, Bao LH, Zhou F, Xiong YC, Chen T, Sui BD, Yu XR, Hu CH
Cell death and differentiation 2021 Mar;28(3):1041-1061
Cell death and differentiation 2021 Mar;28(3):1041-1061
Integrin alpha-V is an important driver in pancreatic adenocarcinoma progression.
Kemper M, Schiecke A, Maar H, Nikulin S, Poloznikov A, Galatenko V, Tachezy M, Gebauer F, Lange T, Riecken K, Tonevitsky A, Aigner A, Izbicki J, Schumacher U, Wicklein D
Journal of experimental & clinical cancer research : CR 2021 Jun 26;40(1):214
Journal of experimental & clinical cancer research : CR 2021 Jun 26;40(1):214
The proprotein convertase furin inhibits IL-13-induced inflammation in airway smooth muscle by regulating integrin-associated signaling complexes.
Wu Y, Huang Y, Zhang W, Gunst SJ
American journal of physiology. Lung cellular and molecular physiology 2021 Jul 1;321(1):L102-L115
American journal of physiology. Lung cellular and molecular physiology 2021 Jul 1;321(1):L102-L115
Sitagliptin and the Blood-Retina Barrier: Effects on Retinal Endothelial Cells Manifested Only after Prolonged Exposure.
Jäckle A, Ziemssen F, Kuhn EM, Kampmeier J, Lang GK, Lang GE, Deissler H, Deissler HL
Journal of diabetes research 2020;2020:2450781
Journal of diabetes research 2020;2020:2450781
Apoptotic bodies derived from mesenchymal stem cells promote cutaneous wound healing via regulating the functions of macrophages.
Liu J, Qiu X, Lv Y, Zheng C, Dong Y, Dou G, Zhu B, Liu A, Wang W, Zhou J, Liu S, Liu S, Gao B, Jin Y
Stem cell research & therapy 2020 Nov 27;11(1):507
Stem cell research & therapy 2020 Nov 27;11(1):507
Myogenic Progenitor Cell Lineage Specification by CRISPR/Cas9-Based Transcriptional Activators.
Kwon JB, Vankara A, Ettyreddy AR, Bohning JD, Gersbach CA
Stem cell reports 2020 May 12;14(5):755-769
Stem cell reports 2020 May 12;14(5):755-769
Reparative effect of mesenchymal stromal cells on endothelial cells after hypoxic and inflammatory injury.
Sierra-Parraga JM, Merino A, Eijken M, Leuvenink H, Ploeg R, Møller BK, Jespersen B, Baan CC, Hoogduijn MJ
Stem cell research & therapy 2020 Aug 12;11(1):352
Stem cell research & therapy 2020 Aug 12;11(1):352
Accelerated Wound Healing by Fibroblasts Differentiated from Human Embryonic Stem Cell-Derived Mesenchymal Stem Cells in a Pressure Ulcer Animal Model.
Yoon D, Yoon D, Sim H, Hwang I, Lee JS, Chun W
Stem cells international 2018;2018:4789568
Stem cells international 2018;2018:4789568
The scaffold protein p140Cap limits ERBB2-mediated breast cancer progression interfering with Rac GTPase-controlled circuitries.
Grasso S, Chapelle J, Salemme V, Aramu S, Russo I, Vitale N, Verdun di Cantogno L, Dallaglio K, Castellano I, Amici A, Centonze G, Sharma N, Lunardi S, Cabodi S, Cavallo F, Lamolinara A, Stramucci L, Moiso E, Provero P, Albini A, Sapino A, Staaf J, Di Fiore PP, Bertalot G, Pece S, Tosoni D, Confalonieri S, Iezzi M, Di Stefano P, Turco E, Defilippi P
Nature communications 2017 Mar 16;8:14797
Nature communications 2017 Mar 16;8:14797
Human adipose-derived stem cells partially rescue the stroke syndromes by promoting spatial learning and memory in mouse middle cerebral artery occlusion model.
Zhou F, Gao S, Wang L, Sun C, Chen L, Yuan P, Zhao H, Yi Y, Qin Y, Dong Z, Cao L, Ren H, Zhu L, Li Q, Lu B, Liang A, Xu GT, Zhu H, Gao Z, Ma J, Xu J, Chen X
Stem cell research & therapy 2015 May 9;6(1):92
Stem cell research & therapy 2015 May 9;6(1):92
Tumor-penetrating iRGD peptide inhibits metastasis.
Sugahara KN, Braun GB, de Mendoza TH, Kotamraju VR, French RP, Lowy AM, Teesalu T, Ruoslahti E
Molecular cancer therapeutics 2015 Jan;14(1):120-8
Molecular cancer therapeutics 2015 Jan;14(1):120-8
PDGFR-β (+) perivascular cells from infantile hemangioma display the features of mesenchymal stem cells and show stronger adipogenic potential in vitro and in vivo.
Yuan SM, Guo Y, Zhou XJ, Shen WM, Chen HN
International journal of clinical and experimental pathology 2014;7(6):2861-70
International journal of clinical and experimental pathology 2014;7(6):2861-70
Annexin A2 regulates β1 integrin internalization and intestinal epithelial cell migration.
Rankin CR, Hilgarth RS, Leoni G, Kwon M, Den Beste KA, Parkos CA, Nusrat A
The Journal of biological chemistry 2013 May 24;288(21):15229-39
The Journal of biological chemistry 2013 May 24;288(21):15229-39
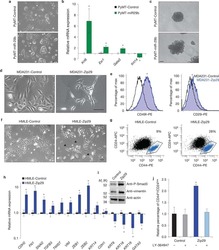
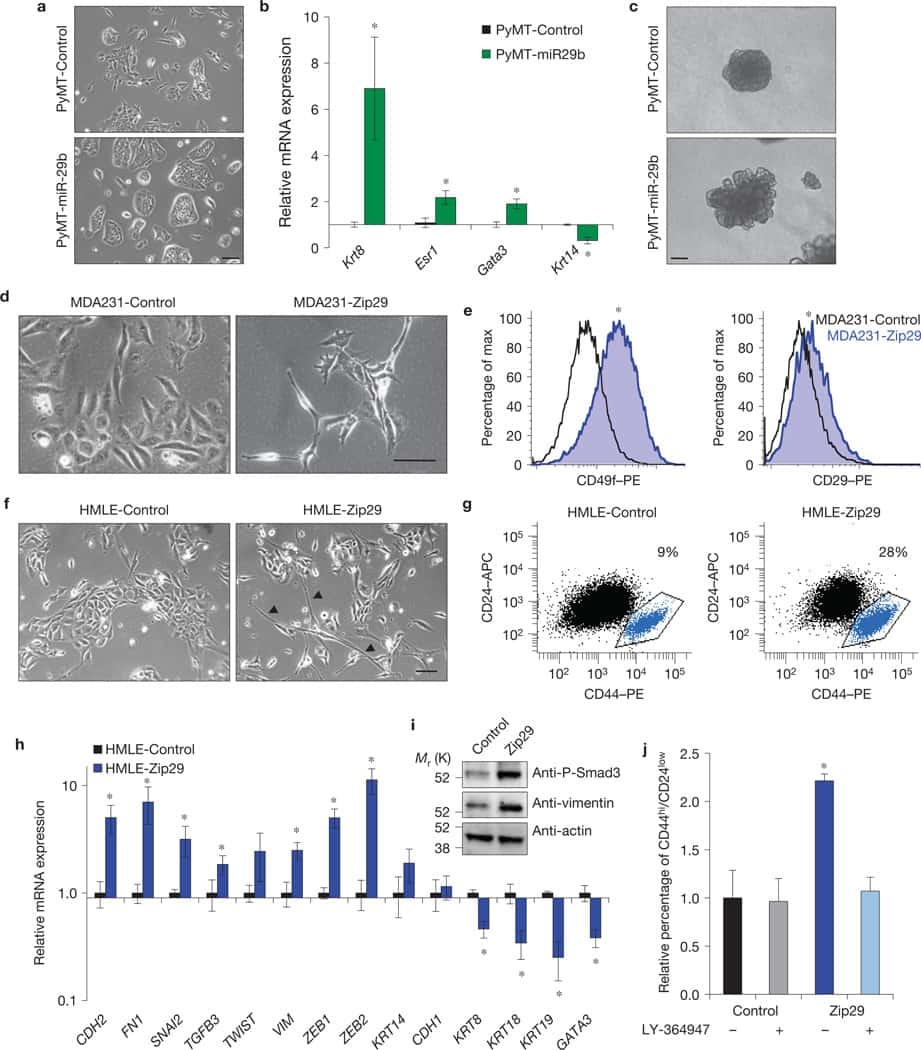
GATA3 suppresses metastasis and modulates the tumour microenvironment by regulating microRNA-29b expression.
Chou J, Lin JH, Brenot A, Kim JW, Provot S, Werb Z
Nature cell biology 2013 Feb;15(2):201-13
Nature cell biology 2013 Feb;15(2):201-13
GMP-compliant isolation and large-scale expansion of bone marrow-derived MSC.
Fekete N, Rojewski MT, Fürst D, Kreja L, Ignatius A, Dausend J, Schrezenmeier H
PloS one 2012;7(8):e43255
PloS one 2012;7(8):e43255
Sequential regulation of alpha 4 beta 1 and alpha 5 beta 1 integrin avidity by CC chemokines in monocytes: implications for transendothelial chemotaxis.
Weber C, Alon R, Moser B, Springer TA
The Journal of cell biology 1996 Aug;134(4):1063-73
The Journal of cell biology 1996 Aug;134(4):1063-73
Glycoproteins of 210,000 and 130,000 m.w. on activated T cells: cell distribution and antigenic relation to components on resting cells and T cell lines.
Hemler ME, Sanchez-Madrid F, Flotte TJ, Krensky AM, Burakoff SJ, Bhan AK, Springer TA, Strominger JL
Journal of immunology (Baltimore, Md. : 1950) 1984 Jun;132(6):3011-8
Journal of immunology (Baltimore, Md. : 1950) 1984 Jun;132(6):3011-8
No comments: Submit comment
Supportive validation
- Submitted by
- Invitrogen Antibodies (provider)
- Main image
- Experimental details
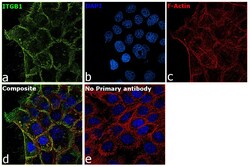
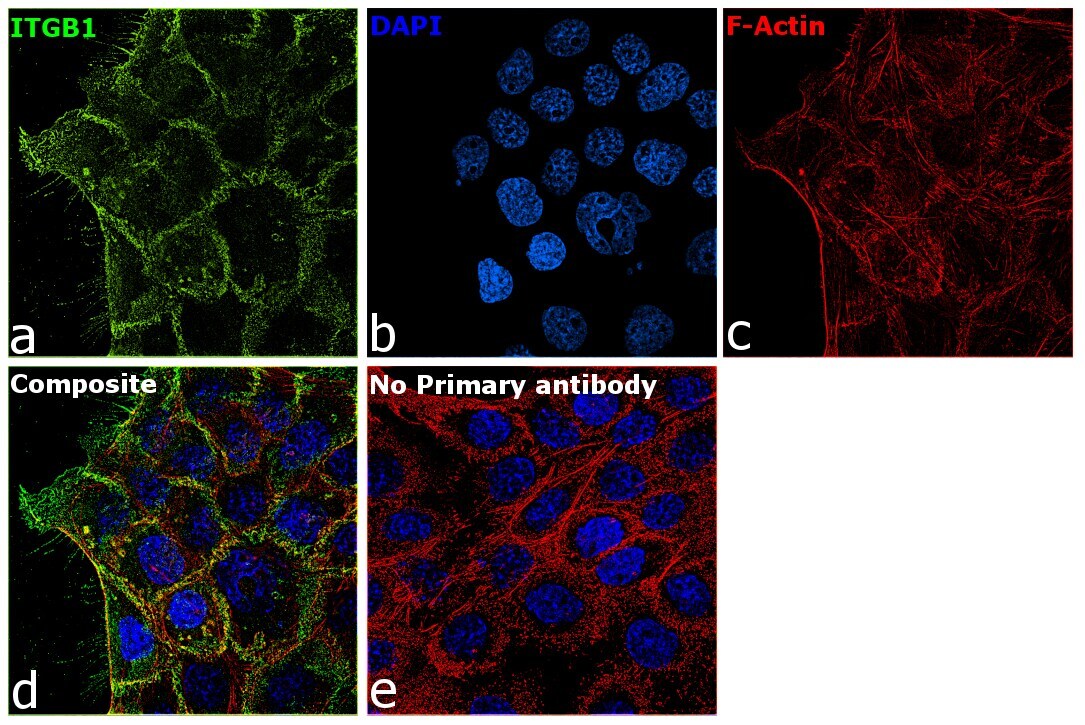
- Immunofluorescence analysis of CD29 (Integrin beta 1) was performed using 70% confluent log phase A-431 cells. The cells were fixed with 4% paraformaldehyde for 10 minutes, permeabilized with 0.1% Triton™ X-100 for 15 minutes, and blocked with 2% BSA for 45 minutes at room temperature. The cells were labeled with CD29 (Integrin beta 1) Monoclonal Antibody (TS2/16), eBioscience™ (Product # 14-0299-80) at 1:100 dilution in 0.1% BSA, incubated at 4 degree celsius overnight and then labeled with Donkey anti-Mouse IgG (H+L) Highly Cross-Adsorbed Secondary Antibody, Alexa Fluor Plus 488 (Product # A32766), (1:2000 dilution), for 45 minutes at room temperature (Panel a: Green). Nuclei (Panel b:Blue) were stained with ProLong™ Diamond Antifade Mountant with DAPI (Product # P36962). F-actin (Panel c: Red) was stained with Rhodamine Phalloidin (Product # R415, 1:300). Panel d represents the merged image showing Plasma membrane localization. Panel e represents control cells with no primary antibody to assess background. The images were captured at 60X magnification.
- Submitted by
- Invitrogen Antibodies (provider)
- Main image

- Experimental details
- Immunofluorescence analysis of CD29 (Integrin beta 1) was performed using 70% confluent log phase A-431 cells. The cells were fixed with 4% paraformaldehyde for 10 minutes, permeabilized with 0.1% Triton™ X-100 for 15 minutes, and blocked with 2% BSA for 45 minutes at room temperature. The cells were labeled with CD29 (Integrin beta 1) Monoclonal Antibody (TS2/16), eBioscience™ (Product # 14-0299-80) at 1:100 dilution in 0.1% BSA, incubated at 4 degree celsius overnight and then labeled with Donkey anti-Mouse IgG (H+L) Highly Cross-Adsorbed Secondary Antibody, Alexa Fluor Plus 488 (Product # A32766), (1:2000 dilution), for 45 minutes at room temperature (Panel a: Green). Nuclei (Panel b:Blue) were stained with ProLong™ Diamond Antifade Mountant with DAPI (Product # P36962). F-actin (Panel c: Red) was stained with Rhodamine Phalloidin (Product # R415, 1:300). Panel d represents the merged image showing Plasma membrane localization. Panel e represents control cells with no primary antibody to assess background. The images were captured at 60X magnification.

Supportive validation
- Submitted by
- Invitrogen Antibodies (provider)
- Main image
- Experimental details
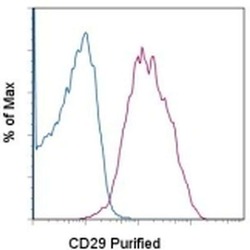
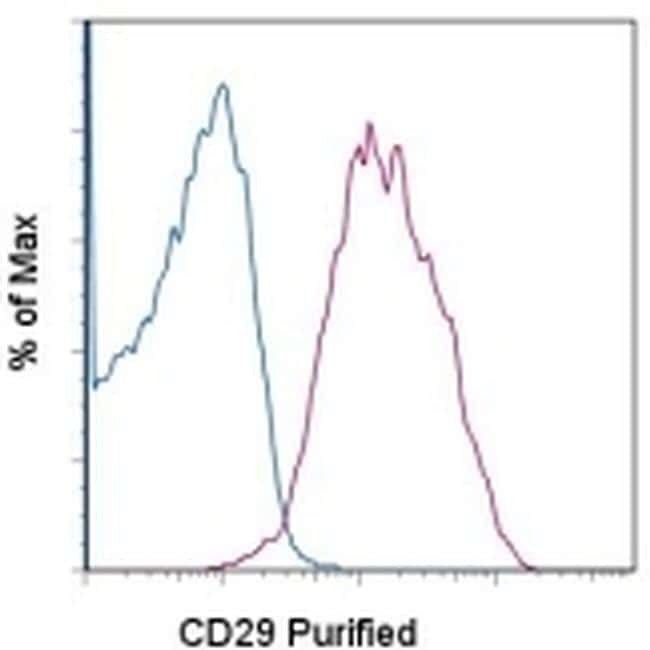
- Staining of normal human peripheral blood cells with 0.125 µg of Mouse IgG1 kappa Isotype Control Purified (Product # 14-4714-82) (blue histogram) or 0.125 µg of Anti-Human CD29 Purified (purple histogram) followed by F (ab')2 Anti-Mouse IgG PE (Product # 12-4012). Cells in the lymphocyte gate were used for analysis.
- Submitted by
- Invitrogen Antibodies (provider)
- Main image

- Experimental details
- Staining of normal human peripheral blood cells with 0.125 µg of Mouse IgG1 kappa Isotype Control Purified (Product # 14-4714-82) (blue histogram) or 0.125 µg of Anti-Human CD29 Purified (purple histogram) followed by F (ab')2 Anti-Mouse IgG PE (Product # 12-4012). Cells in the lymphocyte gate were used for analysis.

Supportive validation
- Submitted by
- Invitrogen Antibodies (provider)
- Main image
- Experimental details
- NULL

- Submitted by
- Invitrogen Antibodies (provider)
- Main image
- Experimental details
- NULL
- Submitted by
- Invitrogen Antibodies (provider)
- Main image
- Experimental details
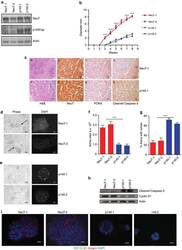
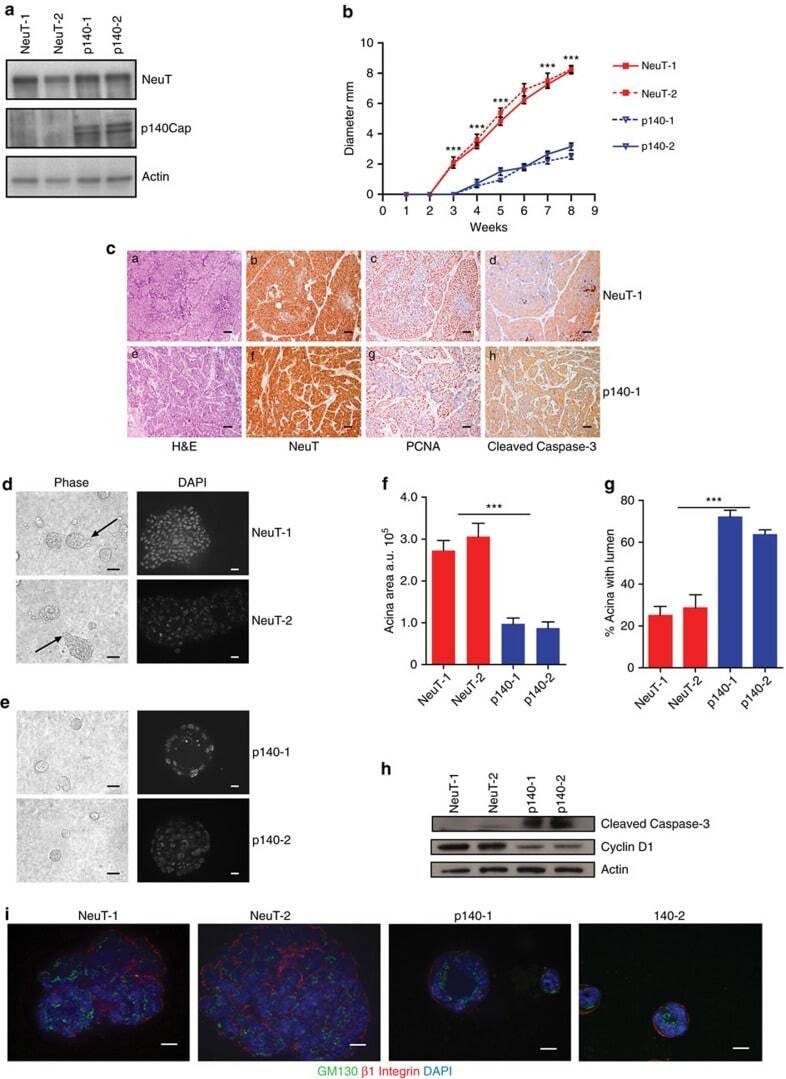
- Figure 4 Primary p140 cancer cells restore mammary epithelial acina morphogenesis in 3D Matrigel-Collagen cultures. ( a ) Protein extracts from two independent primary cancer cells for each genotype (NeuT-1, NeuT-2, p140-1 and p140-2) were run on 6% SDS-PAGE and stained with antibodies to NeuT, p140Cap and actin for loading control. ( b ) 10 6 cells as in a were injected in the left and right fat pads of nude mice. Tumour diameters were measured every week for 8 weeks. Two independent experiments were performed using five mice per group. Differences in tumour diameter were evaluated using two-way analysis of variance (ANOVA) followed by Bonferroni multiple comparison post hoc tests (*** P
- Submitted by
- Invitrogen Antibodies (provider)
- Main image
- Experimental details
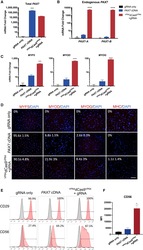
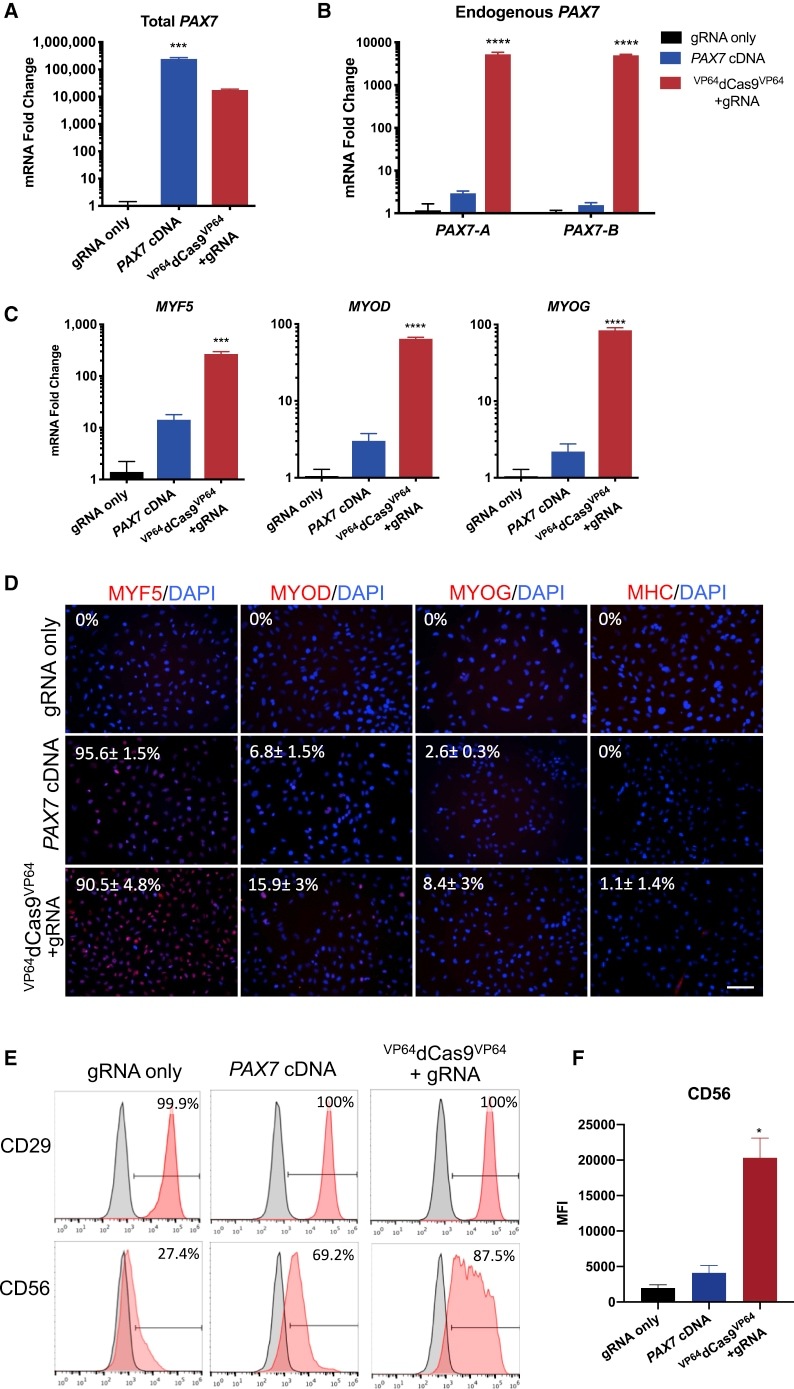
- Figure 2 Characterization of Myogenic Progenitors Derived from iPSCs via VP64 dCas9 VP64 -Mediated Activation of Endogenous PAX7 or Exogenous PAX7 cDNA Expression (A) Relative amounts of total PAX7 mRNA was determined by qRT-PCR using primers complementary to sequences present in the gene body. (B) Endogenous PAX7 mRNA was detected using primers complementary to sequences in the 3' UTR of either isoform PAX7-A or PAX7-B . (C) The mRNA expression levels of myogenic markers MYF5 , MYOD , and MYOG during the expansion phase. (D) Immunofluorescence staining of early and mature myogenic markers MYF5, MYOD, and MYOG, and myosin heavy chain (MHC). (E) Representative FACS analysis of CD29 and CD56 surface marker expression during the expansion phase. (F) Mean fluorescence intensity (MFI) of CD56 staining intensity across treatments. All p values were determined by one-way ANOVA followed by Tukey's post hoc test (mean +- SEM, n = 3 independent replicates).
- Submitted by
- Invitrogen Antibodies (provider)
- Main image
- Experimental details
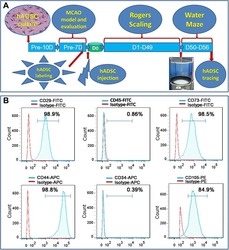
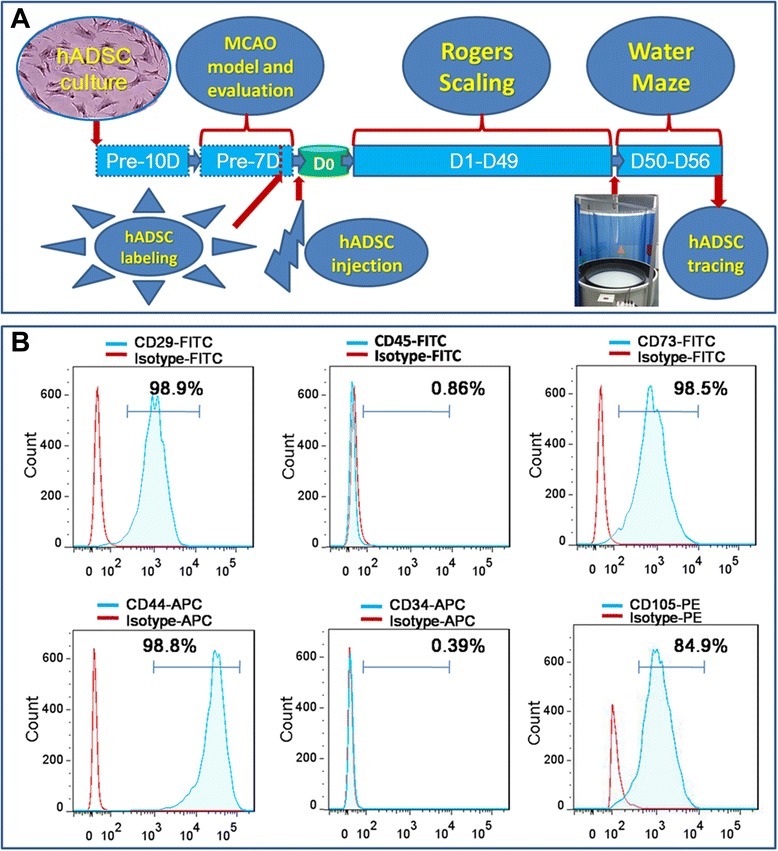
- Figure 1 Experimental diagram (A) , hADSC surface antigen profiling with FACS showed that hADSCs positively express CD29, CD44, CD73 and CD105, negatively express CD34 and CD45 (B) . FACS, flow activated cell sorting; hADSCs, human adipose-derived stem cells.
- Submitted by
- Invitrogen Antibodies (provider)
- Main image
- Experimental details
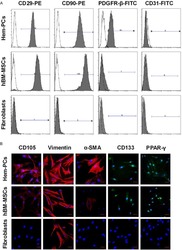
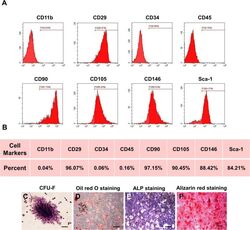
- Fig. 1 Characterization of murine BMMSCs. a , b Flow cytometric analysis of the surface markers showed positive expression of CD29, CD90, CD105, CD146, and Sca-1, and negative expression of hematopoietic markers CD11b, CD34, and CD45. c Representative image of colony formation of murine BMMSCs. d Representative image of Oil Red O staining of murine BMMSCs. e Representative image of ALP staining of murine BMMSCs. f Representative image of Alizarin red staining of murine BMMSCs. Scale bar, 500 mum

- Submitted by
- Invitrogen Antibodies (provider)
- Main image
- Experimental details
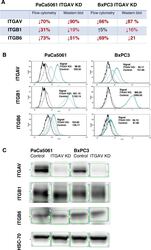
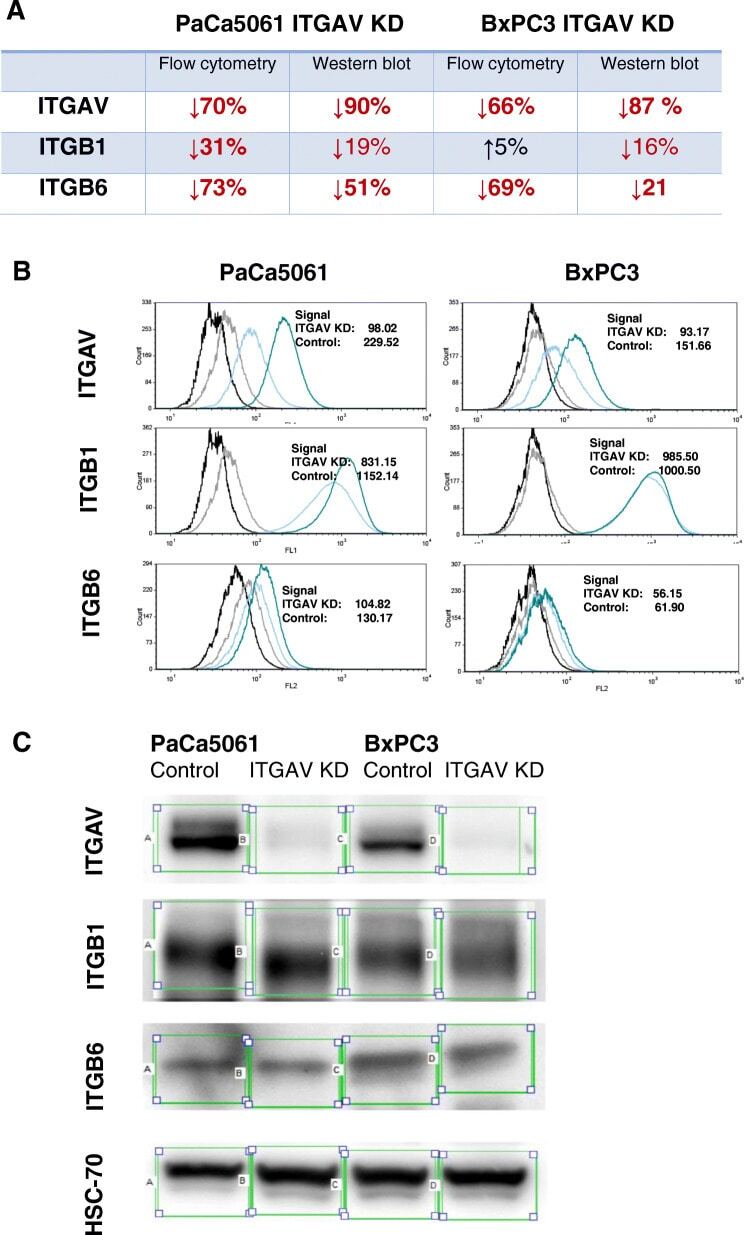
- Fig. 2 Changes of ITGAV and corresponding beta-subunits ITGB1 und ITGB6 ( a ) using flow cytometry ( b ) and Western blot ( c ). The expression of ITGAV was reduced by > 65% in PaCa 5061 and BxPC3 ITGAV KD cells. Subunits ITGB1 and ITGB6 were found to be downregulated on PaCa 5061 ITGAV KD cells . In contrast, only ITGB6 was downregulated on BxPC3 ITGAV KD cells, while the expression of ITGB1 remained almost unchanged
- Submitted by
- Invitrogen Antibodies (provider)
- Main image
- Experimental details
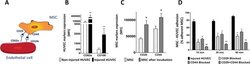
- Fig. 2 MSC-HUVEC adhesion mechanism. a Schematic representation of the molecular mechanism for MSC and HUVEC interaction. b The expression of CD62e and CD106 is upregulated on HUVEC membrane after hypoxia and reoxygenation. c CD29 and CD44 adhesion molecule expression is increased on the surface of MSC after incubation with injured HUVEC. d The blockage of CD29 and CD44 inhibits the adhesion of MSC to injured HUVEC. Significance of the comparison between injured HUVEC and the effect of blocking CD29 and/or CD44 is shown ( n = 5). Results are shown as mean +- SD. ** p value < 0.01; * p value < 0.05

- Submitted by
- Invitrogen Antibodies (provider)
- Main image
- Experimental details
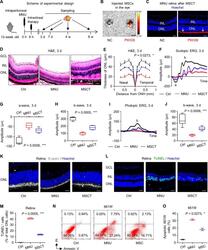
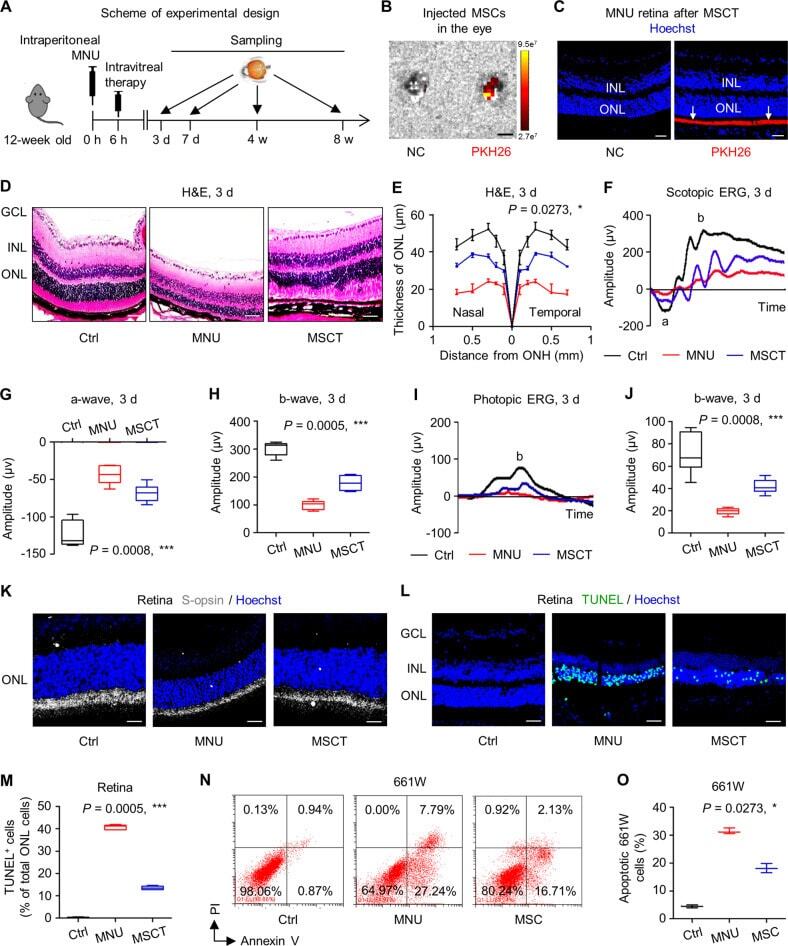
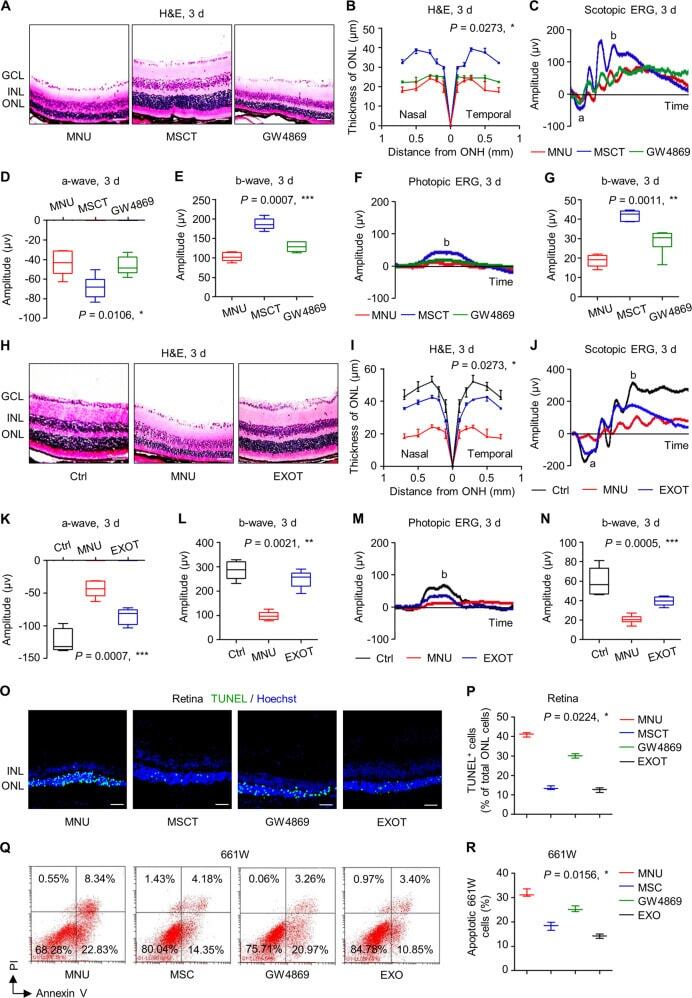
- Fig. 1 Intravitreal transplantation of mesenchymal stem cells (MSCs) counteracts N -methyl- N -nitrosourea (MNU)-induced photoreceptor apoptosis and alleviates retinal degeneration. A Schematic diagram demonstrating the study design of in vivo experiments on MNU-induced retinal degeneration. B Biodistribution of PKH26-labeled MSCs in the eye after intravitreal injection for 6 h. NC negative control, injection of MSCs without staining. Scale bar = 2.5 mm. C Tracing of PKH26-labeled MSCs (red) in the retina tissue counterstained by Hoechst 33342 (blue) after intravitreal injection for 24 h. MSCT mesenchymal stem cell transplantation after MNU injection, INL inner nuclear layer, ONL outer nuclear layer. Scale bar = 50 mum. Representative hematoxylin and eosin (H&E) staining images of retinal tissues ( D ) and the corresponding quantitative analysis of ONL thickness ( E ). Ctrl control, no MNU treatment, GCL ganglion cell layer, ONH optic nerve head. Scale bars = 50 mum. * P < 0.05 by the Kruskal-Wallis test for area under curve (AUC). N = 3 per group. Representative scotopic electroretinography (ERG) waveforms ( F ) and the corresponding quantitative analyses of amplitude changes of a-wave ( G ) and b-wave ( H ). * P < 0.05 by the Kruskal-Wallis tests. N = 6 per group. Representative photopic ERG waveforms ( I ) and the corresponding quantitative analysis of b-wave amplitude changes ( J ). * P < 0.05 by the Kruskal-Wallis tests. N = 6 per group. K Representative immunofluorescen
- Submitted by
- Invitrogen Antibodies (provider)
- Main image
- Experimental details
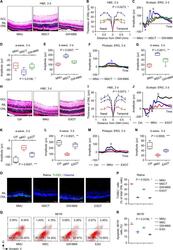
- Fig. 2 Exosomes mediates therapeutic effects of mesenchymal stem cell transplantation (MSCT) on N -methyl- N -nitrosourea (MNU)-induced photoreceptor apoptosis and retinal degeneration. Representative hematoxylin and eosin (H&E) staining images of retinal tissues ( A ) and the corresponding quantitative analysis of outer nuclear layer (ONL) thickness ( B ). Mice were injected with MNU with or without MSCT. GW4869, a neutral sphingomyelinase inhibitor for blocking exosome generation, which was used for MSC preconditioning before transplantation; GCL ganglion cell layer, INL inner nuclear layer, ONH optic nerve head. Scale bars = 50 mum. * P < 0.05 by the Kruskal-Wallis test for area under curve (AUC). N = 3 per group. Representative scotopic electroretinography (ERG) waveforms ( C ) and the corresponding quantitative analyses of amplitude changes of a-wave ( D ) and b-wave ( E ). * P < 0.05 by the Kruskal-Wallis tests. N = 6 per group. Representative photopic ERG waveforms ( F ) and the corresponding quantitative analysis of b-wave amplitude changes ( G ). * P < 0.05 by the Kruskal-Wallis tests. N = 6 per group. Representative H&E staining images of retinal tissues ( H ) and the corresponding quantitative analysis of ONL thickness ( I ). Ctrl control, no MNU treatment, EXOT exosomal transplantation after MNU injection. Scale bars = 50 mum. * P < 0.05 by the Kruskal-Wallis test for AUC. N = 3 per group. Representative scotopic ERG waveforms ( J ) and the corresponding quantitat
- Submitted by
- Invitrogen Antibodies (provider)
- Main image
- Experimental details
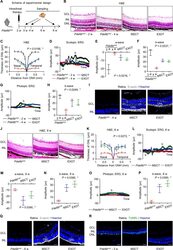
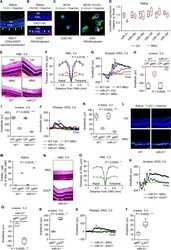
- Fig. 4 Intravitreal transplantation of mesenchymal stem cells (MSCs) and exosomes (EXO) ameliorates photoreceptor loss and retinal degeneration in the Phosphodiesterase 6b gene mutant ( Pde6b mut ) mouse model. A Schematic diagram demonstrating the study design of in vivo experiments on Pde6b mut retinal degeneration. Representative hematoxylin and eosin (H&E) staining images of retinal tissues ( B ) and the corresponding quantitative analysis of ONL thickness ( C ). MSCT mesenchymal stem cell transplantation, EXOT exosomal transplantation, GCL ganglion cell layer, ONH optic nerve head. Scale bars = 50 mum. * P < 0.05 by the Kruskal-Wallis test for area under curve (AUC). N = 3 per group. Representative scotopic electroretinography (ERG) waveforms ( D ) and the corresponding quantitative analyses of amplitude changes of a-wave ( E ) and b-wave ( F ). * P < 0.05 by the Kruskal-Wallis tests. N = 3 per group. Representative photopic ERG waveforms ( G ) and the corresponding quantitative analysis of b-wave amplitude changes ( H ). * P < 0.05 by the Kruskal-Wallis tests. N = 3 per group. I Representative immunofluorescent (IF) staining images of retinal tissues showing cone photoreceptor bodies (white) counterstained by Hoechst 33342 (blue). Scale bars = 25 mum. Representative H&E staining images of retinal tissues ( J ) and the corresponding quantitative analysis of ONL thickness ( K ). Scale bars = 50 mum. * P < 0.05 by the Kruskal-Wallis test for AUC. N = 3 per group. Represent

- Submitted by
- Invitrogen Antibodies (provider)
- Main image
- Experimental details
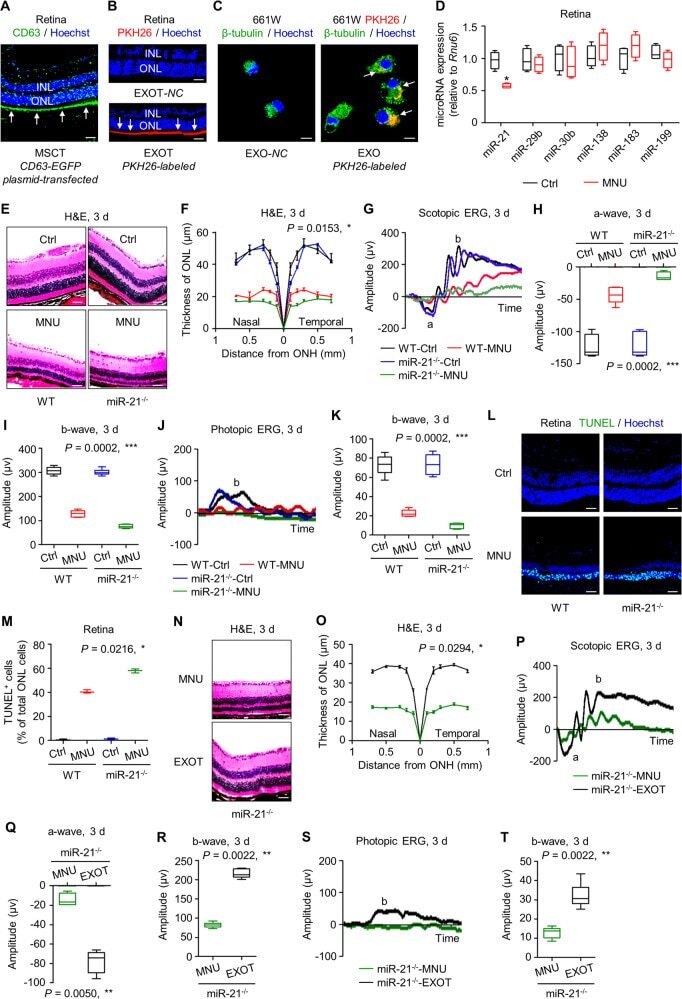
- Fig. 5 miR-21 deficiency aggravates N -methyl- N -nitrosourea (MNU)-induced photoreceptor apoptosis and retinal degeneration, which is restrained by transplantation of mesenchymal stem cell (MSC)-derived exosomes. A Tracing of CD63-EGFP plasmid-transfected MSCs (green, CD63) in the retina tissue counterstained by Hoechst 33342 (blue) after intravitreal injection for 24 h. MSCT mesenchymal stem cell transplantation, INL inner nuclear layer, ONL outer nuclear layer. Scale bar = 50 mum. B Tracing of PKH26-labeled exosomes (red) in the retina tissue counterstained by Hoechst 33342 (blue) after intravitreal injection for 24 h. EXOT exosomal transplantation, NC negative control, injection of EXO without staining. Scale bar = 50 mum. C Tracing of PKH26-labeled, MSC-derived exosomes (red) in 661W cone photoreceptor cells during in vitro treatment. 661W cells are demonstrated by beta-tubulin immunostaining for microtubules (green), counterstained by Hoechst 33342 (blue). NC negative control, treatment of EXO without staining. Scale bar = 10 mum. D Quantitative real-time polymerase chain reaction (qRT-PCR) analysis of expression levels of multiple microRNAs in retina tissues, normalized to Rnu6 . Ctrl control. * P < 0.05 by the Mann-Whitney U test. N = 4 per group. Representative hematoxylin and eosin (H&E) staining images of retinal tissues ( E ) and the corresponding quantitative analysis of outer nuclear layer (ONL) thickness ( F ). WT wild-type mice, miR-21 -/- mice deficient for m
- Submitted by
- Invitrogen Antibodies (provider)
- Main image
- Experimental details
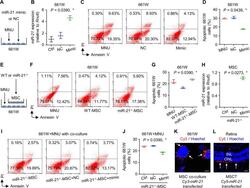
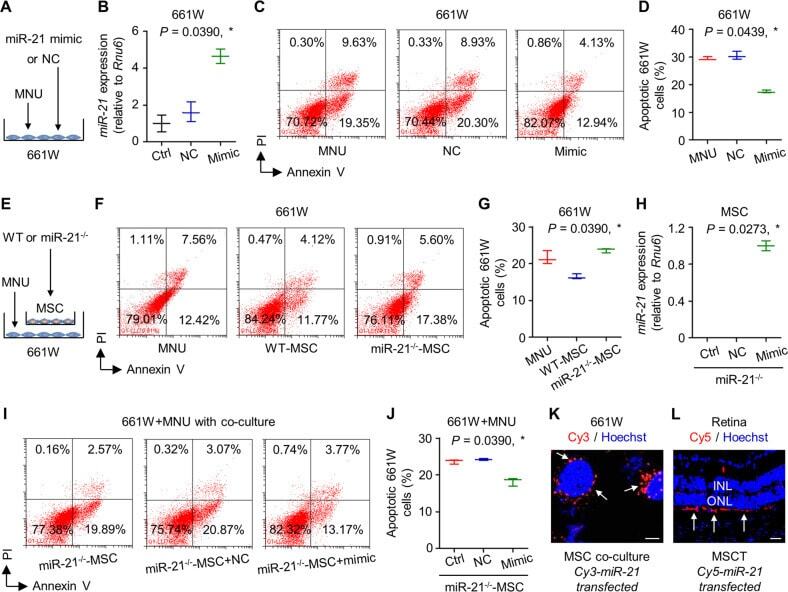
- Fig. 6 miR-21 protects 661W cone photoreceptor cells against N -methyl- N -nitrosourea (MNU)-induced apoptosis and can be transferred from mesenchymal stem cells (MSCs). A Diagram demonstrating the experimental design for analyzing direct effects of miR-21 on 661W cells. NC negative control of miR-21 mimics. B Quantitative real-time polymerase chain reaction (qRT-PCR) analysis of expression levels of miR-21 in 661W cells, normalized to Rnu6 . Ctrl control. * P < 0.05 by the Kruskal-Wallis test. N = 3 per group. Representative flow cytometric images showing death of 661W cone photoreceptor cells ( C ) and the corresponding quantitative analysis of percentages of apoptotic (Annexin V + PI - plus Annexin V + PI + ) 661W cells ( D ). 661W cells were treated with MNU with or without transfection of NC or miR-21 mimics. PI propidium iodide. * P < 0.05 by the Kruskal-Wallis test. N = 3 per group. E Diagram demonstrating the experimental design for analyzing indirect effects of MSCs on 661W cells. WT wild-type mice, miR-21 -/- , mice deficient for miR-21. Representative flow cytometric images showing death of 661W cone photoreceptor cells ( F ) and the corresponding quantitative analysis of percentages of apoptotic (Annexin V + PI - plus Annexin V + PI + ) 661W cells ( G ). MNU-treated 661W cells were co-cultured in the Transwell system with or without different MSCs. * P < 0.05 by the Kruskal-Wallis test. N = 3 per group. H qRT-PCR analysis of expression levels of miR-21 in MSCs, no
- Submitted by
- Invitrogen Antibodies (provider)
- Main image

- Experimental details
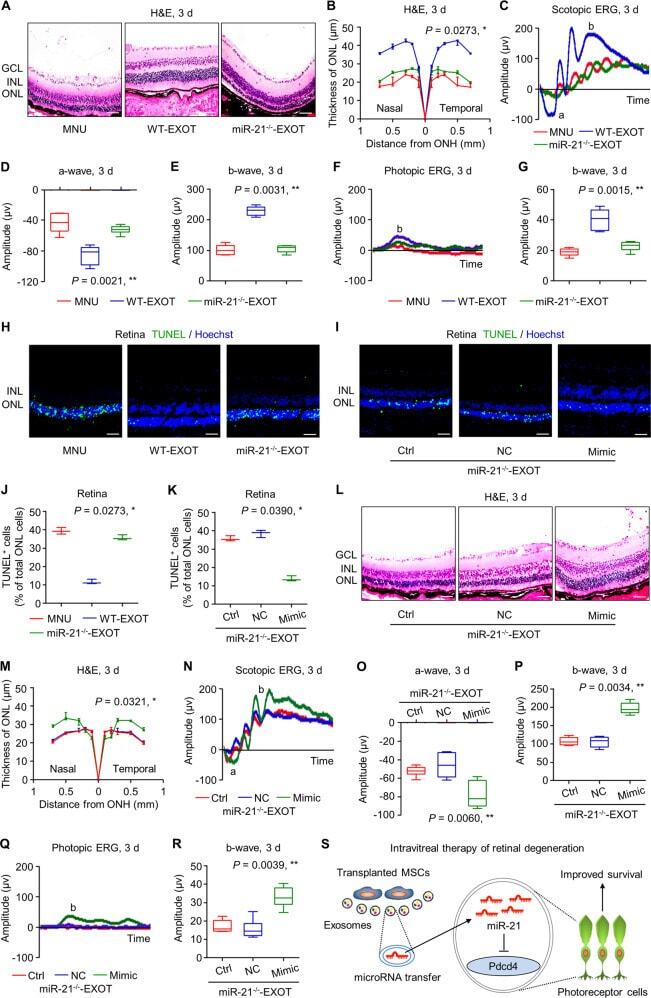
- Fig. 8 Exosomal miR-21 counteracts N -methyl- N -nitrosourea (MNU)-induced photoreceptor apoptosis and retinal degeneration. Representative hematoxylin and eosin (H&E) staining images of retinal tissues ( A ) and the corresponding quantitative analysis of outer nuclear layer (ONL) thickness ( B ). WT-EXOT transplantation of exosomes derived from wild-type mesenchymal stem cells (MSCs) after MNU injection, miR-21 -/- -EXOT transplantation of exosomes derived from miR-21-deficient MSCs after MNU injection, GCL ganglion cell layer, INL inner nuclear layer, ONH optic nerve head. Scale bars = 50 mum. * P < 0.05 by the Kruskal-Wallis test for area under curve (AUC). N = 3 per group. Representative scotopic electroretinography (ERG) waveforms ( C ) and the corresponding quantitative analyses of amplitude changes of a-wave ( D ) and b-wave ( E ). * P < 0.05 by the Kruskal-Wallis tests. N = 6 per group. Representative photopic ERG waveforms ( F ) and the corresponding quantitative analysis of b-wave amplitude changes ( G ). * P < 0.05 by the Kruskal-Wallis tests. N = 6 per group. Representative terminal deoxynucleotidyl transferase dUTP nick end labeling (TUNEL, green) staining images of retinal tissues counterstained by Hoechst 33342 (blue) ( H ) and the corresponding quantitative analysis of percentages of TUNEL + cells over total ONL cells ( J ). Scale bars = 50 mum. * P < 0.05 by the Kruskal-Wallis test. N = 3 per group. Representative TUNEL (green) staining images of retinal tiss
- Submitted by
- Invitrogen Antibodies (provider)
- Main image
- Experimental details
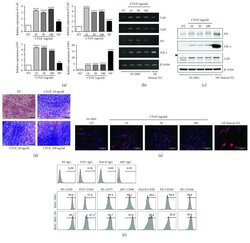
- Figure 1 Fibrogenic differentiation of human embryonic stem cell-derived mesenchymal stem cells (hESC-MSCs) upon stimulation with connective tissue growth factor (CTGF). hESC-MSCs were differentiated into fibroblasts by treatment with various concentrations of connective tissue growth factor (CTGF) for 4 weeks. Normal skin fibroblasts (Detroit 551) were also used as a positive control. (a) mRNA levels of fibroblast-related genes in hESC-MSCs after CTGF treatment were determined by the real-time polymerase chain reaction (PCR) ( n = 3, one-way ANOVA; ** p < 0.01 and **** p < 0.0001). (b) Collagen (Col)1, Col3, fibronectin (FN), and fibroblast-specific protein- (FSP-) 1 mRNA levels were determined by PCR. (c) FN, FSP-1, Col1, and beta -actin protein levels in hESC-MSCs following CTGF treatment were determined by immunoblotting. (d) Masson's trichrome was used to detect collagen fibers. (e) hESC-MSCs were immunostained to detect collagen I (Col1) following CTGF treatment. 4',6'-Diamidino-2-phenylindole (DAPI) was used for nuclear counterstaining. (f) Flow cytometry analysis of hESC-MSCs. After expansion of hESC-MSCs and hESC-MSC-Fbs, cells were trypsinized and stained with specific markers for CD29, CD47, CD73, CD90, CD91, CD105, and CD166.

- Submitted by
- Invitrogen Antibodies (provider)
- Main image
- Experimental details
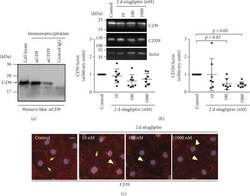
- Figure 9 Prolonged treatment of iBREC with sitagliptin decreased expression of CD29 and changed the amount of plasma membrane-localized CD9. (a) Proteins were immunoprecipitated from whole cell extracts with antibodies specific for CD9 or CD29 and analyzed by Western blot with an antibody binding to CD9. Precipitates obtained with both antibodies ( alpha CD9 and alpha CD29) contained the tetraspanin CD9 but not samples derived from precipitation with an isotype-matched control antibody, indicating that CD9 and CD29 are present in the same protein complex. (b) Confluent iBREC exposed to 10-1000 nM sitagliptin for two days were harvested for preparation of cell extracts followed by Western blot analyses. Expression of CD29 and CD9 was lower after treatment with sitagliptin, although the differences were statistically significant only for CD29. Signals were normalized as described in Materials and Methods. (c) Prominent CD9-specific staining was observed at the plasma membrane of control cells (yellow arrows). This staining was more diffuse and less intense (yellow arrowheads) after treatment of the cells with the DPP-4 inhibitor for two days. Scale bar: 10 mu m.
