Explore
 Validate
 Learn
Learn Western blot
 Immunoprecipitation
Antibody data
- Antibody Data
- Antigen structure
- References [10]
- Comments [0]
- Validations
- Western blot [2]
- Immunocytochemistry [1]
- Other assay [4]
Submit
Validation data
Reference
Comment
Report error
- Product number
- MA5-14794 - Provider product page

- Provider
- Invitrogen Antibodies
- Product name
- EEA1 Monoclonal Antibody (F.43.1)
- Antibody type
- Monoclonal
- Antigen
- Synthetic peptide
- Description
- It is not recommended to aliquot this antibody.
- Reactivity
- Human, Mouse, Rat
- Host
- Rabbit
- Isotype
- IgG
- Antibody clone number
- F.43.1
- Vial size
- 100 µL
- Concentration
- 44 µg/mL
- Storage
- -20°C
Submitted references Lysosomal exocytosis releases pathogenic α-synuclein species from neurons in synucleinopathy models.
The Epidermal Growth Factor Receptor Is a Relevant Host Factor in the Early Stages of The Zika Virus Life Cycle In Vitro.
Identification of Required Host Factors for SARS-CoV-2 Infection in Human Cells.
Stress Response of Mouse Embryonic Fibroblasts Exposed to Polystyrene Nanoplastics.
Macrophages use a bet-hedging strategy for antimicrobial activity in phagolysosomal acidification.
Differential signaling pathways are initiated in macrophages during infection depending on the intracellular fate of Chlamydia spp.
Patient-specific mutations impair BESTROPHIN1's essential role in mediating Ca(2+)-dependent Cl(-) currents in human RPE.
Autophagy activation by novel inducers prevents BECN2-mediated drug tolerance to cannabinoids.
Variants of Rab GTPase-Effector Binding Protein-2 Cause Variation in the Collateral Circulation and Severity of Stroke.
Altered dynamics of a lipid raft associated protein in a kidney model of Fabry disease.
Xie YX, Naseri NN, Fels J, Kharel P, Na Y, Lane D, Burré J, Sharma M
Nature communications 2022 Aug 22;13(1):4918
Nature communications 2022 Aug 22;13(1):4918
The Epidermal Growth Factor Receptor Is a Relevant Host Factor in the Early Stages of The Zika Virus Life Cycle In Vitro.
Sabino C, Bender D, Herrlein ML, Hildt E
Journal of virology 2021 Sep 27;95(20):e0119521
Journal of virology 2021 Sep 27;95(20):e0119521
Identification of Required Host Factors for SARS-CoV-2 Infection in Human Cells.
Daniloski Z, Jordan TX, Wessels HH, Hoagland DA, Kasela S, Legut M, Maniatis S, Mimitou EP, Lu L, Geller E, Danziger O, Rosenberg BR, Phatnani H, Smibert P, Lappalainen T, tenOever BR, Sanjana NE
Cell 2021 Jan 7;184(1):92-105.e16
Cell 2021 Jan 7;184(1):92-105.e16
Stress Response of Mouse Embryonic Fibroblasts Exposed to Polystyrene Nanoplastics.
Han SW, Choi J, Ryu KY
International journal of molecular sciences 2021 Feb 20;22(4)
International journal of molecular sciences 2021 Feb 20;22(4)
Macrophages use a bet-hedging strategy for antimicrobial activity in phagolysosomal acidification.
Dragotakes Q, Stouffer KM, Fu MS, Sella Y, Youn C, Yoon OI, De Leon-Rodriguez CM, Freij JB, Bergman A, Casadevall A
The Journal of clinical investigation 2020 Jul 1;130(7):3805-3819
The Journal of clinical investigation 2020 Jul 1;130(7):3805-3819
Differential signaling pathways are initiated in macrophages during infection depending on the intracellular fate of Chlamydia spp.
Nagarajan UM, Tripathy M, Kollipara A, Allen J 4th, Goodwin A, Whittimore J, Wyrick PB, Rank RG
Immunology and cell biology 2018 Mar;96(3):246-256
Immunology and cell biology 2018 Mar;96(3):246-256
Patient-specific mutations impair BESTROPHIN1's essential role in mediating Ca(2+)-dependent Cl(-) currents in human RPE.
Li Y, Zhang Y, Xu Y, Kittredge A, Ward N, Chen S, Tsang SH, Yang T
eLife 2017 Oct 24;6
eLife 2017 Oct 24;6
Autophagy activation by novel inducers prevents BECN2-mediated drug tolerance to cannabinoids.
Kuramoto K, Wang N, Fan Y, Zhang W, Schoenen FJ, Frankowski KJ, Marugan J, Zhou Y, Huang S, He C
Autophagy 2016 Sep;12(9):1460-71
Autophagy 2016 Sep;12(9):1460-71
Variants of Rab GTPase-Effector Binding Protein-2 Cause Variation in the Collateral Circulation and Severity of Stroke.
Lucitti JL, Sealock R, Buckley BK, Zhang H, Xiao L, Dudley AC, Faber JE
Stroke 2016 Dec;47(12):3022-3031
Stroke 2016 Dec;47(12):3022-3031
Altered dynamics of a lipid raft associated protein in a kidney model of Fabry disease.
Labilloy A, Youker RT, Bruns JR, Kukic I, Kiselyov K, Halfter W, Finegold D, do Monte SJ, Weisz OA
Molecular genetics and metabolism 2014 Feb;111(2):184-92
Molecular genetics and metabolism 2014 Feb;111(2):184-92
No comments: Submit comment
Supportive validation
- Submitted by
- Invitrogen Antibodies (provider)
- Main image
- Experimental details
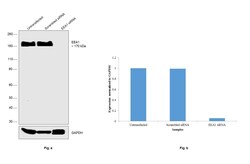
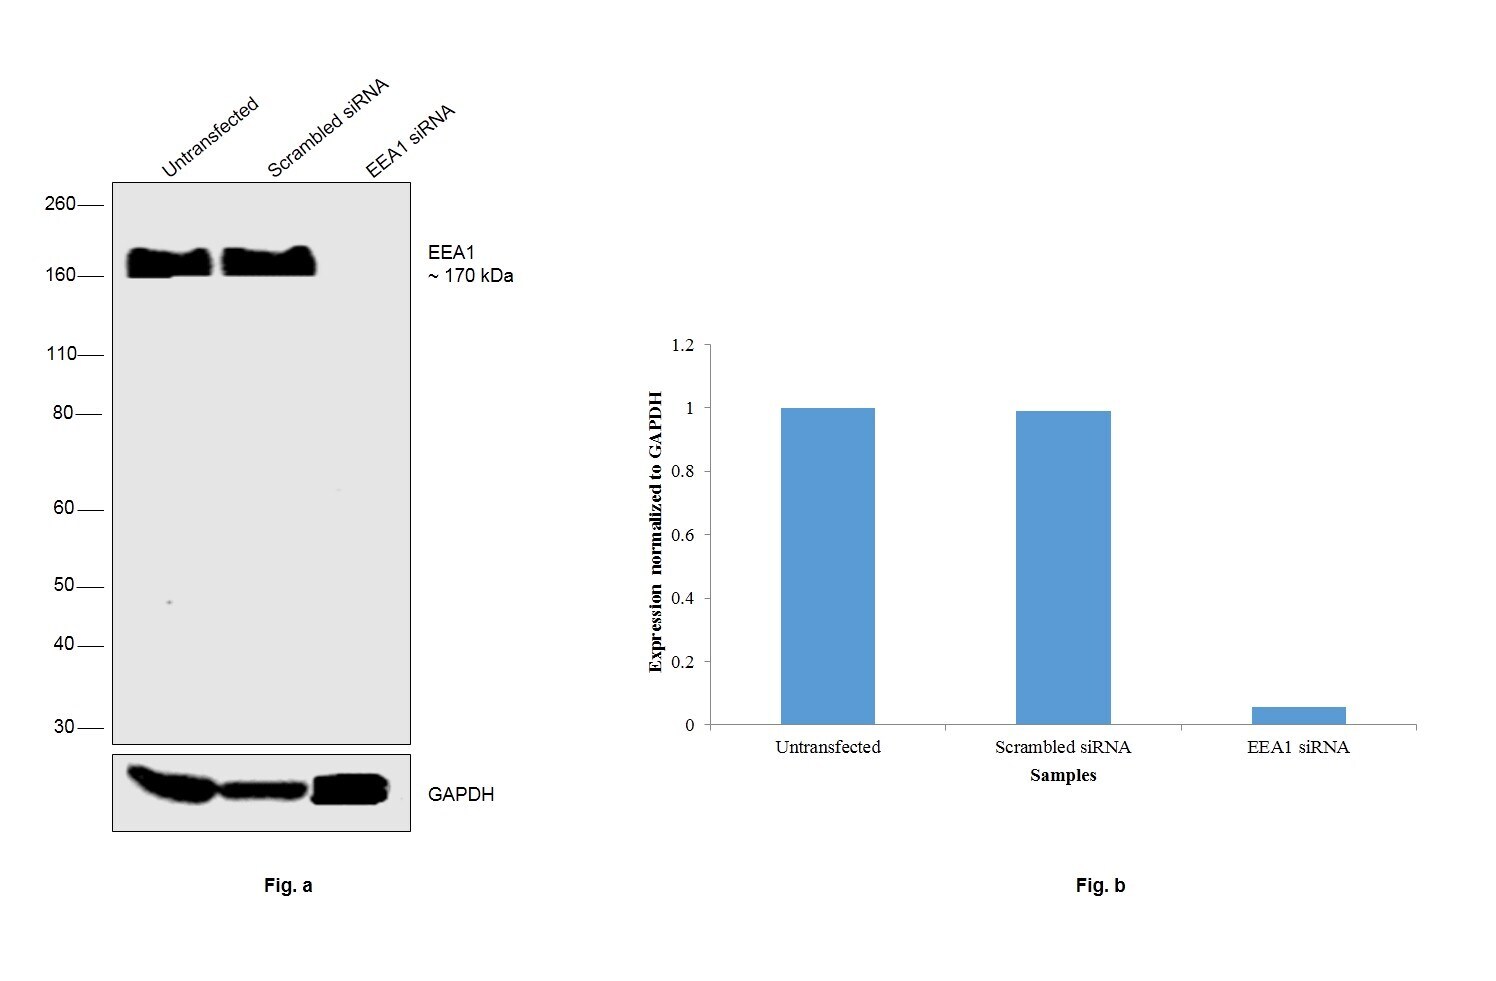
- Knockdown of EEA1 was achieved by transfecting A-431 cells with EEA1 specific siRNAs (Silencer® select Product # s15971, s15970). Western blot analysis (Fig. a) was performed using membrane enriched extracts from the EEA1 knockdown cells (Lane 3), non-specific scrambled siRNA transfected cells (Lane 2) and untransfected cells (Lane 1). The blot was probed with Anti-EEA1 Rabbit Monoclonal Antibody (Product # MA5-14794, 1:1000 dilution) and Goat anti-Rabbit IgG (H+L), Superclonal™ Recombinant Secondary Antibody, HRP (Product # A27036, 1:4000 dilution) using the iBright FL 1000 (Product # A32752). Densitometric analysis of this Western Blot is shown in histogram (Fig. b). Decrease in signal upon siRNA mediated knock down confirms that antibody is specific to EEA1.
- Submitted by
- Invitrogen Antibodies (provider)
- Main image
- Experimental details
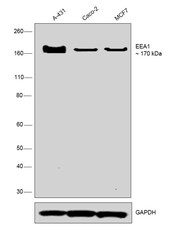
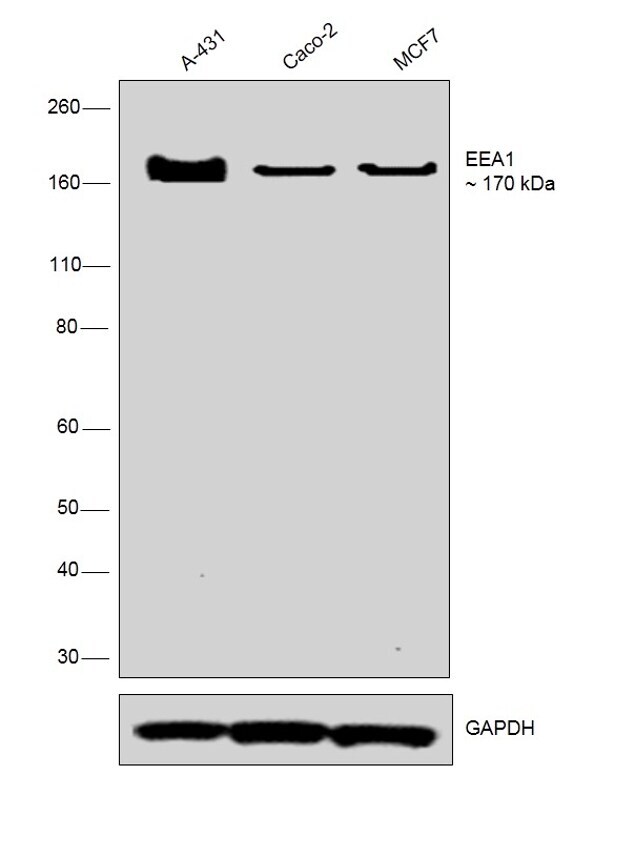
- Western blot was performed using Anti-EEA1 Rabbit Monoclonal Antibody (Product # MA5-14794) and a 170 kDa band corresponding to EEA1 was observed across all the cell lines tested. Membrane enriched extracts (30 µg lysate) of A-431 (Lane 1), Caco-2 (Lane 2) and MCF7 (Lane 3) were electrophoresed using NuPAGE™ 4-12% Bis-Tris Protein Gel (Product # NP0322BOX). Resolved proteins were then transferred onto a nitrocellulose membrane (Product # IB23001) by iBlot® 2 Dry Blotting System (Product # IB21001). The blot was probed with the primary antibody (1:1000 dilution) and detected by chemiluminescence with Goat anti-Rabbit IgG (H+L), Superclonal™ Recombinant Secondary Antibody, HRP (Product # A27036, 1:4000 dilution) using the iBright FL 1000 (Product # A32752). Chemiluminescent detection was performed using Novex® ECL Chemiluminescent Substrate Reagent Kit (Product # WP20005).
Supportive validation
- Submitted by
- Invitrogen Antibodies (provider)
- Main image
- Experimental details
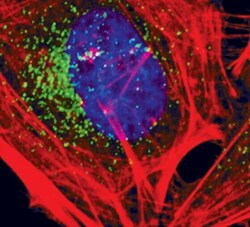
- Immunofluorescent analysis of EEA1 in HeLa cells using an EEA1 monoclonal antibody (Product # MA5-14794) (green). Actin filaments are labeled with a fluorescent red phalloidin. DNA is labeled using a fluorescent blue dye.

Supportive validation
- Submitted by
- Invitrogen Antibodies (provider)
- Main image
- Experimental details
- NULL
- Submitted by
- Invitrogen Antibodies (provider)
- Main image
- Experimental details
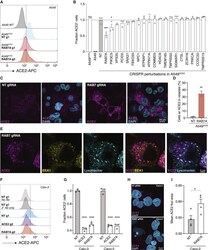
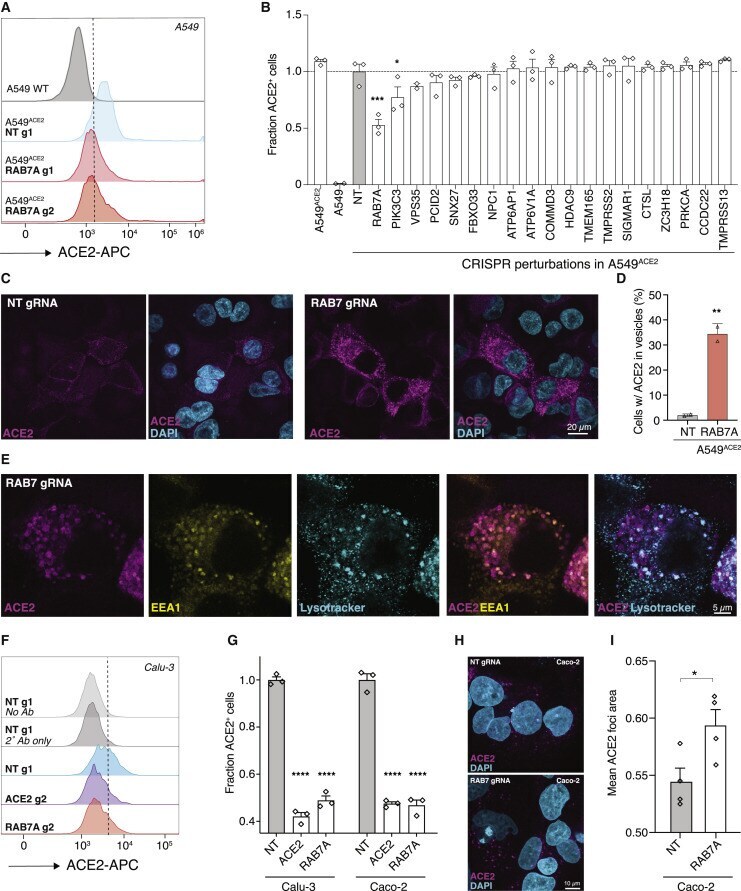
- Figure 6 RAB7A Loss Results in a Reduced Cell Surface Expression and an Increased Endosomal Accumulation of ACE2 (A) Representative histograms of flow cytometry analysis to determine cell surface expression of ACE2 on A549 cell lines (A549 wild-type [WT], A549 ACE2 , and ACE2 with Cas9 and non-targeting [NT] or RAB7A-targeting guide RNAs). The dashed line indicates the gate between the ACE2-negative and -positive cells. (B) Fraction of ACE2 + cells (using gating shown in A). ACE2 expression level was normalized across all samples to the A549 ACE2 cells transduced with non-targeting (NT) guides (n = 2-3 guide RNA-transduced lines per gene, error bars are SEM). (C) Representative images of immunofluorescence staining of ACE2 on A549 ACE2 transduced with an NT or a RAB7A -targeting guide. In NT cells, ACE2 localizes at the cell membrane and in the cytoplasm, while in RAB7A -targeted cells, ACE2 shows a distinct pattern of localization to vesicles. (D) Percent of cells with ACE2 accumulation in vesicles in NT and RAB7A-transduced A549 ACE2 cells (n = 2 biological replicates, error bars are SEM). (E) Representative images of immunofluorescence co-stained for ACE2, EEA1, and LysoTracker in A549 ACE2 cells with a CRISPR guide RNA targeting RAB7A . ACE2 shows a distinct colocalization with EEA1 (an early endosome marker) and a less frequent colocalization with LysoTracker (a lysosomal maker). (F) Representative histograms of flow cytometry analysis to determine cell surface expressio
- Submitted by
- Invitrogen Antibodies (provider)
- Main image
- Experimental details
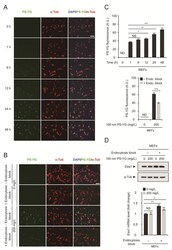
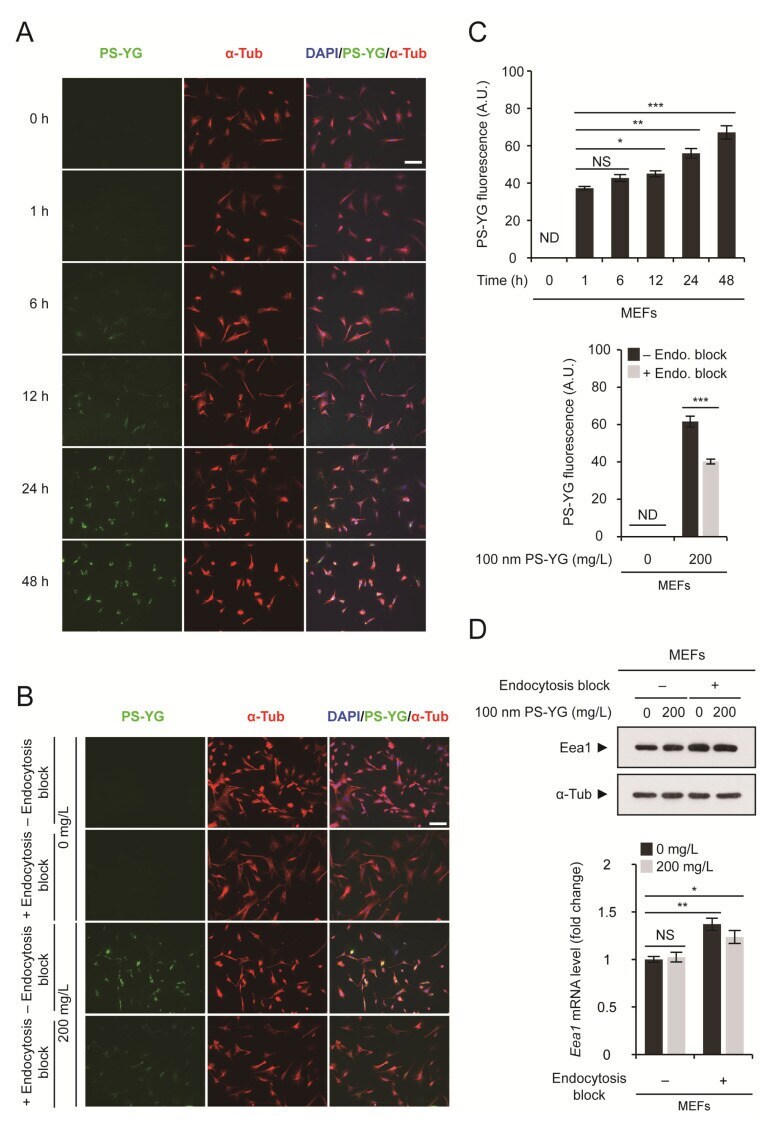
- Figure 1 Polystyrene (PS) nanoplastic uptake via endocytosis. ( A ) Mouse embryonic fibroblasts (MEFs) were treated with 100 nm PS-YG (yellow-green) nanoplastics at 200 mg/L for 0 to 48 h. Cells were subjected to immunofluorescence analysis using an anti-alpha-tubulin (alpha-Tub) antibody and DNA was visualized with DAPI. Direct fluorescence from PS-YG nanoplastics was also visualized. ( B ) Endocytosis was blocked using sodium azide. MEFs were pretreated with sodium azide (+ Endocytosis block) or vehicle (- Endocytosis block) for 16 h before 100 nm PS-YG treatment. After 16 h, MEFs were treated with 100 nm PS-YG nanoplastics at the indicated concentration for 24 h. ( C ) Quantitative analysis of PS-YG fluorescence levels in ( A , upper panel) and ( B , lower panel). Green fluorescence levels in all alpha-Tub-positive cells in the field were determined and expressed as the means +- SEM from the number of cells shown. ( D ) Immunoblot detection (upper panel) and qRT-PCR analysis (lower panel) of Eea1 in MEFs treated with PS-YG at the indicated concentration for 1 day with or without sodium azide pretreatment to block endocytosis. alpha-Tubulin (alpha-Tub) was used as a loading control for immunoblot analysis. mRNA expression levels of Eea1 were determined by qRT-PCR ( n = 3 each), normalized against Gapdh levels and expressed as the fold change relative to untreated control levels. Representative images of cells or immunoblots are shown. qRT-PCR data are expressed as the means
- Submitted by
- Invitrogen Antibodies (provider)
- Main image
- Experimental details
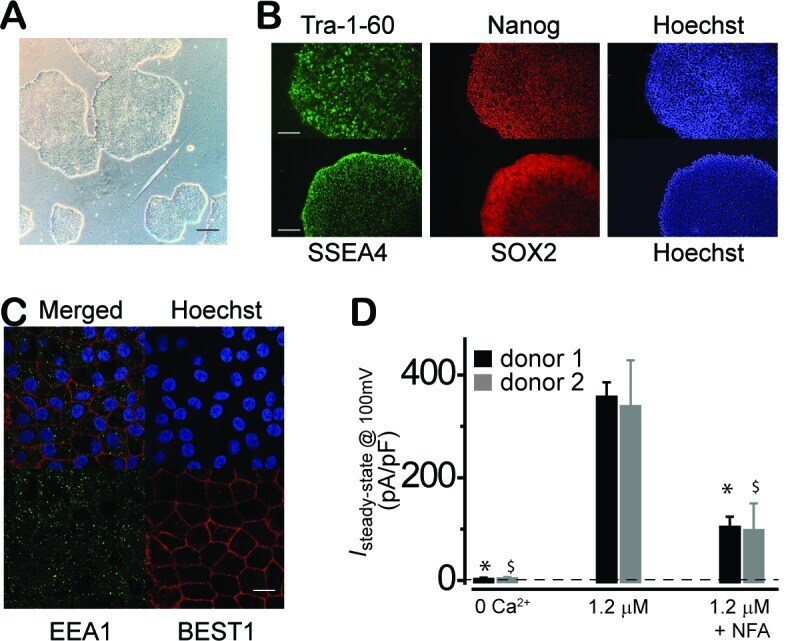
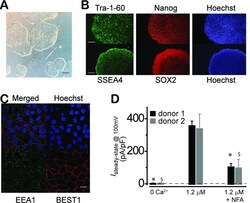
- Figure 1--figure supplement 1. Characterization of WT iPSC and iPSC-RPE. ( A ) Phase picture of established WT iPSC line before differentiation. Scale bar, 400 mum. ( B ) Immunocytofluorescence images of pluripotency markers in established iPSC. Scale bar, 200 mum. ( C ) Confocal images showing plasma membrane localization of BEST1. Scale bar, 10 mum. ( D ) Comparison of current amplitudes in iPSC-RPEs from two BEST1 WT donors. Bar chart showing the steady-state current amplitudes at 0 [Ca 2+ ] i , 1.2 muM [Ca 2+ ] i , and 1.2 muM [Ca 2+ ] i + 100 muM NFA in RPEs from two distinct BEST1 WT human donors; n = 5-6. *$ p