 Explore
 Validate
 Learn
Learn Western blot
 Immunoprecipitation
Antibody data
- Antibody Data
- Antigen structure
- References [5]
- Comments [0]
- Validations
- Western blot [3]
- Immunocytochemistry [3]
- Other assay [3]
Submit
Validation data
Reference
Comment
Report error
- Product number
- PA5-17228 - Provider product page

- Provider
- Invitrogen Antibodies
- Product name
- EEA1 Polyclonal Antibody
- Antibody type
- Polyclonal
- Antigen
- Synthetic peptide
- Description
- It is not recommended to aliquot this antibody.
- Reactivity
- Human, Mouse, Rat
- Host
- Rabbit
- Isotype
- IgG
- Vial size
- 100 µL
- Concentration
- 10 µg/mL
- Storage
- -20°C
Submitted references Membrane Dynamics and Organization of the Phagocyte NADPH Oxidase in PLB-985 Cells.
The ubiquitin ligase UBE4B regulates amyloid precursor protein ubiquitination, endosomal trafficking, and amyloid β42 generation and secretion.
Sensory Axon Growth Requires Spatiotemporal Integration of CaSR and TrkB Signaling.
Distinct mechanisms enable inward or outward budding from late endosomes/multivesicular bodies.
EndophilinAs regulate endosomal sorting of BDNF-TrkB to mediate survival signaling in hippocampal neurons.
Joly J, Hudik E, Lecart S, Roos D, Verkuijlen P, Wrona D, Siler U, Reichenbach J, Nüsse O, Dupré-Crochet S
Frontiers in cell and developmental biology 2020;8:608600
Frontiers in cell and developmental biology 2020;8:608600
The ubiquitin ligase UBE4B regulates amyloid precursor protein ubiquitination, endosomal trafficking, and amyloid β42 generation and secretion.
Gireud-Goss M, Reyes S, Tewari R, Patrizz A, Howe MD, Kofler J, Waxham MN, McCullough LD, Bean AJ
Molecular and cellular neurosciences 2020 Oct;108:103542
Molecular and cellular neurosciences 2020 Oct;108:103542
Sensory Axon Growth Requires Spatiotemporal Integration of CaSR and TrkB Signaling.
Markworth R, Adolfs Y, Dambeck V, Steinbeck LM, Lizé M, Pasterkamp RJ, Bähr M, Dean C, Burk K
The Journal of neuroscience : the official journal of the Society for Neuroscience 2019 Jul 24;39(30):5842-5860
The Journal of neuroscience : the official journal of the Society for Neuroscience 2019 Jul 24;39(30):5842-5860
Distinct mechanisms enable inward or outward budding from late endosomes/multivesicular bodies.
Gireud-Goss M, Reyes S, Wilson M, Farley M, Memarzadeh K, Srinivasan S, Sirisaengtaksin N, Yamashita S, Tsunoda S, Lang FF, Waxham MN, Bean AJ
Experimental cell research 2018 Nov 1;372(1):1-15
Experimental cell research 2018 Nov 1;372(1):1-15
EndophilinAs regulate endosomal sorting of BDNF-TrkB to mediate survival signaling in hippocampal neurons.
Burk K, Murdoch JD, Freytag S, Koenig M, Bharat V, Markworth R, Burkhardt S, Fischer A, Dean C
Scientific reports 2017 May 19;7(1):2149
Scientific reports 2017 May 19;7(1):2149
No comments: Submit comment
Supportive validation
- Submitted by
- Invitrogen Antibodies (provider)
- Main image

- Experimental details
- Western blot was performed using Anti-EEA1 Polyclonal Antibody (Product # PA5-17228) and a 162 kDa band corresponding to EEA1 was observed across all the cell lines tested. Whole cell extracts (60 µg lysate) of A-431 (Lane 1), Hep G2 (Lane 2), PC-12 (Lane 3) and SH-SY5Y (Lane 4) were electrophoresed using NuPAGE™ 3-8% Tris-Acetate Protein Gel (Product # EA0378BOX). Resolved proteins were then transferred onto a nitrocellulose membrane (Product # IB24001) by iBlot® 2 Dry Blotting System (Product # IB21001). The blot was probed with the primary antibody (1:1000 dilution) and detected by chemiluminescence with Goat anti-Rabbit IgG (H+L) Superclonal™ Recombinant Secondary Antibody, HRP (Product # A27036,1:4000 dilution) using the iBright™ FL1500 Imaging System (Product # A44115). Chemiluminescentdetection was performed using Novex® ECL Chemiluminescent Substrate Reagent Kit (Product # WP20005).

- Submitted by
- Invitrogen Antibodies (provider)
- Main image
- Experimental details
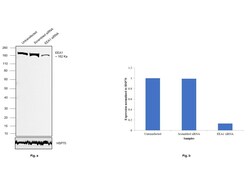
- Knockdown of EEA1 was achieved by transfecting A-431 with EEA1 specific siRNAs (Silencer® select Product # S15969, S15971). Western blot analysis (Fig. a) was performed using Whole cell extracts from the EEA1 knockdown cells (lane 3), non-targeting scrambled siRNA transfected cells (lane 2) and untransfected cells (lane 1). The blot was probed with EEA1 Polyclonal Antibody (Product # PA5-17228, 1:1000 dilution) and Goat anti-Rabbit IgG (H+L) Superclonal™ Recombinant Secondary Antibody, HRP (Product # A27036, 1:4000 dilution). Densitometric analysis of this western blot is shown in histogram (Fig. b). Decrease in signal upon siRNA mediated knock down confirms that antibody is specific to EEA1.

- Submitted by
- Invitrogen Antibodies (provider)
- Main image

- Experimental details
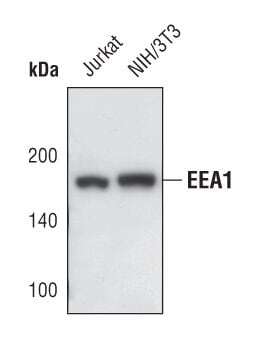
- Western blot analysis of EEA1 in extracts from Jurkat and NIH/3T3 cells using EEA1 polyclonal antibody (Product # PA5-17228).
Supportive validation
- Submitted by
- Invitrogen Antibodies (provider)
- Main image
- Experimental details
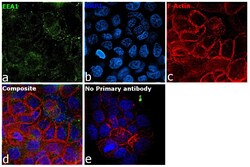
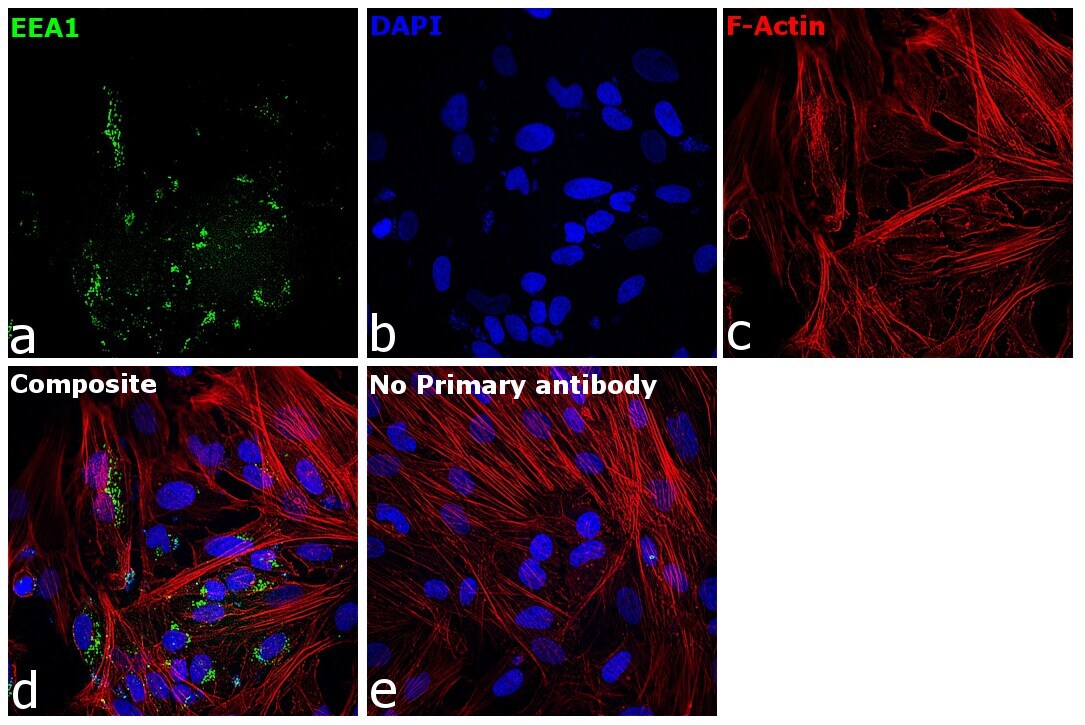
- Immunofluorescence analysis of EEA1 was performed using 70% confluent log phase A-431 cells. The cells were fixed with 4% paraformaldehyde for 10 minutes, permeabilized with 0.1% Triton™ X-100 for 15 minutes, and blocked with 2% BSA for 45 minutes at room temperature. The cells were labeled with EEA1 Polyclonal Antibody (Product # PA5-17228) at 1:100 dilution in 0.1% BSA, incubated at 4 degree celsius overnight and then labeled with Donkey anti-Rabbit IgG (H+L) Highly Cross-Adsorbed Secondary Antibody, Alexa Fluor Plus 488 (Product # A32790), (1:2000 dilution), for 45 minutes at room temperature (Panel a: Green). Nuclei (Panel b:Blue) were stained with ProLong™ Diamond Antifade Mountant with DAPI (Product # P36962). F-actin (Panel c: Red) was stained with Rhodamine Phalloidin (Product # R415, 1:300 dilution). Panel d represents the merged image showing endosome like cytoplasmic localization. Panel e represents control cells with no primary antibody to assess background. The images were captured at 60X magnification.

- Submitted by
- Invitrogen Antibodies (provider)
- Main image

- Experimental details
- Immunofluorescence analysis of EEA1 was performed using 70% confluent log phase BJ cells. The cells were fixed with 4% paraformaldehyde for 10 minutes, permeabilized with 0.1% Triton™ X-100 for 15 minutes, and blocked with 2% BSA for 45 minutes at room temperature. The cells were labeled with EEA1 Polyclonal Antibody (Product # PA5-17228) at 1:100 dilution in 0.1% BSA, incubated at 4 degree celsius overnight and then labeled with Donkey anti-Rabbit IgG (H+L) Highly Cross-Adsorbed Secondary Antibody, Alexa Fluor Plus 488 (Product # A32790), (1:2000 dilution), for 45 minutes at room temperature (Panel a: Green). Nuclei (Panel b:Blue) were stained with Hoechst 33342 (Product # H1399). F-actin (Panel c: Red) was stained with Rhodamine Phalloidin (Product # R415, 1:300 dilution). Panel d represents the merged image showing endosomal localization. Panel e represents control cells with no primary antibody to assess background. The images were captured at 40X magnification in CellInsight CX7 LZR High-Content Screening (HCS) Platform (Product # CX7A1110LZR) and externally deconvoluted (D.Sage et al. / Methods 115 (2017) 28–41).
- Submitted by
- Invitrogen Antibodies (provider)
- Main image

- Experimental details
- Immunofluorescent analysis of EEA1 in NIH/3T3 cells using an EEA1 polyclonal antibody (Product # PA5-17228) (green). Actin filaments are labeled with a fluorescent red phalloidin. DNA is labeled using a fluorescent blue dye.

Supportive validation
- Submitted by
- Invitrogen Antibodies (provider)
- Main image
- Experimental details
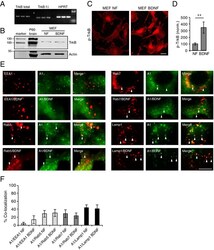
- Figure 2 EndophilinA1 colocalizes with endosomes. ( A ) qPCR products of total TrkB (including full length and truncated isoforms), full length TrkB (TrkB f.l.) and HPRT as a control from mouse embronic fibroblast (MEF) lysates. ( B ) Western blot of TrkB in MEF lysates in control no factor (NF) conditions, and following treatment with BDNF. P60 brain lysate serves as a positive control, and actin as a loading control. ( C ) Images of pTrkB immunostaining in cultured MEFs in ""no factor"" (NF) untreated conditions, or following treatment with 100 ng/ml BDNF for 30 min; scale bar = 10 um. ( D ) Quantitation of pTrkB signal in MEFs in NF and BDNF conditions; n-21 images per condition, error = SEM, significance determined by Student's t-test. ( E ) Representative TIRF microscopy images of MEFs co-transfected with GFP-tagged EndophilinA1 and the RFP-tagged endosomal markers EEA1, Rab5, Rab7 or Lamp1, in the presence and absence of 100 ng/ml BDNF. Arrows indicate colocalization of EndophilinA1 (green) with endosomal markers (red). ( F ) Quantitation of colocalization of transfected GFP-tagged EndophilinA1 with RFP-tagged EEA1, Rab5, Rab7, or Lamp1 in control conditions with no factors (NF) or following addition of BDNF; n = 8-10 images per condition from 3 independent cell cultures, significance determined by unpaired two-tailed Student's t-test comparing non-stimulated to stimulated conditions, error = SEM, scale bar = 10 um.

- Submitted by
- Invitrogen Antibodies (provider)
- Main image

- Experimental details
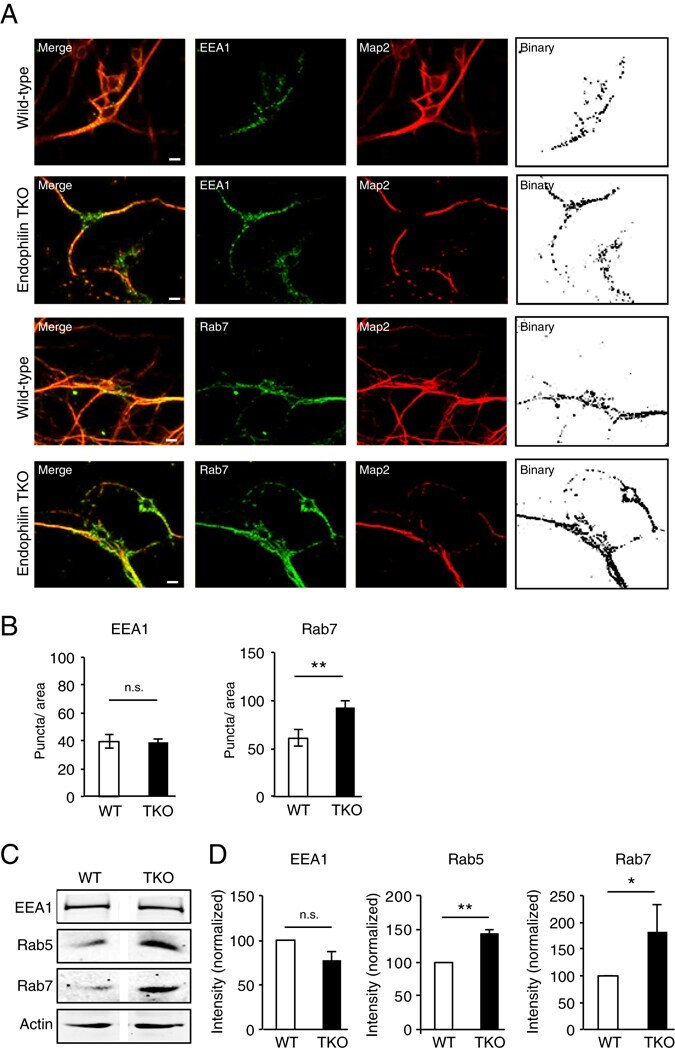
- Figure 1 Rab7-positive endosomes accumulate in EndophilinA TKO hippocampal neurons. ( A ) Identification of endosomal structures in wild-type and EndophilinA TKO neurons using immunocytochemistry to detect endogenous levels of the endosomal markers EEA1, and Rab7. Representative images of WT and Endophilin TKO hippocampal neurons stained for EEA1 and Rab7 are shown. Map2 antibody was used to label neurons. Scale bar = 10 mum; ( B ) Quantification of endosomal marker signal for EEA1 or Rab7 ( C ) normalized to area. Significance determined by unpaired two-tailed Student's t-test comparing each condition to control, n = 30 images per condition from 3 independent cell cultures; error = SEM, **p < 0.01. ( C ) Western blots showing levels of EEA1 and Rab7 in wild-type and EndophilinA TKO brain homogenates. ( D ) Quantitation of protein levels of EEA1 and Rab7 (F) in control and EndophilinA TKOs normalized to actin; n = 3 independent brain samples, error = SEM, *p < 0.05, **p < 0.01.
- Submitted by
- Invitrogen Antibodies (provider)
- Main image
- Experimental details
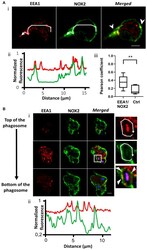
- FIGURE 2 NOX2 is present in some EEA1-positive endosomes that localize close to the phagosome during phagocytosis. (A) EEA1 (red) and NOX2 (green) were detected by immunofluorescence in resting PLB-985 WT cells using spinning disk confocal microscopy. (Ai) Representative images of single planes from a Z-stack. Scale bar = 3 mum. Three independent experiments. (Aii) Normalized fluorescence of EEA1 and NOX2 along the white arrow shown in Ai . Overlapping peaks of fluorescence indicate localization of NOX2 and EEA1 in the same structures. (Aiii) Co-localization of EEA1 and NOX2 estimated using the Pearson coefficient (PC) calculated with the JACoP plug-in in Image J. PCs correlating EEA1 and NOX2 images (EEA1/NOX2) were controlled by comparison with the PCs correlating the EEA1 image and the image of NOX2 rotated by 180deg (Control, Ctrl). Eight images from three independent experiments were analyzed. Each boxplot represents the inter-quartile range with the median, ** represents p < 0.01 (Mann Whitney test). (B) EEA1 (red) and NOX2 (green) were detected by immunofluorescence after 10 min of phagocytosis with opsonized Texas Red-zymosan. (Bi) Three planes from a series of Z-stack planes (0.5 mum). Some EEA1 endosomes were observed close to or at the phagosomes. Scale bar = 3 mum. Three independent experiments. (Bii) Normalized fluorescence of EEA1 and NOX2 along the white arrow showing some overlapping peaks of NOX2 and EEA1 fluorescence at the phagosome.
