Explore
 Validate
 Learn
Learn36-5200
antibody from Invitrogen Antibodies
Targeting: AURKB
Aik2, AIM-1, ARK2, AurB, IPL1, PPP1R48, STK12, STK5
 Western blot
 Immunocytochemistry
 Immunoprecipitation
Antibody data
- Antibody Data
- Antigen structure
- References [6]
- Comments [0]
- Validations
- Immunocytochemistry [2]
- Flow cytometry [1]
- Other assay [7]
Submit
Validation data
Reference
Comment
Report error
- Product number
- 36-5200 - Provider product page

- Provider
- Invitrogen Antibodies
- Product name
- Aurora B Polyclonal Antibody
- Antibody type
- Polyclonal
- Antigen
- Synthetic peptide
- Reactivity
- Human
- Host
- Rabbit
- Isotype
- IgG
- Vial size
- 100 μg
- Concentration
- 0.25 mg/mL
- Storage
- -20°C
Submitted references Artemisinin Mediates Its Tumor-Suppressive Activity in Hepatocellular Carcinoma Through Targeted Inhibition of FoxM1.
USP48 Governs Cell Cycle Progression by Regulating the Protein Level of Aurora B.
Nucleostemin rejuvenates cardiac progenitor cells and antagonizes myocardial aging.
Aurora kinase inhibitors reveal mechanisms of HURP in nucleation of centrosomal and kinetochore microtubules.
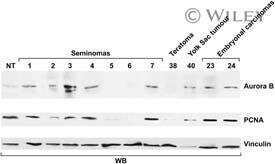
Aurora B expression in post-puberal testicular germ cell tumours.
Aurora B expression correlates with aggressive behaviour in glioblastoma multiforme.
Nandi D, Cheema PS, Singal A, Bharti H, Nag A
Frontiers in oncology 2021;11:751271
Frontiers in oncology 2021;11:751271
USP48 Governs Cell Cycle Progression by Regulating the Protein Level of Aurora B.
Antao AM, Kaushal K, Das S, Singh V, Suresh B, Kim KS, Ramakrishna S
International journal of molecular sciences 2021 Aug 7;22(16)
International journal of molecular sciences 2021 Aug 7;22(16)
Nucleostemin rejuvenates cardiac progenitor cells and antagonizes myocardial aging.
Hariharan N, Quijada P, Mohsin S, Joyo A, Samse K, Monsanto M, De La Torre A, Avitabile D, Ormachea L, McGregor MJ, Tsai EJ, Sussman MA
Journal of the American College of Cardiology 2015 Jan 20;65(2):133-47
Journal of the American College of Cardiology 2015 Jan 20;65(2):133-47
Aurora kinase inhibitors reveal mechanisms of HURP in nucleation of centrosomal and kinetochore microtubules.
Wu JM, Chen CT, Coumar MS, Lin WH, Chen ZJ, Hsu JT, Peng YH, Shiao HY, Lin WH, Chu CY, Wu JS, Lin CT, Chen CP, Hsueh CC, Chang KY, Kao LP, Huang CY, Chao YS, Wu SY, Hsieh HP, Chi YH
Proceedings of the National Academy of Sciences of the United States of America 2013 May 7;110(19):E1779-87
Proceedings of the National Academy of Sciences of the United States of America 2013 May 7;110(19):E1779-87
Aurora B expression in post-puberal testicular germ cell tumours.
Esposito F, Libertini S, Franco R, Abagnale A, Marra L, Portella G, Chieffi P
Journal of cellular physiology 2009 Nov;221(2):435-9
Journal of cellular physiology 2009 Nov;221(2):435-9
Aurora B expression correlates with aggressive behaviour in glioblastoma multiforme.
Zeng WF, Navaratne K, Prayson RA, Weil RJ
Journal of clinical pathology 2007 Feb;60(2):218-21
Journal of clinical pathology 2007 Feb;60(2):218-21
No comments: Submit comment
Supportive validation
- Submitted by
- Invitrogen Antibodies (provider)
- Main image
- Experimental details
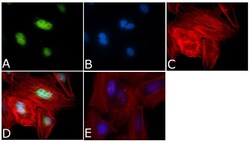
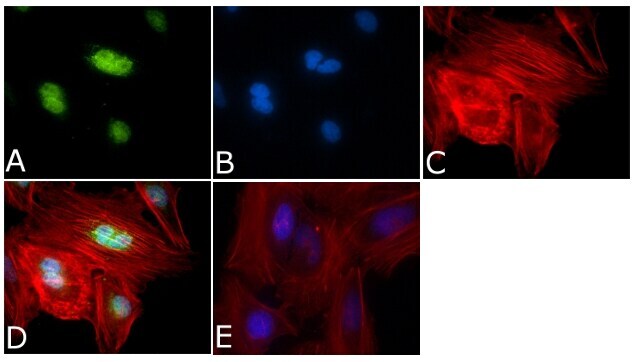
- Immunofluorescent analysis of Aurora B Antibody was done on 70% confluent log phase HeLa cells. The cells were fixed with 4% paraformaldehyde for 15 minutes, permeabilized with 0.25% Triton™ X-100 for 10 minutes, and blocked with 5% BSA for 1 hour at room temperature. The cells were labeled with Aurora B Antibody (Product # 36-5200) at 1µg/mL in 1% BSA and incubated for 3 hours at room temperature and then labeled with Alexa Fluor 488 Goat Anti-Rabbit IgG Secondary Antibody (Product # A-11008) at a dilution of 1:400 for 45 minutes at room temperature (Panel a: green). Nuclei (Panel b: blue) were stained with SlowFade® Gold Antifade Mountant with DAPI (Product # S36938). F-actin (Panel c: red) was stained with Alexa Fluor 594 Phalloidin (Product # A12381). Panel d is a merged image showing Nuclear localization. Panel e is a no primary antibody control. The images were captured at 40X magnification.

- Submitted by
- Invitrogen Antibodies (provider)
- Main image

- Experimental details
- Immunofluorescent analysis of Aurora B Antibody was done on 70% confluent log phase HeLa cells. The cells were fixed with 4% paraformaldehyde for 15 minutes, permeabilized with 0.25% Triton™ X-100 for 10 minutes, and blocked with 5% BSA for 1 hour at room temperature. The cells were labeled with Aurora B Antibody (Product # 36-5200) at 1µg/mL in 1% BSA and incubated for 3 hours at room temperature and then labeled with Alexa Fluor 488 Goat Anti-Rabbit IgG Secondary Antibody (Product # A-11008) at a dilution of 1:400 for 45 minutes at room temperature (Panel a: green). Nuclei (Panel b: blue) were stained with SlowFade® Gold Antifade Mountant with DAPI (Product # S36938). F-actin (Panel c: red) was stained with Alexa Fluor 594 Phalloidin (Product # A12381). Panel d is a merged image showing Nuclear localization. Panel e is a no primary antibody control. The images were captured at 40X magnification.
Supportive validation
- Submitted by
- Invitrogen Antibodies (provider)
- Main image
- Experimental details
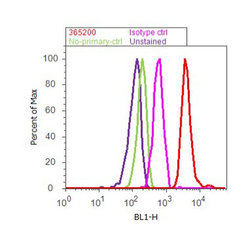
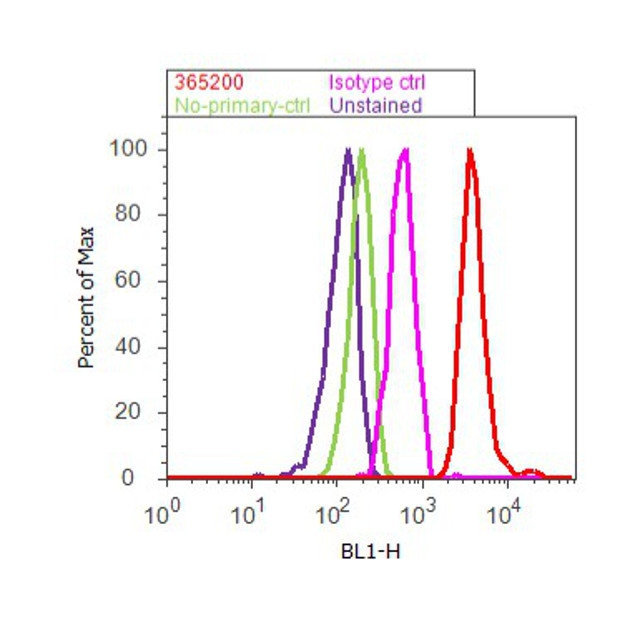
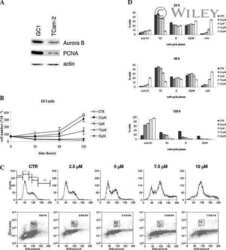
- Flow cytometry analysis of Aurora B was done on HeLa cells. Cells were fixed with 70% ethanol for 10 minutes, permeabilized with 0.25% Triton™ X-100 for 20 minutes, and blocked with 5% BSA for 30 minutes at room temperature. Cells were labeled with Aurora B Rabbit Polyclonal Antibody (365200, red histogram) or with rabbit isotype control (pink histogram) at 3-5 ug/million cells in 2.5% BSA. After incubation at room temperature for 2 hours, the cells were labeled with Alexa Fluor® 488 Goat Anti-Rabbit Secondary Antibody (A11008) at a dilution of 1:400 for 30 minutes at room temperature. The representative 10,000 cells were acquired and analyzed for each sample using an Attune® Acoustic Focusing Cytometer. The purple histogram represents unstained control cells and the green histogram represents no-primary-antibody control.
Supportive validation
- Submitted by
- Invitrogen Antibodies (provider)
- Main image
- Experimental details
- NULL

- Submitted by
- Invitrogen Antibodies (provider)
- Main image
- Experimental details
- NULL
- Submitted by
- Invitrogen Antibodies (provider)
- Main image

- Experimental details
- NULL
- Submitted by
- Invitrogen Antibodies (provider)
- Main image
- Experimental details
- NULL

- Submitted by
- Invitrogen Antibodies (provider)
- Main image
- Experimental details
- NULL
- Submitted by
- Invitrogen Antibodies (provider)
- Main image

- Experimental details
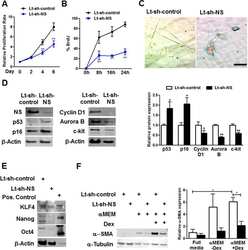
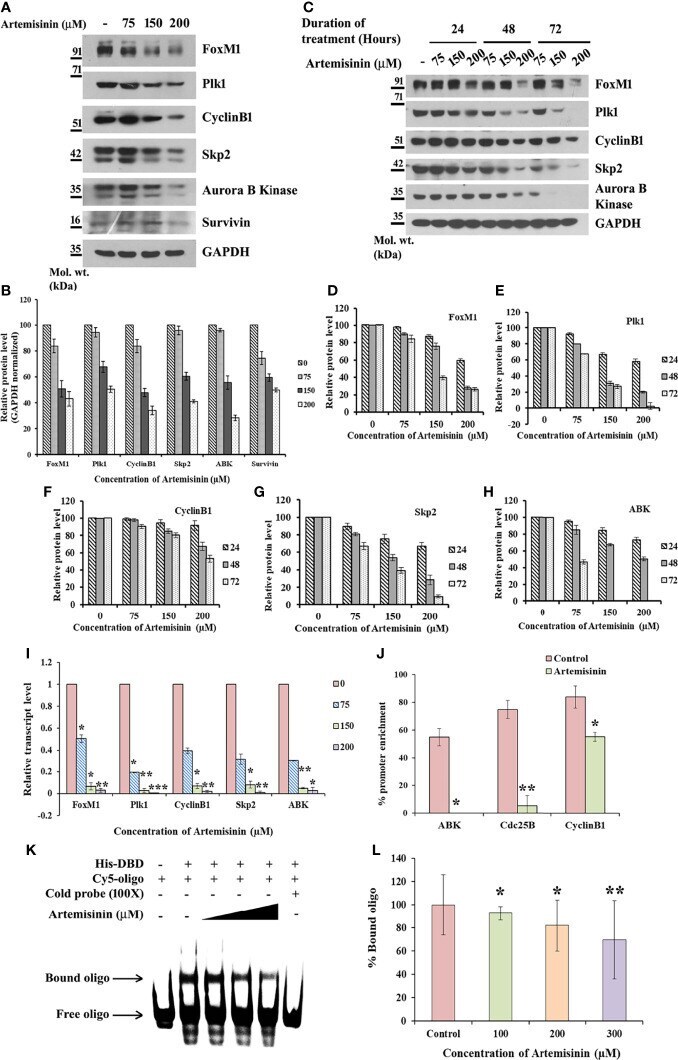
- Figure 2 Artemisinin impedes FoxM1 transcriptional activity. (A) Equal amounts of HepG2 cell lysates treated with Artemisinin for 48 h were subjected to SDS-PAGE and immunoblotting using antibodies specific for FoxM1, Plk1, CyclinB1, Skp2, Aurora B Kinase and Survivin. GAPDH was used as a loading control. (B) Densitometric analysis of the relative protein levels of FoxM1 antibody and its targets using ImageJ, normalized to GAPDH. (C) HepG2 cells were treated with Artemisinin for 24, 48 and 72 h followed by SDS-PAGE and western blotting for FoxM1 and its downstream effectors with GAPDH as a loading control. (D-H) Graphical representation of the relative protein levels of FoxM1 and its targets quantified using ImageJ. (I) Total RNA was isolated from HepG2 cells treated with Artemisinin using TriZOL. qRT-PCR was performed using SYBR Green assay. The fold mRNA change has been represented graphically, normalized to GAPDH. (J) HepG2 cells were treated with 100 uM Artemisinin for 24 h followed by ChIP using anti-FoxM1 anti-body and PCR with gene-specific primers. GAPDH served as an internal control. The percent promoter occupancy by FoxM1 is represented graphically. (K) Purified FoxM1-DBD was mixed with the Cy5-labeled DNA probe and Artemisinin added to the reaction in increasing concentrations. Representative EMSA image is shown. (L) Quantification of the percent bound oligo is presented. * p < 0.05, ** p < 0.01, and *** p < 0.001. All data are expressed as the means +- standard de
- Submitted by
- Invitrogen Antibodies (provider)
- Main image
- Experimental details
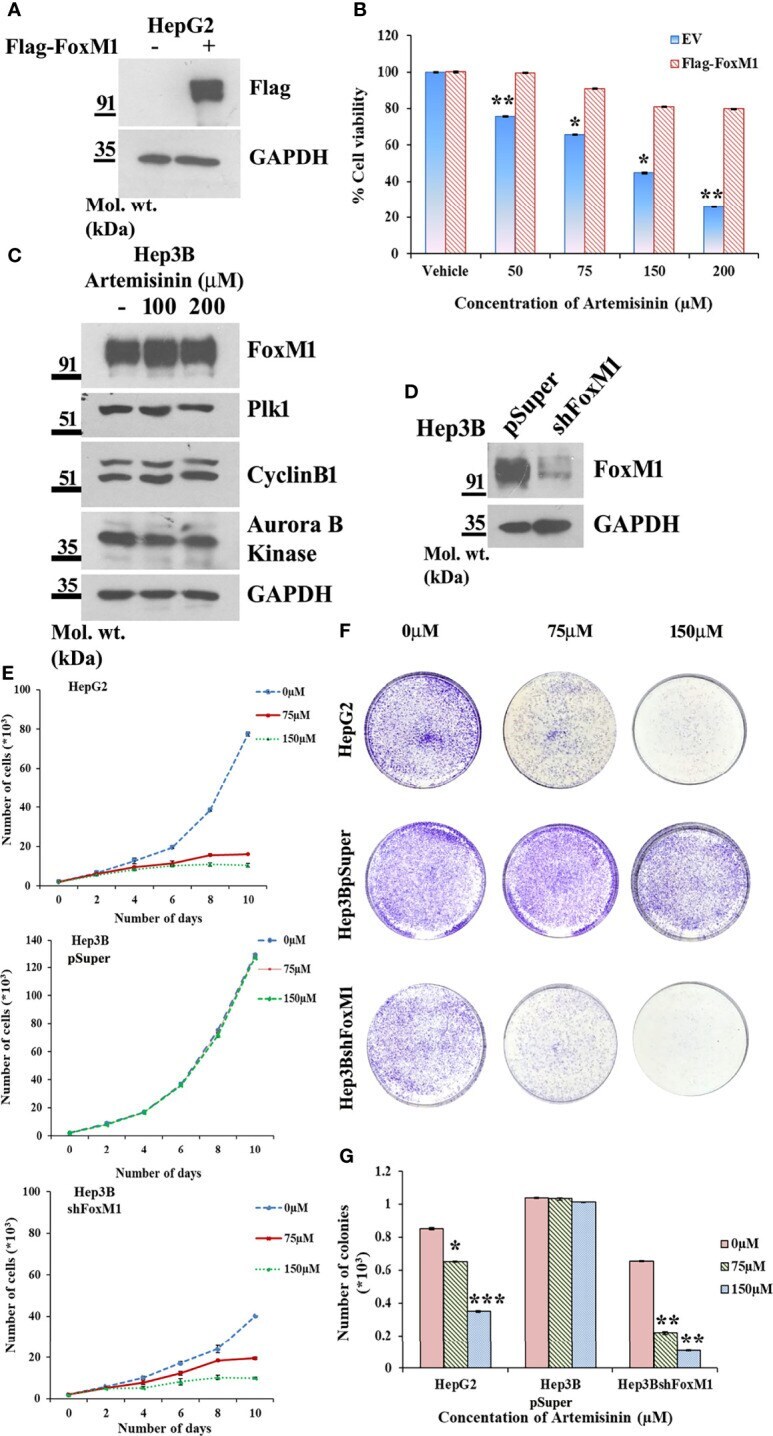
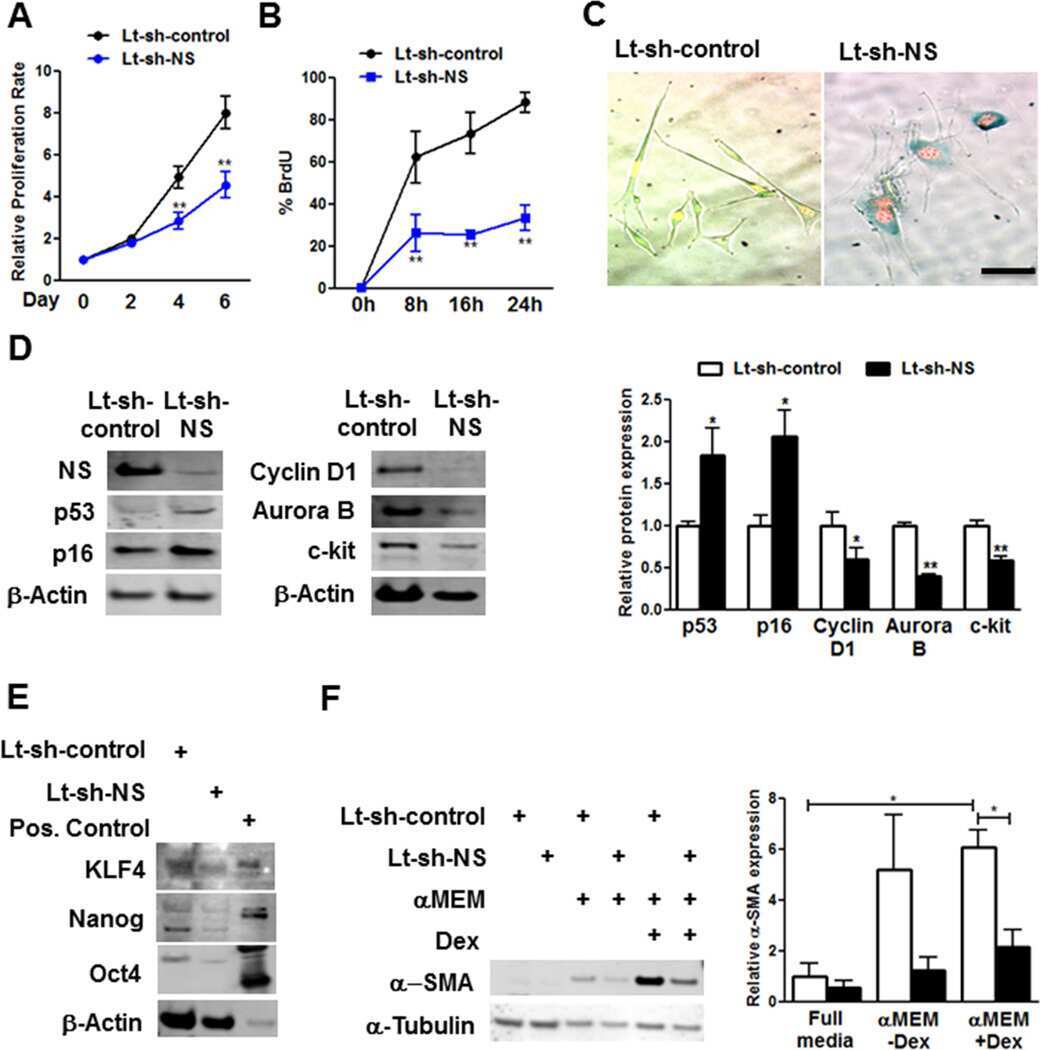
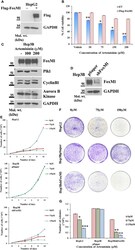
- Figure 3 FoxM1 level contributes to Artemisinin-mediated mitigation of cancerous properties of HCC cells. (A) HepG2 cells were transiently transfected with either empty vector or Flag-FoxM1. Equal amount of whole cell lysate was subjected to SDS-PAGE and subsequent immunoblotting for FoxM1. GAPDH was used as a loading control. (B) HepG2 cells overexpressing either empty vector or Flag-FoxM1 were treated with increasing doses of Artemisinin for 48 h and cell viability was examined using MTT assay. (C) Hep3B cells were treated with either vehicle or Artemisinin (100 and 200 uM) for 48 h. Equal amounts of whole cell lysates were subjected to SDS-PAGE and western blotting with antibodies specific for FoxM1 and its transcriptional targets, such as Plk1, cyclinB1 and Aurora B kinase. GAPDH was used as a loading control. (D) Immunoblotting showing the efficiency of FoxM1 knockdown in Hep3BshFoxM1 stable cell line relative to control Hep3BpSuper cells. (E) The comparative proliferative rates of HepG2, Hep3BpSuper and Hep3BshFoxM1 cells following exposure to Artemisinin for 48 h. (F) Representative images and (G) graphical presentation of the stained colonies formed by Artemisinin-treated cells after clonogenic assay. * p < 0.05, ** p < 0.01 and *** p < 0.001. All data are expressed as the means +- standard deviations from triplicate experiments. The two-tailed Student's t -test was used to determine whether the differences between vehicle-treated set and Artemisinin-treated set were