Explore
 Validate
 Learn
Learn Western blot
 Other assay
Antibody data
- Antibody Data
- Antigen structure
- References [1]
- Comments [0]
- Validations
- Other assay [1]
Submit
Validation data
Reference
Comment
Report error
- Product number
- 14-5158-82 - Provider product page

- Provider
- Invitrogen Antibodies
- Product name
- cGAS Monoclonal Antibody (HGAYN), eBioscience™
- Antibody type
- Monoclonal
- Antigen
- Recombinant full-length protein
- Description
- Description: This HGAYN monoclonal antibody recognizes human cGAS. This antibody works on reduced lysates. Applications Reported: This HGAYN antibody has been reported for use in Western Blot analysis. Applications Tested: This HGAYN antibody has been tested by western blot of HeLa cell line. This may be used at less than or equal to 2 µg/mL.
- Reactivity
- Human
- Host
- Mouse
- Isotype
- IgG
- Antibody clone number
- HGAYN
- Vial size
- 100 µg
- Concentration
- 0.5 mg/mL
- Storage
- 4° C, do not freeze
Submitted references G3BP1 controls the senescence-associated secretome and its impact on cancer progression.
Omer A, Barrera MC, Moran JL, Lian XJ, Di Marco S, Beausejour C, Gallouzi IE
Nature communications 2020 Oct 5;11(1):4979
Nature communications 2020 Oct 5;11(1):4979
No comments: Submit comment
Supportive validation
- Submitted by
- Invitrogen Antibodies (provider)
- Main image
- Experimental details
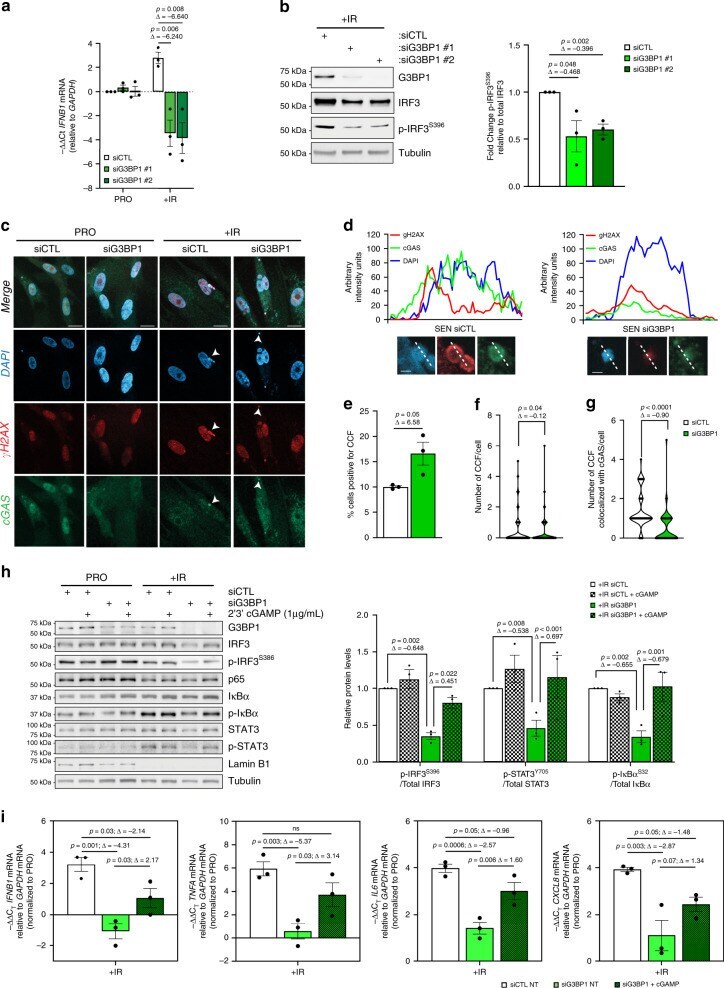
- Fig. 4 G3BP1 loss inhibits cGAS signaling required for SASP activation in senescent cells. WI-38 cells were treated with siRNA against G3BP1 (siG3BP1 #1 and #2) or scrambled control (siCTL) and assessed during proliferative stage (PRO) and 8-day post-ionizing radiation (+IR) a RNA was extracted and assayed by RT-qPCR using primers against IFNB1 mRNA. The data are representative of three independent experiments (two-tailed unpaired Student's t test). b (left) Lysates obtained from WI-38 cells +IR cell were subjected to western blot analysis against indicated proteins. (right) Quantifications represent a mean of relative protein levels from three independent experiments +- s.e.m (two-tailed unpaired Student's t test). c Immunofluorescence analysis against gammaH2AX and cGAS. DAPI staining was used to visualize nuclei. White arrows indicate CCF. Scale bar, 20 mum. d Graphs represent intensity profile for CCFs in (left) +IR siCTL and (right) +IR siG3BP1 treated WI-38 cells after immunofluorescence against gammaH2AX, cGAS, and DAPI. Plot is representative of foci shown in ( c ). Scale bar, 2 mum. e - g Graph of % SEN cells positive for CCF ( e ), number of CCFs present in SEN cells +- s.e.m ( f ), and number of CCFs present in SEN cells colocalized with cGAS ( g ). The data are representative of three independent experiments (two-tailed unpaired S tudent's t test, exact