 Explore
 Validate
 Learn
Learn Immunocytochemistry
Antibody data
- Antibody Data
- Antigen structure
- References [4]
- Comments [0]
- Validations
- Immunocytochemistry [1]
- Other assay [5]
Submit
Validation data
Reference
Comment
Report error
- Product number
- 53-9859-80 - Provider product page

- Provider
- Invitrogen Antibodies
- Product name
- Snail1 Monoclonal Antibody (20C8), Alexa Fluor™ 488, eBioscience™
- Antibody type
- Monoclonal
- Antigen
- Other
- Description
- Description: The monoclonal antibody 20C8 recognizes human Snail1, a 29 kDa zinc finger transcription factor. Snail1 and Slug both belong to a family of transcription factors that are responsible for inducing epithelial to mesenchymal transition (EMT) during normal organ development and tumor progression. Snail1 expression is localized to both the cytoplasm and nucleus and functions as a transcriptional repressor of E-cadherin, claudins, occludin, and desmoplakin. During embryonic development, Snail1 is localized to the mesoderm, while in the adult, expression is inducible and is usually limited to activated fibroblasts and some mesenchymal cells. Overexpression of Snail1 has been found in carcinomas and fibrosarcomas and may be used as an early marker for EMT.
- Conjugate
- Green dye
- Antibody clone number
- 20C8
- Concentration
- 0.5 mg/mL
Submitted references Low-Dose Albendazole Inhibits Epithelial-Mesenchymal Transition of Melanoma Cells by Enhancing Phosphorylated GSK-3β/Tyr216 Accumulation.
MiR-195 inhibits the ubiquitination and degradation of YY1 by Smurf2, and induces EMT and cell permeability of retinal pigment epithelial cells.
EIF3H promotes aggressiveness of esophageal squamous cell carcinoma by modulating Snail stability.
HOXC10 promotes migration and invasion via the WNT-EMT signaling pathway in oral squamous cell carcinoma.
He Z, Lei S, Liang F, Tan L, Zhang W, Xie L, Zheng H, Lu Y
Journal of oncology 2021;2021:4475192
Journal of oncology 2021;2021:4475192
MiR-195 inhibits the ubiquitination and degradation of YY1 by Smurf2, and induces EMT and cell permeability of retinal pigment epithelial cells.
Fu SH, Lai MC, Zheng YY, Sun YW, Qiu JJ, Gui F, Zhang Q, Liu F
Cell death & disease 2021 Jul 15;12(7):708
Cell death & disease 2021 Jul 15;12(7):708
EIF3H promotes aggressiveness of esophageal squamous cell carcinoma by modulating Snail stability.
Guo X, Zhu R, Luo A, Zhou H, Ding F, Yang H, Liu Z
Journal of experimental & clinical cancer research : CR 2020 Aug 31;39(1):175
Journal of experimental & clinical cancer research : CR 2020 Aug 31;39(1):175
HOXC10 promotes migration and invasion via the WNT-EMT signaling pathway in oral squamous cell carcinoma.
Dai BW, Yang ZM, Deng P, Chen YR, He ZJ, Yang X, Zhang S, Wu HJ, Ren ZH
Journal of Cancer 2019;10(19):4540-4551
Journal of Cancer 2019;10(19):4540-4551
No comments: Submit comment
Supportive validation
- Submitted by
- Invitrogen Antibodies (provider)
- Main image
- Experimental details
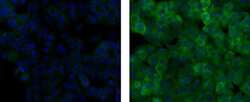
- Immunocytochemistry on fixed and permeabilized MCF7 cells using 20 µg/mL Mouse IgG2a Alexa Fluor® 488 Isotype Control (left) or 20 µg/mL Anti-Human Snail1 Alexa Fluor® 488 (right). Nuclei are stained with DAPI.
- Conjugate
- Green dye

Supportive validation
- Submitted by
- Invitrogen Antibodies (provider)
- Main image
- Experimental details
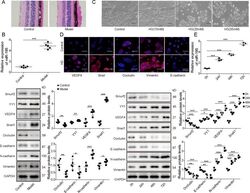
- Fig. 1 The expression of miR-195, YY1, VEGFA, Snail1, and Smurf2 in STZ-induced diabetic mice and HG-stimulated ARPE-19 cells. A The pathology of retinas from control or model group was analyzed by HE staining. B MiR-195, Smurf2, YY1, VEGFA, Snail1, Occludin, E-cadherin, N-cadherin, and Vimentin levels were detected via qRT-PCR or western blotting in the retinas from control or model group. C Cell morphology was observed under microscope in ARPE-19 cells after stimulation of different doses of glucose. Magnification: x100. D VEGFA, Snail1, Occludin, E-cadherin, and Vimentin levels were examined by immunofluorescence in ARPE-19 cells in control or HG group. Magnification: x200. E MiR-195, Smurf2, YY1, VEGFA, Snail1, Occludin, E-cadherin, N-cadherin, and Vimentin levels were examined by qRT-PCR or western blotting in ARPE-19 cells after 0, 24, 48, and 72 h of HG exposure. For each analysis, three technical replicates were performed and three biological independently performed replicates are included, * p < 0.05, ** p < 0.01, *** p < 0.001.
- Conjugate
- Green dye

- Submitted by
- Invitrogen Antibodies (provider)
- Main image
- Experimental details
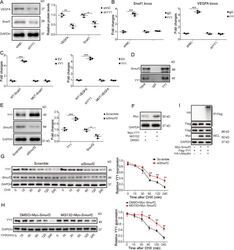
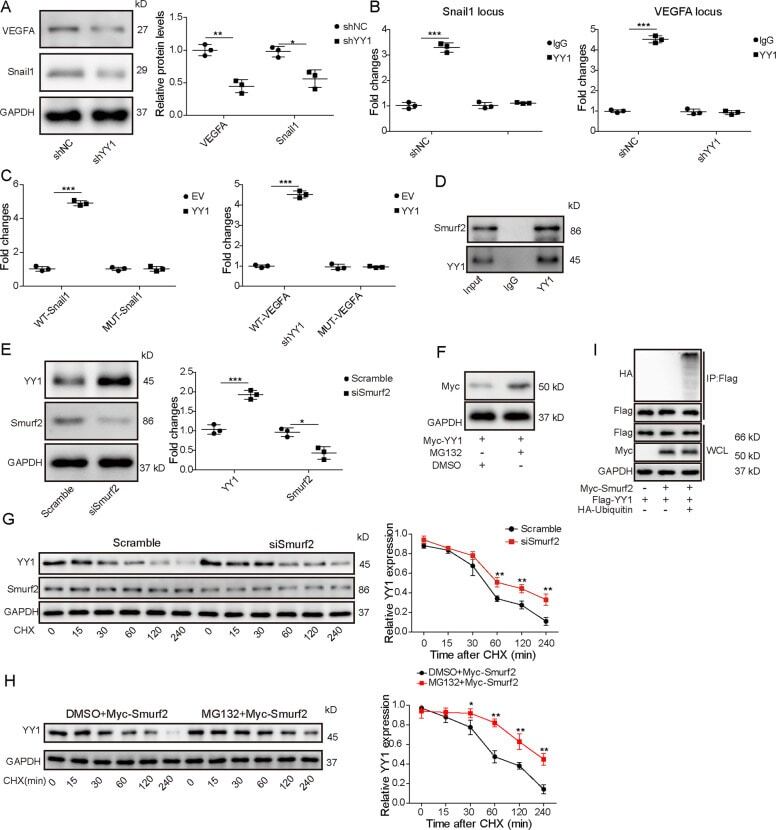
- Fig. 4 YY1 binds with VEGFA and Snail1, and ubiquitination and degradation of YY1 are mediated by Smurf2. A VEGFA and Snail1 levels were detected by western blotting in ARPE-19 cells transfected with shNC or shYY1. B The binding of YY1 on the promoter of VEGFA and Snail1 was analyzed by ChIP in ARPE-19 cells transfected with shNC or shYY1. C Luciferase activity was measured in ARPE-19 cells co-transfected with empty vector (EV) or YY1 overexpression vector and WT-Snail1, Mut-Snail1, WT-VEGFA, or Mut-VEGFA. D Smurf2 and YY1 levels were detected by western blotting after Co-IP of YY1 antibody. E YY1 and Smurf2 levels were measured via western blotting in ARPE-19 cells transfected with siSmurf2 or Scramble. F Western blotting analysis of YY1 levels in WCL derived from HEK293T cells with or without MG132 treatment. G YY1 and Smurf2 levels were examined by western blotting in ARPE-19 cells transfected with siSmurf2 or Scramble before treatment of cycloheximide (CHX) for different time points. H Smurf2-overexpressed HEK293T cells were treated with CHX for 0, 15, 30, 60, 120, and 240 min in the presence of MG132 (a proteasome inhibitor), followed by the detection of YY1 using western blotting. I Expression vectors encoding Flag-YY1 and HA-ubiquitin were co-transfected into HEK293T cells transfecting Myc-Smurf2 and cell lysates were subjected for Co-IP using anti-Flag, which was followed by western blotting using anti-HA antibody. For each analysis, three technical replicates were pe
- Conjugate
- Green dye
- Submitted by
- Invitrogen Antibodies (provider)
- Main image
- Experimental details
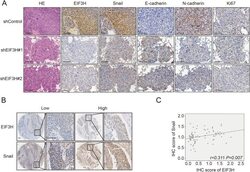
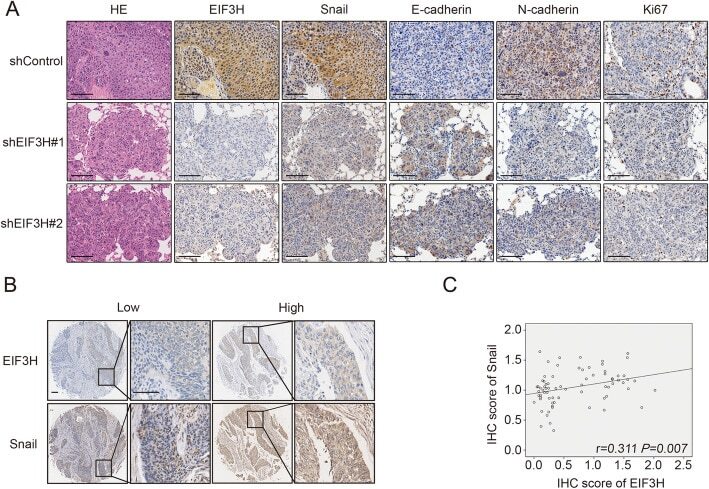
- Fig. 7 EIF3H and Snail levels positively correlate in ESCC. a Representative HE staining, EIF3H, Snail, E-cadherin, N-cadherin and Ki67 immunohistochemistry staining in lung tissues of shControl, shEIF3H#1 and shEIF3H#2 groups described in Fig. 3 ( e ). Scale bars, 100 mum. b Representative staining of EIF3H and Snail in ESCC samples. Scale bars, 100 mum. c The positive correlation was obtained in ESCC samples between EIF3H and Snail protein expression
- Conjugate
- Green dye
- Submitted by
- Invitrogen Antibodies (provider)
- Main image
- Experimental details
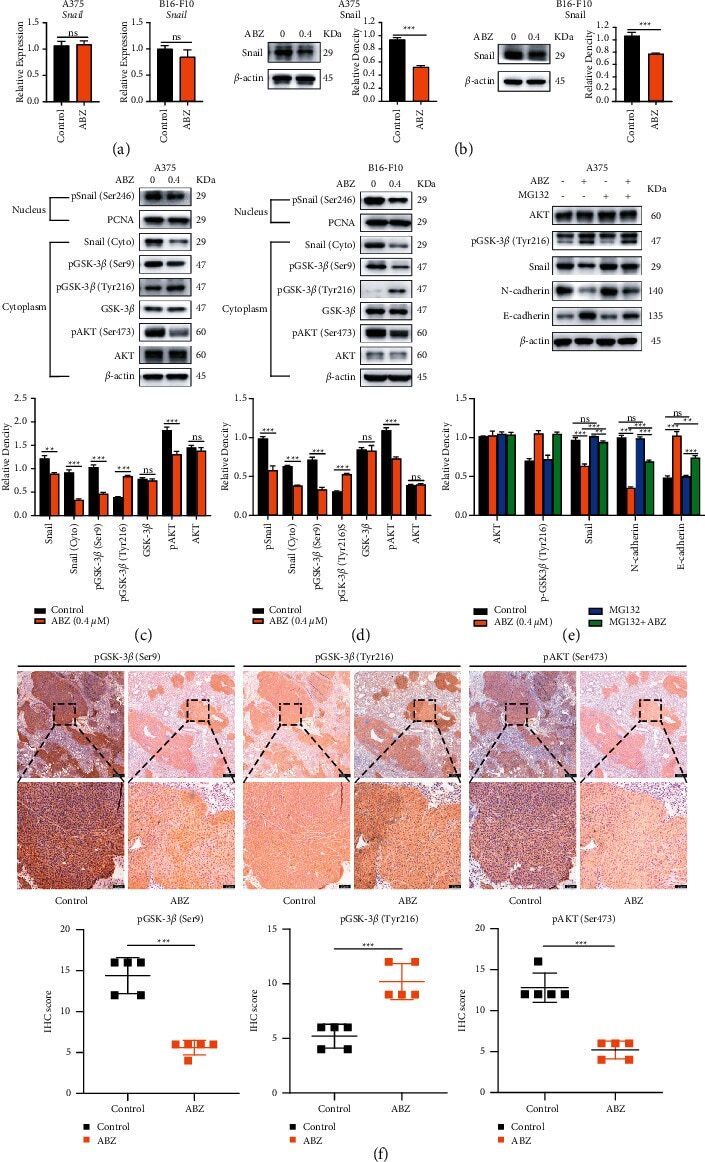
- Figure 4 ABZ treatment downregulates the snail expression in melanoma cells by increasing the accumulation of phosphorylated GSK-3 beta /Tyr216. (a) The relative transcription levels of Snail in the ABZ-treated (0.4 mu M) and control groups of A375 (left) and B16-F10 (right) melanoma cells were measured by RT-qPCR, with beta -actin as the internal control. (b) The expression of transcription factor Snail in A375 (left) and B16-F10 (right) cells was detected by western blot analysis, with beta -actin as the internal reference protein. (c-d) The expression levels of cytoplasmic proteins AKT, pAKT, GSK-3 beta , pGSK-3 beta (Ser9/Tyr216) and Snail, and nuclear protein pSnail in A375 and B16-F10 cells were also determined by western blotting, with beta -actin and PCNA as the internal controls for the cytoplasmic and nuclear proteins, respectively. The histograms show the relative density of AKT/pAKT, GSK-3 beta /pGSK-3 beta (Ser9/Tyr216), and Snail/p-Snail. (e) A375 cells were cotreated with or without MG132 and 0.4 mu M ABZ for 24 h western blot (up) was used to detect the expression levels of AKT, pGSK-3 beta /Tyr216, Snail, N-cadherin, and E-cadherin in the cytoplasm of A375 cells. The histogram (bottom) shows the relative density of AKT, pGSK-3 beta /Tyr216, Snail, E-cadherin, and N-cadherin. (f) Histogram showing the relative expression intensity of pGSK-3 beta (Ser9/Tyr216) and pAKT after immunohistochemical staining of mouse metastatic lung cancer tissues. Scale bars = 100
- Conjugate
- Green dye
- Submitted by
- Invitrogen Antibodies (provider)
- Main image
- Experimental details
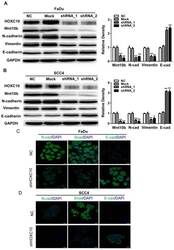
- Figure 5 Knockdown of HOXC10 suppresses the WNT-EMT process in OSCC cell lines. (A). FaDu cells and (B) SCC4 cells were treated with shHOXC10, and Wnt10B, N-cadherin, E-cadherin, and Vimentin levels were determined. GAPDH served as an internal standard for protein loading. (C). FaDu cells and (D) SCC4 cells were treated with negative control (NC) and shHOXC10; representative immunofluorescence is shown, and fluorescence of N-Cadherin, Snail and E-cadherin was quantified; scale bar: 20 mum. The data are presented as the means +- SEM. **P
- Conjugate
- Green dye
