 Explore
 Validate
 Learn
Learn Western blot
 Immunocytochemistry
Antibody data
- Antibody Data
- Antigen structure
- References [44]
- Comments [0]
- Validations
- Immunocytochemistry [8]
- Immunohistochemistry [3]
- Other assay [33]
Submit
Validation data
Reference
Comment
Report error
- Product number
- PA1-954A - Provider product page

- Provider
- Invitrogen Antibodies
- Product name
- VDAC Polyclonal Antibody
- Antibody type
- Polyclonal
- Antigen
- Synthetic peptide
- Description
- PA1-954A detects voltage-dependent anion channel (VDAC) from human, non-human primates, mouse, and rat samples. PA1-954A has been successfully used in IF/ICC, IHC (P) and Western blot procedures. By Western blot, this antibody detects a single, prominent ~31 kDa band representing VDAC from rat heart extract. PA1-954A immunizing peptide corresponds to the C-terminal amino acid residues 185-197 of human VDAC3. This sequence is completely conserved between isoforms 1, 2 and 3 of human VDAC and PA1-954A detects endogenous levels of total VDAC. PA1-954A immunizing peptide (Cat. # PEP-082) is available for use in neutralization and control experiments.
- Reactivity
- Human, Mouse, Rat
- Host
- Rabbit
- Isotype
- IgG
- Vial size
- 100 μg
- Concentration
- 1 mg/mL
- Storage
- -20°C, Avoid Freeze/Thaw Cycles
Submitted references Posttranslational regulation of mitochondrial frataxin and identification of compounds that increase frataxin levels in Friedreich's ataxia.
Cytosolic GDH1 degradation restricts protein synthesis to sustain tumor cell survival following amino acid deprivation.
DRP1-Mediated Mitochondrial Fission Regulates Lung Epithelial Response to Allergen.
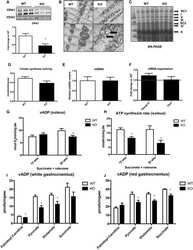
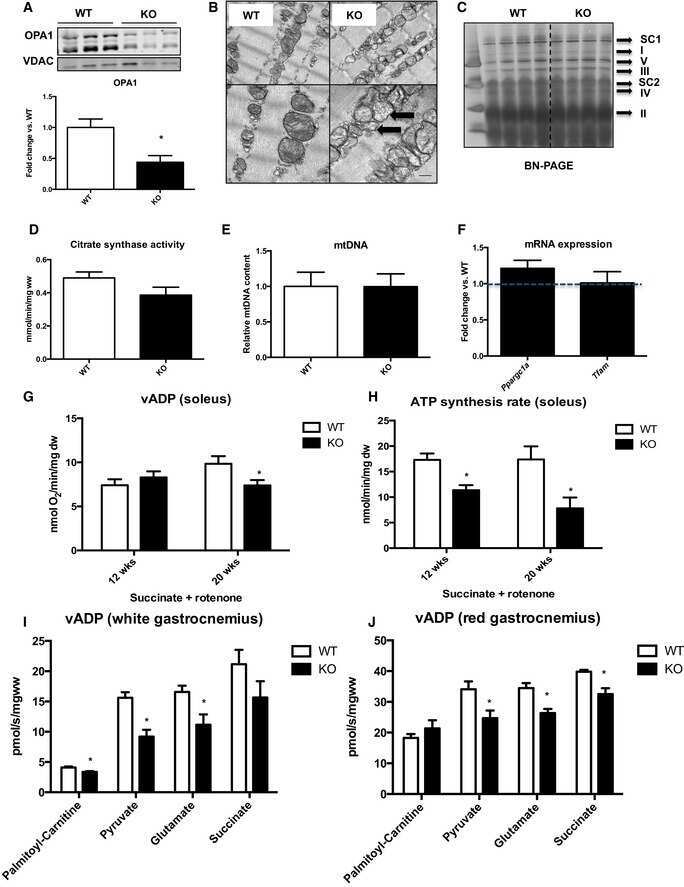
OPA1 deletion in brown adipose tissue improves thermoregulation and systemic metabolism via FGF21.
BOK controls apoptosis by Ca(2+) transfer through ER-mitochondrial contact sites.
The Phosphorylation Status of Drp1-Ser637 by PKA in Mitochondrial Fission Modulates Mitophagy via PINK1/Parkin to Exert Multipolar Spindles Assembly during Mitosis.
Hyperoxygenation Ameliorates Stress-induced Neuronal and Behavioral Deficits.
Maintaining Myocardial Glucose Utilization in Diabetic Cardiomyopathy Accelerates Mitochondrial Dysfunction.
Neuroinflammation trajectories precede cognitive impairment after experimental meningitis-evidence from an in vivo PET study.
Potential role of cartilage oligomeric matrix protein in the modulation of pulmonary arterial smooth muscle superoxide by hypoxia.
3,5 Diiodo-l-Thyronine (T₂) Promotes the Browning of White Adipose Tissue in High-Fat Diet-Induced Overweight Male Rats Housed at Thermoneutrality.
Hepatic HKDC1 Expression Contributes to Liver Metabolism.
Identification of a mitofusin specificity region that confers unique activities to Mfn1 and Mfn2.
Intracellular glycolysis in brown adipose tissue is essential for optogenetically induced nonshivering thermogenesis in mice.
OPA1 deficiency promotes secretion of FGF21 from muscle that prevents obesity and insulin resistance.
The mitochondrial translation machinery as a therapeutic target in Myc-driven lymphomas.
Mitochondrial targeting of XJB-5-131 attenuates or improves pathophysiology in HdhQ150 animals with well-developed disease phenotypes.
Cellular and subcellular oxidative stress parameters following severe spinal cord injury.
Mitochondrial-targeted catalase is good for the old mouse proteome, but not for the young: 'reverse' antagonistic pleiotropy?
Intramembrane protease PARL defines a negative regulator of PINK1- and PARK2/Parkin-dependent mitophagy.
Lipid-induced NOX2 activation inhibits autophagic flux by impairing lysosomal enzyme activity.
Mitochondria-associated microRNAs in rat hippocampus following traumatic brain injury.
Parkinson-causing α-synuclein missense mutations shift native tetramers to monomers as a mechanism for disease initiation.
Inhibition of apoptotic Bax translocation to the mitochondria is a central function of parkin.
Thiol changes during epididymal maturation: a link to flagellar angulation in mouse spermatozoa?
Maintaining PGC-1α expression following pressure overload-induced cardiac hypertrophy preserves angiogenesis but not contractile or mitochondrial function.
Concentration dependent effect of calcium on brain mitochondrial bioenergetics and oxidative stress parameters.
Induction of mitochondrial dysfunction by poly(ADP-ribose) polymer: implication for neuronal cell death.
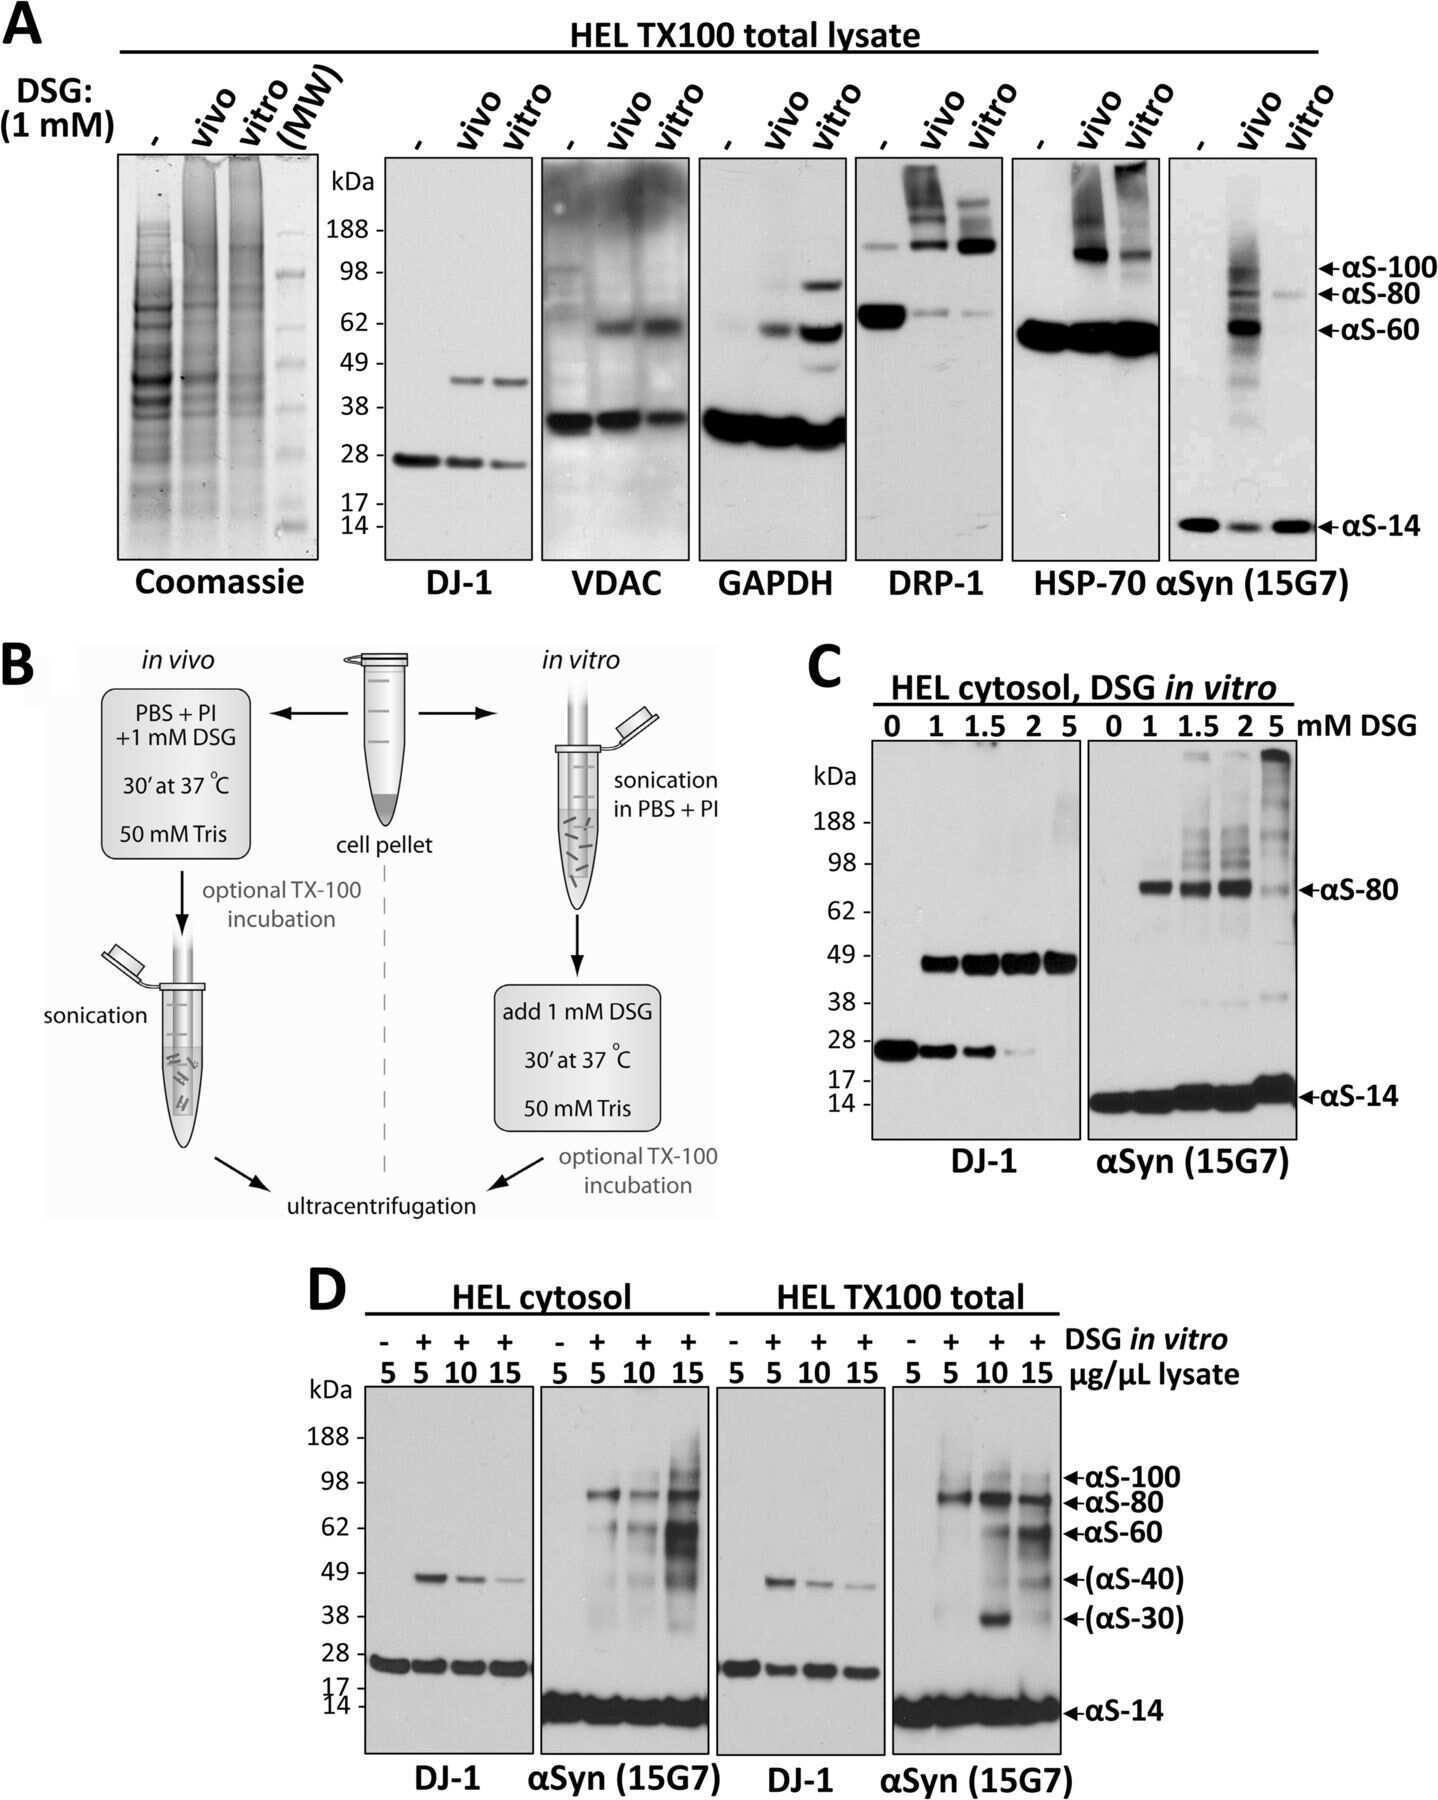
In vivo cross-linking reveals principally oligomeric forms of α-synuclein and β-synuclein in neurons and non-neural cells.
VCP is essential for mitochondrial quality control by PINK1/Parkin and this function is impaired by VCP mutations.
A novel WD-repeat protein, WDR26, inhibits apoptosis of cardiomyocytes induced by oxidative stress.
Amidoxime reductase system containing cytochrome b5 type B (CYB5B) and MOSC2 is of importance for lipid synthesis in adipocyte mitochondria.
Role of protein kinase C in phospholemman mediated regulation of α₂β₁ isozyme of Na⁺/K⁺-ATPase in caveolae of pulmonary artery smooth muscle cells.
Alignment of sarcoplasmic reticulum-mitochondrial junctions with mitochondrial contact points.
Mislocalization of the E3 ligase, β-transducin repeat-containing protein 1 (β-TrCP1), in glioblastoma uncouples negative feedback between the pleckstrin homology domain leucine-rich repeat protein phosphatase 1 (PHLPP1) and Akt.
Calcium-dependent cleavage of the Na(+)/Ca(2+) exchanger by m-calpain in isolated endoplasmic reticulum.
m-Calpain-mediated cleavage of Na+/Ca2+ exchanger-1 in caveolae vesicles isolated from pulmonary artery smooth muscle.
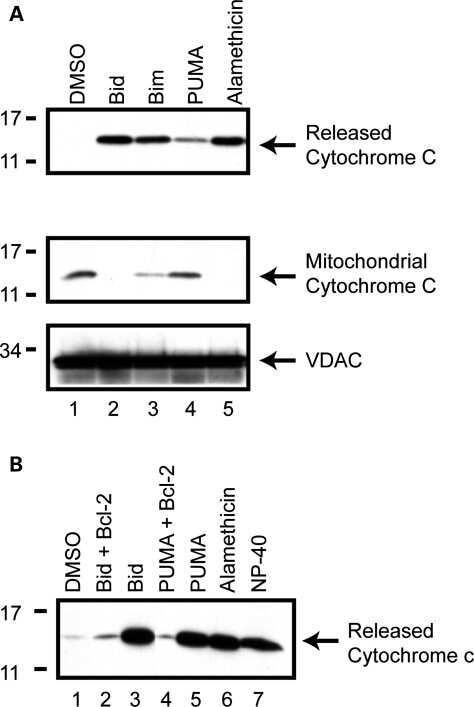
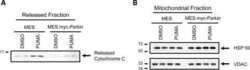
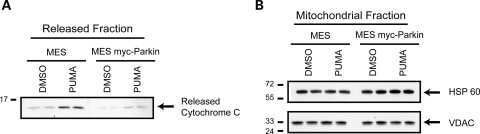
Parkin selectively alters the intrinsic threshold for mitochondrial cytochrome c release.
Ca2+ influx mechanisms in caveolae vesicles of pulmonary smooth muscle plasma membrane under inhibition of alpha2beta1 isozyme of Na+/K+-ATPase by ouabain.
Physical coupling supports the local Ca2+ transfer between sarcoplasmic reticulum subdomains and the mitochondria in heart muscle.
Pink1 Parkinson mutations, the Cdc37/Hsp90 chaperones and Parkin all influence the maturation or subcellular distribution of Pink1.
Ca2+-dependent control of the permeability properties of the mitochondrial outer membrane and voltage-dependent anion-selective channel (VDAC).
Pancreatic beta cells lack a low glucose and O2-inducible mitochondrial protein that augments cell survival.
Altered cholesterol metabolism in Niemann-Pick type C1 mouse brains affects mitochondrial function.
Hackett PT, Jia X, Li L, Ward DM
The Journal of biological chemistry 2022 Jun;298(6):101982
The Journal of biological chemistry 2022 Jun;298(6):101982
Cytosolic GDH1 degradation restricts protein synthesis to sustain tumor cell survival following amino acid deprivation.
Shao J, Shi T, Yu H, Ding Y, Li L, Wang X, Wang X
The EMBO journal 2021 Oct 18;40(20):e107480
The EMBO journal 2021 Oct 18;40(20):e107480
DRP1-Mediated Mitochondrial Fission Regulates Lung Epithelial Response to Allergen.
Bruno SR, Kumar A, Mark ZF, Chandrasekaran R, Nakada E, Chamberlain N, Mihavics B, Walzer J, Cahoon J, Dixon AE, Cunniff B, Anathy V
International journal of molecular sciences 2021 Oct 15;22(20)
International journal of molecular sciences 2021 Oct 15;22(20)
OPA1 deletion in brown adipose tissue improves thermoregulation and systemic metabolism via FGF21.
Pereira RO, Marti A, Olvera AC, Tadinada SM, Bjorkman SH, Weatherford ET, Morgan DA, Westphal M, Patel PH, Kirby AK, Hewezi R, Bùi Trân W, García-Peña LM, Souvenir RA, Mittal M, Adams CM, Rahmouni K, Potthoff MJ, Abel ED
eLife 2021 May 4;10
eLife 2021 May 4;10
BOK controls apoptosis by Ca(2+) transfer through ER-mitochondrial contact sites.
Carpio MA, Means RE, Brill AL, Sainz A, Ehrlich BE, Katz SG
Cell reports 2021 Mar 9;34(10):108827
Cell reports 2021 Mar 9;34(10):108827
The Phosphorylation Status of Drp1-Ser637 by PKA in Mitochondrial Fission Modulates Mitophagy via PINK1/Parkin to Exert Multipolar Spindles Assembly during Mitosis.
Ko HJ, Tsai CY, Chiou SJ, Lai YL, Wang CH, Cheng JT, Chuang TH, Huang CF, Kwan AL, Loh JK, Hong YR
Biomolecules 2021 Mar 13;11(3)
Biomolecules 2021 Mar 13;11(3)
Hyperoxygenation Ameliorates Stress-induced Neuronal and Behavioral Deficits.
Choi J, Kwon HJ, Seoh JY, Han PL
Experimental neurobiology 2021 Dec 31;30(6):415-429
Experimental neurobiology 2021 Dec 31;30(6):415-429
Maintaining Myocardial Glucose Utilization in Diabetic Cardiomyopathy Accelerates Mitochondrial Dysfunction.
Wende AR, Schell JC, Ha CM, Pepin ME, Khalimonchuk O, Schwertz H, Pereira RO, Brahma MK, Tuinei J, Contreras-Ferrat A, Wang L, Andrizzi CA, Olsen CD, Bradley WE, Dell'Italia LJ, Dillmann WH, Litwin SE, Abel ED
Diabetes 2020 Oct;69(10):2094-2111
Diabetes 2020 Oct;69(10):2094-2111
Neuroinflammation trajectories precede cognitive impairment after experimental meningitis-evidence from an in vivo PET study.
Giridharan VV, Collodel A, Generoso JS, Scaini G, Wassather R, Selvaraj S, Hasbun R, Dal-Pizzol F, Petronilho F, Barichello T
Journal of neuroinflammation 2020 Jan 4;17(1):5
Journal of neuroinflammation 2020 Jan 4;17(1):5
Potential role of cartilage oligomeric matrix protein in the modulation of pulmonary arterial smooth muscle superoxide by hypoxia.
Yu H, Alruwaili N, Hu B, Kelly MR, Zhang B, Sun D, Wolin MS
American journal of physiology. Lung cellular and molecular physiology 2019 Nov 1;317(5):L569-L577
American journal of physiology. Lung cellular and molecular physiology 2019 Nov 1;317(5):L569-L577
3,5 Diiodo-l-Thyronine (T₂) Promotes the Browning of White Adipose Tissue in High-Fat Diet-Induced Overweight Male Rats Housed at Thermoneutrality.
Senese R, Cioffi F, De Matteis R, Petito G, de Lange P, Silvestri E, Lombardi A, Moreno M, Goglia F, Lanni A
Cells 2019 Mar 18;8(3)
Cells 2019 Mar 18;8(3)
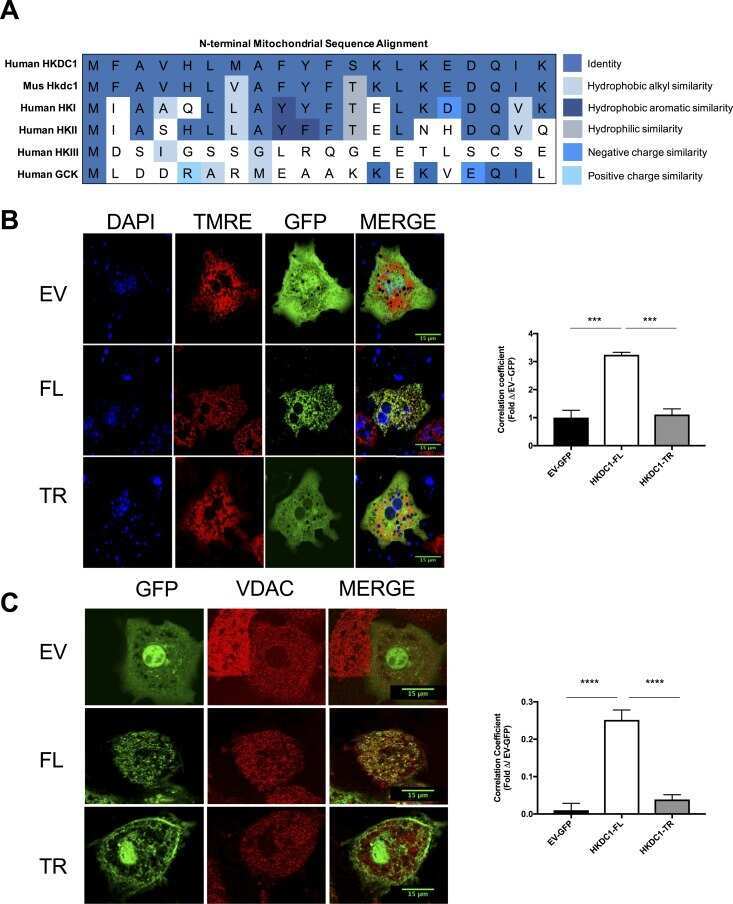
Hepatic HKDC1 Expression Contributes to Liver Metabolism.
Pusec CM, De Jesus A, Khan MW, Terry AR, Ludvik AE, Xu K, Giancola N, Pervaiz H, Daviau Smith E, Ding X, Harrison S, Chandel NS, Becker TC, Hay N, Ardehali H, Cordoba-Chacon J, Layden BT
Endocrinology 2019 Feb 1;160(2):313-330
Endocrinology 2019 Feb 1;160(2):313-330
Identification of a mitofusin specificity region that confers unique activities to Mfn1 and Mfn2.
Sloat SR, Whitley BN, Engelhart EA, Hoppins S
Molecular biology of the cell 2019 Aug 1;30(17):2309-2319
Molecular biology of the cell 2019 Aug 1;30(17):2309-2319
Intracellular glycolysis in brown adipose tissue is essential for optogenetically induced nonshivering thermogenesis in mice.
Jeong JH, Chang JS, Jo YH
Scientific reports 2018 Apr 27;8(1):6672
Scientific reports 2018 Apr 27;8(1):6672
OPA1 deficiency promotes secretion of FGF21 from muscle that prevents obesity and insulin resistance.
Pereira RO, Tadinada SM, Zasadny FM, Oliveira KJ, Pires KMP, Olvera A, Jeffers J, Souvenir R, Mcglauflin R, Seei A, Funari T, Sesaki H, Potthoff MJ, Adams CM, Anderson EJ, Abel ED
The EMBO journal 2017 Jul 14;36(14):2126-2145
The EMBO journal 2017 Jul 14;36(14):2126-2145
The mitochondrial translation machinery as a therapeutic target in Myc-driven lymphomas.
D'Andrea A, Gritti I, Nicoli P, Giorgio M, Doni M, Conti A, Bianchi V, Casoli L, Sabò A, Mironov A, Beznoussenko GV, Amati B
Oncotarget 2016 Nov 8;7(45):72415-72430
Oncotarget 2016 Nov 8;7(45):72415-72430
Mitochondrial targeting of XJB-5-131 attenuates or improves pathophysiology in HdhQ150 animals with well-developed disease phenotypes.
Polyzos A, Holt A, Brown C, Cosme C, Wipf P, Gomez-Marin A, Castro MR, Ayala-Peña S, McMurray CT
Human molecular genetics 2016 May 1;25(9):1792-802
Human molecular genetics 2016 May 1;25(9):1792-802
Cellular and subcellular oxidative stress parameters following severe spinal cord injury.
Visavadiya NP, Patel SP, VanRooyen JL, Sullivan PG, Rabchevsky AG
Redox biology 2016 Aug;8:59-67
Redox biology 2016 Aug;8:59-67
Mitochondrial-targeted catalase is good for the old mouse proteome, but not for the young: 'reverse' antagonistic pleiotropy?
Basisty N, Dai DF, Gagnidze A, Gitari L, Fredrickson J, Maina Y, Beyer RP, Emond MJ, Hsieh EJ, MacCoss MJ, Martin GM, Rabinovitch PS
Aging cell 2016 Aug;15(4):634-45
Aging cell 2016 Aug;15(4):634-45
Intramembrane protease PARL defines a negative regulator of PINK1- and PARK2/Parkin-dependent mitophagy.
Meissner C, Lorenz H, Hehn B, Lemberg MK
Autophagy 2015;11(9):1484-98
Autophagy 2015;11(9):1484-98
Lipid-induced NOX2 activation inhibits autophagic flux by impairing lysosomal enzyme activity.
Jaishy B, Zhang Q, Chung HS, Riehle C, Soto J, Jenkins S, Abel P, Cowart LA, Van Eyk JE, Abel ED
Journal of lipid research 2015 Mar;56(3):546-561
Journal of lipid research 2015 Mar;56(3):546-561
Mitochondria-associated microRNAs in rat hippocampus following traumatic brain injury.
Wang WX, Visavadiya NP, Pandya JD, Nelson PT, Sullivan PG, Springer JE
Experimental neurology 2015 Mar;265:84-93
Experimental neurology 2015 Mar;265:84-93
Parkinson-causing α-synuclein missense mutations shift native tetramers to monomers as a mechanism for disease initiation.
Dettmer U, Newman AJ, Soldner F, Luth ES, Kim NC, von Saucken VE, Sanderson JB, Jaenisch R, Bartels T, Selkoe D
Nature communications 2015 Jun 16;6:7314
Nature communications 2015 Jun 16;6:7314
Inhibition of apoptotic Bax translocation to the mitochondria is a central function of parkin.
Charan RA, Johnson BN, Zaganelli S, Nardozzi JD, LaVoie MJ
Cell death & disease 2014 Jul 3;5(7):e1313
Cell death & disease 2014 Jul 3;5(7):e1313
Thiol changes during epididymal maturation: a link to flagellar angulation in mouse spermatozoa?
Ijiri TW, Vadnais ML, Huang AP, Lin AM, Levin LR, Buck J, Gerton GL
Andrology 2014 Jan;2(1):65-75
Andrology 2014 Jan;2(1):65-75
Maintaining PGC-1α expression following pressure overload-induced cardiac hypertrophy preserves angiogenesis but not contractile or mitochondrial function.
Pereira RO, Wende AR, Crum A, Hunter D, Olsen CD, Rawlings T, Riehle C, Ward WF, Abel ED
FASEB journal : official publication of the Federation of American Societies for Experimental Biology 2014 Aug;28(8):3691-702
FASEB journal : official publication of the Federation of American Societies for Experimental Biology 2014 Aug;28(8):3691-702
Concentration dependent effect of calcium on brain mitochondrial bioenergetics and oxidative stress parameters.
Pandya JD, Nukala VN, Sullivan PG
Frontiers in neuroenergetics 2013;5:10
Frontiers in neuroenergetics 2013;5:10
Induction of mitochondrial dysfunction by poly(ADP-ribose) polymer: implication for neuronal cell death.
Baek SH, Bae ON, Kim EK, Yu SW
Molecules and cells 2013 Sep;36(3):258-66
Molecules and cells 2013 Sep;36(3):258-66
In vivo cross-linking reveals principally oligomeric forms of α-synuclein and β-synuclein in neurons and non-neural cells.
Dettmer U, Newman AJ, Luth ES, Bartels T, Selkoe D
The Journal of biological chemistry 2013 Mar 1;288(9):6371-85
The Journal of biological chemistry 2013 Mar 1;288(9):6371-85
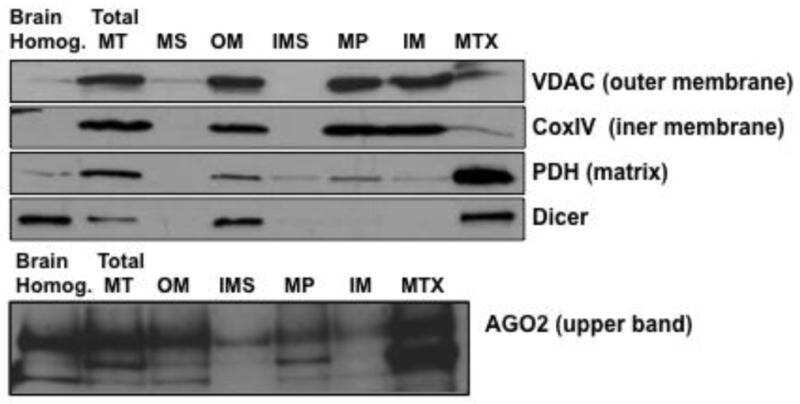
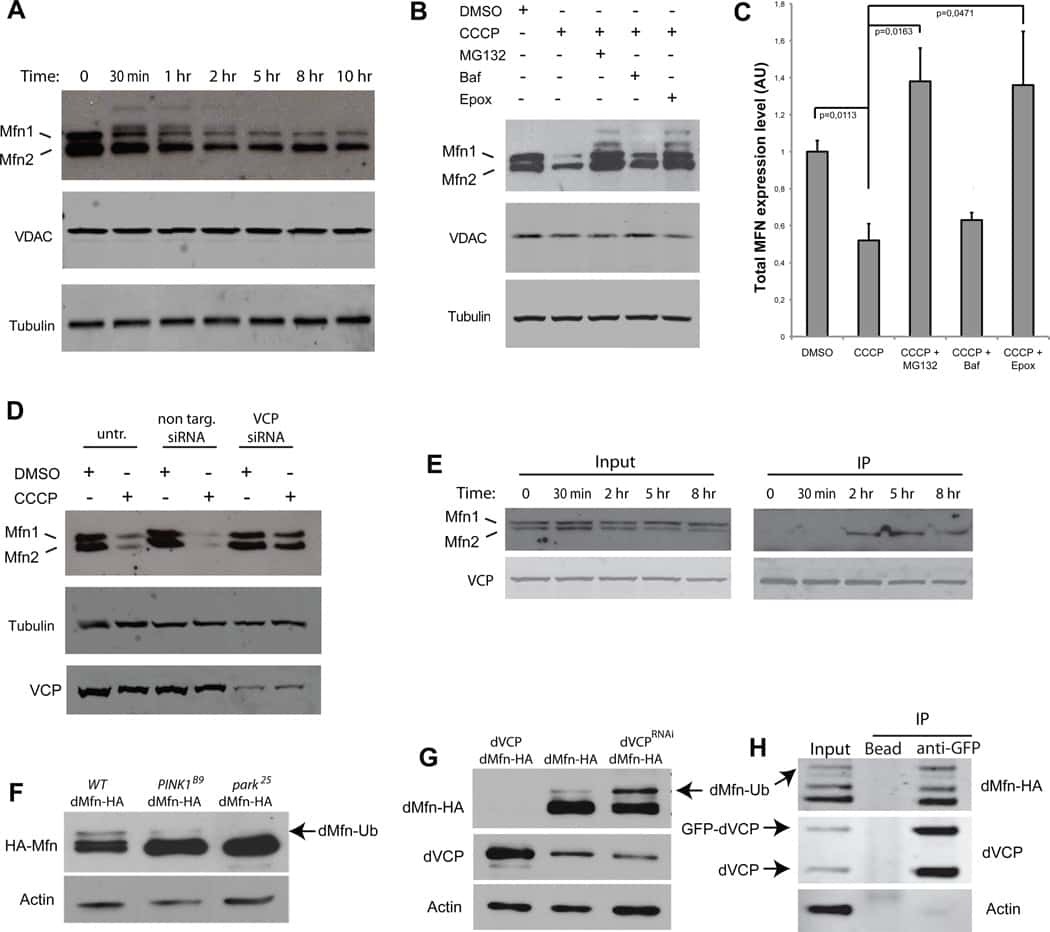
VCP is essential for mitochondrial quality control by PINK1/Parkin and this function is impaired by VCP mutations.
Kim NC, Tresse E, Kolaitis RM, Molliex A, Thomas RE, Alami NH, Wang B, Joshi A, Smith RB, Ritson GP, Winborn BJ, Moore J, Lee JY, Yao TP, Pallanck L, Kundu M, Taylor JP
Neuron 2013 Apr 10;78(1):65-80
Neuron 2013 Apr 10;78(1):65-80
A novel WD-repeat protein, WDR26, inhibits apoptosis of cardiomyocytes induced by oxidative stress.
Feng Y, Zhang C, Luo Q, Wei X, Jiang B, Zhu H, Zhang L, Jiang L, Liu M, Xiao X
Free radical research 2012 Jun;46(6):777-84
Free radical research 2012 Jun;46(6):777-84
Amidoxime reductase system containing cytochrome b5 type B (CYB5B) and MOSC2 is of importance for lipid synthesis in adipocyte mitochondria.
Neve EP, Nordling A, Andersson TB, Hellman U, Diczfalusy U, Johansson I, Ingelman-Sundberg M
The Journal of biological chemistry 2012 Feb 24;287(9):6307-17
The Journal of biological chemistry 2012 Feb 24;287(9):6307-17
Role of protein kinase C in phospholemman mediated regulation of α₂β₁ isozyme of Na⁺/K⁺-ATPase in caveolae of pulmonary artery smooth muscle cells.
Dey K, Roy S, Ghosh B, Chakraborti S
Biochimie 2012 Apr;94(4):991-1000
Biochimie 2012 Apr;94(4):991-1000
Alignment of sarcoplasmic reticulum-mitochondrial junctions with mitochondrial contact points.
García-Pérez C, Schneider TG, Hajnóczky G, Csordás G
American journal of physiology. Heart and circulatory physiology 2011 Nov;301(5):H1907-15
American journal of physiology. Heart and circulatory physiology 2011 Nov;301(5):H1907-15
Mislocalization of the E3 ligase, β-transducin repeat-containing protein 1 (β-TrCP1), in glioblastoma uncouples negative feedback between the pleckstrin homology domain leucine-rich repeat protein phosphatase 1 (PHLPP1) and Akt.
Warfel NA, Niederst M, Stevens MW, Brennan PM, Frame MC, Newton AC
The Journal of biological chemistry 2011 Jun 3;286(22):19777-88
The Journal of biological chemistry 2011 Jun 3;286(22):19777-88
Calcium-dependent cleavage of the Na(+)/Ca(2+) exchanger by m-calpain in isolated endoplasmic reticulum.
Samanta K, Kar P, Chakraborti T, Chakraborti S
Journal of biochemistry 2010 Feb;147(2):225-35
Journal of biochemistry 2010 Feb;147(2):225-35
m-Calpain-mediated cleavage of Na+/Ca2+ exchanger-1 in caveolae vesicles isolated from pulmonary artery smooth muscle.
Shaikh S, Samanta K, Kar P, Roy S, Chakraborti T, Chakraborti S
Molecular and cellular biochemistry 2010 Aug;341(1-2):167-80
Molecular and cellular biochemistry 2010 Aug;341(1-2):167-80
Parkin selectively alters the intrinsic threshold for mitochondrial cytochrome c release.
Berger AK, Cortese GP, Amodeo KD, Weihofen A, Letai A, LaVoie MJ
Human molecular genetics 2009 Nov 15;18(22):4317-28
Human molecular genetics 2009 Nov 15;18(22):4317-28
Ca2+ influx mechanisms in caveolae vesicles of pulmonary smooth muscle plasma membrane under inhibition of alpha2beta1 isozyme of Na+/K+-ATPase by ouabain.
Ghosh B, Kar P, Mandal A, Dey K, Chakraborti T, Chakraborti S
Life sciences 2009 Jan 30;84(5-6):139-48
Life sciences 2009 Jan 30;84(5-6):139-48
Physical coupling supports the local Ca2+ transfer between sarcoplasmic reticulum subdomains and the mitochondria in heart muscle.
García-Pérez C, Hajnóczky G, Csordás G
The Journal of biological chemistry 2008 Nov 21;283(47):32771-80
The Journal of biological chemistry 2008 Nov 21;283(47):32771-80
Pink1 Parkinson mutations, the Cdc37/Hsp90 chaperones and Parkin all influence the maturation or subcellular distribution of Pink1.
Weihofen A, Ostaszewski B, Minami Y, Selkoe DJ
Human molecular genetics 2008 Feb 15;17(4):602-16
Human molecular genetics 2008 Feb 15;17(4):602-16
Ca2+-dependent control of the permeability properties of the mitochondrial outer membrane and voltage-dependent anion-selective channel (VDAC).
Báthori G, Csordás G, Garcia-Perez C, Davies E, Hajnóczky G
The Journal of biological chemistry 2006 Jun 23;281(25):17347-17358
The Journal of biological chemistry 2006 Jun 23;281(25):17347-17358
Pancreatic beta cells lack a low glucose and O2-inducible mitochondrial protein that augments cell survival.
Wang J, Cao Y, Chen Y, Chen Y, Gardner P, Steiner DF
Proceedings of the National Academy of Sciences of the United States of America 2006 Jul 11;103(28):10636-41
Proceedings of the National Academy of Sciences of the United States of America 2006 Jul 11;103(28):10636-41
Altered cholesterol metabolism in Niemann-Pick type C1 mouse brains affects mitochondrial function.
Yu W, Gong JS, Ko M, Garver WS, Yanagisawa K, Michikawa M
The Journal of biological chemistry 2005 Mar 25;280(12):11731-9
The Journal of biological chemistry 2005 Mar 25;280(12):11731-9
No comments: Submit comment
Supportive validation
- Submitted by
- Invitrogen Antibodies (provider)
- Main image

- Experimental details
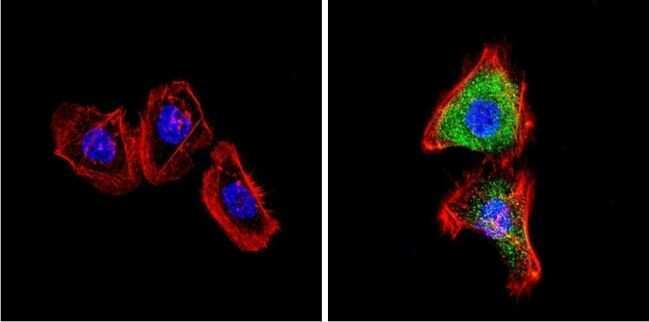
- Immunofluorescent analysis of VDAC (green) showing positive staining in the cytoplasm of A431 cells (right) compared with a negative control in the absence of primary antibody (left). Formalin-fixed cells were permeabilized with 0.1% Triton X-100 in TBS for 5-10 minutes, blocked with 3% BSA-PBS for 30 minutes at room temperature and probed with a VDAC polyclonal antibody (Product # PA1-954A) in 3% BSA-PBS at a dilution of 1:200 and incubated overnight at 4 ºC in a humidified chamber. Cells were washed with PBST and incubated with a DyLight 488-conjugated goat-anti-rabbit IgG secondary antibody in PBS at room temperature in the dark. F-actin (red) was stained with a fluorescent red phalloidin and nuclei (blue) were stained with DAPI for 5-10 minutes in the dark. Images were taken at a magnification of 60x.
- Submitted by
- Invitrogen Antibodies (provider)
- Main image

- Experimental details
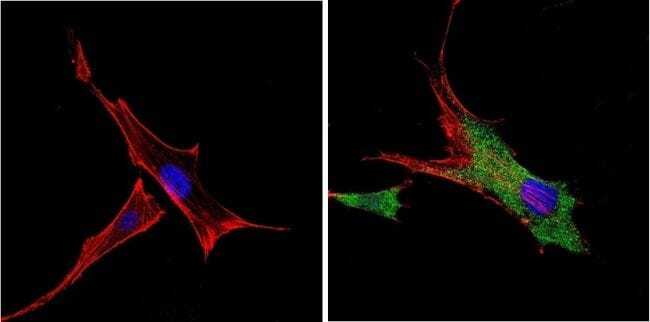
- Immunofluorescent analysis of VDAC (green) showing positive staining in the cytoplasm of U-251 cells (right) compared with a negative control in the absence of primary antibody (left). Formalin-fixed cells were permeabilized with 0.1% Triton X-100 in TBS for 5-10 minutes, blocked with 3% BSA-PBS for 30 minutes at room temperature and probed with a VDAC polyclonal antibody (Product # PA1-954A) in 3% BSA-PBS at a dilution of 1:200 and incubated overnight at 4 ºC in a humidified chamber. Cells were washed with PBST and incubated with a DyLight 488-conjugated goat-anti-rabbit IgG secondary antibody in PBS at room temperature in the dark. F-actin (red) was stained with a fluorescent red phalloidin and nuclei (blue) were stained with DAPI for 5-10 minutes in the dark. Images were taken at a magnification of 60x.

- Submitted by
- Invitrogen Antibodies (provider)
- Main image

- Experimental details
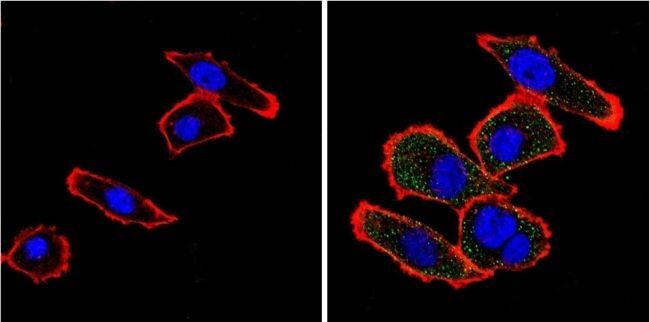
- Immunofluorescent analysis of VDAC (green) showing positive staining in the cytoplasm of NIH-3T3 cells (right) compared with a negative control in the absence of primary antibody (left). Formalin-fixed cells were permeabilized with 0.1% Triton X-100 in TBS for 5-10 minutes, blocked with 3% BSA-PBS for 30 minutes at room temperature and probed with a VDAC polyclonal antibody (Product # PA1-954A) in 3% BSA-PBS at a dilution of 1:200 and incubated overnight at 4 ºC in a humidified chamber. Cells were washed with PBST and incubated with a DyLight 488-conjugated goat-anti-rabbit IgG secondary antibody in PBS at room temperature in the dark. F-actin (red) was stained with a fluorescent red phalloidin and nuclei (blue) were stained with DAPI for 5-10 minutes in the dark. Images were taken at a magnification of 60x.
- Submitted by
- Invitrogen Antibodies (provider)
- Main image

- Experimental details
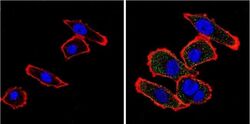
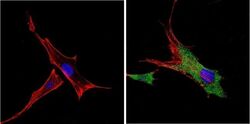
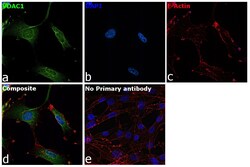
- Immunofluorescence analysis of VDAC was performed using 70% confluent log phase U-87 MG cells. The cells were fixed with 4% paraformaldehyde for 10 minutes, permeabilized with 0.1% Triton™ X-100 for 15 minutes, and blocked with 2% BSA for 45 minutes at room temperature. The cells were labeled with VDAC Polyclonal Antibody (Product # PA1-954A) at 1:200 dilution in 0.1% BSA, incubated at 4 degree celsius overnight and then labeled with Goat anti-Rabbit IgG (H+L) Highly Cross-Adsorbed Secondary Antibody, Alexa Fluor Plus 488 (Product # A32731), (1:3000 dilution), for 45 minutes at room temperature (Panel a: Green). Nuclei (Panel b:Blue) were stained with ProLong™ Diamond Antifade Mountant with DAPI (Product # P36962). F-actin (Panel c: Red) was stained with Rhodamine Phalloidin (Product # R415, 1:300). Panel d represents the merged image showing cytoplasmic localization. Panel e represents control cells with no primary antibody to assess background. The images were captured at 60X magnification.

- Submitted by
- Invitrogen Antibodies (provider)
- Main image
- Experimental details
- Immunofluorescent analysis of VDAC (green) showing positive staining in the cytoplasm of U-251 cells (right) compared with a negative control in the absence of primary antibody (left). Formalin-fixed cells were permeabilized with 0.1% Triton X-100 in TBS for 5-10 minutes, blocked with 3% BSA-PBS for 30 minutes at room temperature and probed with a VDAC polyclonal antibody (Product # PA1-954A) in 3% BSA-PBS at a dilution of 1:200 and incubated overnight at 4 ºC in a humidified chamber. Cells were washed with PBST and incubated with a DyLight 488-conjugated goat-anti-rabbit IgG secondary antibody in PBS at room temperature in the dark. F-actin (red) was stained with a fluorescent red phalloidin and nuclei (blue) were stained with DAPI for 5-10 minutes in the dark. Images were taken at a magnification of 60x.
- Submitted by
- Invitrogen Antibodies (provider)
- Main image

- Experimental details
- Immunofluorescent analysis of VDAC (green) showing positive staining in the cytoplasm of A431 cells (right) compared with a negative control in the absence of primary antibody (left). Formalin-fixed cells were permeabilized with 0.1% Triton X-100 in TBS for 5-10 minutes, blocked with 3% BSA-PBS for 30 minutes at room temperature and probed with a VDAC polyclonal antibody (Product # PA1-954A) in 3% BSA-PBS at a dilution of 1:200 and incubated overnight at 4 ºC in a humidified chamber. Cells were washed with PBST and incubated with a DyLight 488-conjugated goat-anti-rabbit IgG secondary antibody in PBS at room temperature in the dark. F-actin (red) was stained with a fluorescent red phalloidin and nuclei (blue) were stained with DAPI for 5-10 minutes in the dark. Images were taken at a magnification of 60x.

- Submitted by
- Invitrogen Antibodies (provider)
- Main image
- Experimental details
- Immunofluorescent analysis of VDAC (green) showing positive staining in the cytoplasm of NIH-3T3 cells (right) compared with a negative control in the absence of primary antibody (left). Formalin-fixed cells were permeabilized with 0.1% Triton X-100 in TBS for 5-10 minutes, blocked with 3% BSA-PBS for 30 minutes at room temperature and probed with a VDAC polyclonal antibody (Product # PA1-954A) in 3% BSA-PBS at a dilution of 1:200 and incubated overnight at 4 ºC in a humidified chamber. Cells were washed with PBST and incubated with a DyLight 488-conjugated goat-anti-rabbit IgG secondary antibody in PBS at room temperature in the dark. F-actin (red) was stained with a fluorescent red phalloidin and nuclei (blue) were stained with DAPI for 5-10 minutes in the dark. Images were taken at a magnification of 60x.

- Submitted by
- Invitrogen Antibodies (provider)
- Main image
- Experimental details
- Immunofluorescence analysis of VDAC was performed using 70% confluent log phase U-87 MG cells. The cells were fixed with 4% paraformaldehyde for 10 minutes, permeabilized with 0.1% Triton™ X-100 for 15 minutes, and blocked with 2% BSA for 45 minutes at room temperature. The cells were labeled with VDAC Polyclonal Antibody (Product # PA1-954A) at 1:200 dilution in 0.1% BSA, incubated at 4 degree celsius overnight and then labeled with Goat anti-Rabbit IgG (H+L) Highly Cross-Adsorbed Secondary Antibody, Alexa Fluor Plus 488 (Product # A32731), (1:3000 dilution), for 45 minutes at room temperature (Panel a: Green). Nuclei (Panel b:Blue) were stained with ProLong™ Diamond Antifade Mountant with DAPI (Product # P36962). F-actin (Panel c: Red) was stained with Rhodamine Phalloidin (Product # R415, 1:300). Panel d represents the merged image showing cytoplasmic localization. Panel e represents control cells with no primary antibody to assess background. The images were captured at 60X magnification.

Supportive validation
- Submitted by
- Invitrogen Antibodies (provider)
- Main image
- Experimental details
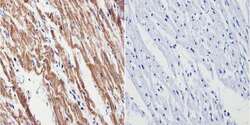
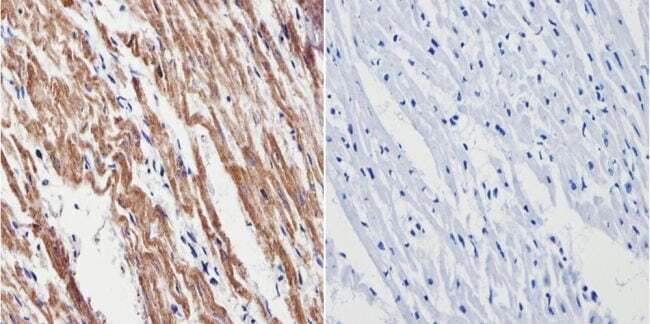
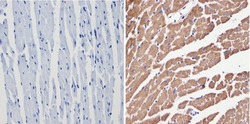
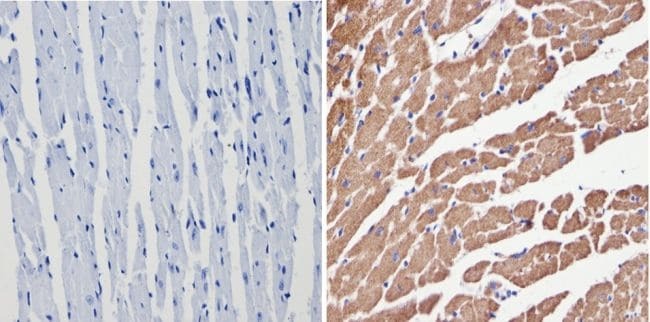
- Immunohistochemistry analysis of VDAC showing positive staining in the cytoplasm of paraffin-treated Human heart tissue (right) compared with a negative control in the absence of primary antibody (left). To expose target proteins, antigen retrieval method was performed using 10mM sodium citrate (pH 6.0), microwaved for 8-15 min. Following antigen retrieval, tissues were blocked in 3% H2O2-methanol for 15 min at room temperature, washed with ddH2O and PBS, and then probed with a VDAC polyclonal antibody (Product # PA1-954A) diluted by 3% BSA-PBS at a dilution of 1:200 overnight at 4°C in a humidified chamber. Tissues were washed extensively PBST and detection was performed using an HRP-conjugated secondary antibody followed by colorimetric detection using a DAB kit. Tissues were counterstained with hematoxylin and dehydrated with ethanol and xylene to prep for mounting.
- Submitted by
- Invitrogen Antibodies (provider)
- Main image
- Experimental details
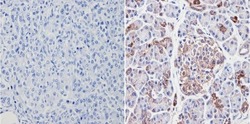
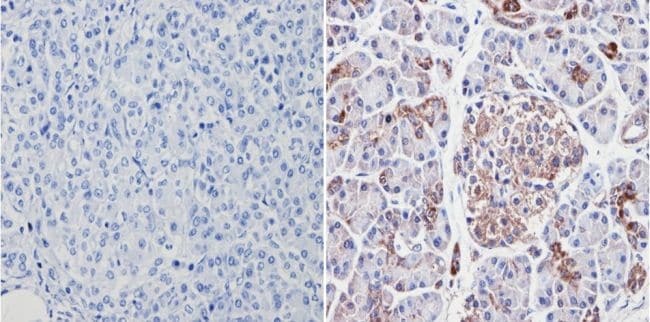
- Immunohistochemistry analysis of VDAC showing positive staining in the cytoplasm of paraffin-treated Human pancreas tissue (right) compared with a negative control in the absence of primary antibody (left). To expose target proteins, antigen retrieval method was performed using 10mM sodium citrate (pH 6.0), microwaved for 8-15 min. Following antigen retrieval, tissues were blocked in 3% H2O2-methanol for 15 min at room temperature, washed with ddH2O and PBS, and then probed with a VDAC polyclonal antibody (Product # PA1-954A) diluted by 3% BSA-PBS at a dilution of 1:200 overnight at 4°C in a humidified chamber. Tissues were washed extensively PBST and detection was performed using an HRP-conjugated secondary antibody followed by colorimetric detection using a DAB kit. Tissues were counterstained with hematoxylin and dehydrated with ethanol and xylene to prep for mounting.
- Submitted by
- Invitrogen Antibodies (provider)
- Main image
- Experimental details
- Immunohistochemistry analysis of VDAC showing positive staining in the cytoplasm of paraffin-treated Mouse heart tissue (right) compared with a negative control in the absence of primary antibody (left). To expose target proteins, antigen retrieval method was performed using 10mM sodium citrate (pH 6.0), microwaved for 8-15 min. Following antigen retrieval, tissues were blocked in 3% H2O2-methanol for 15 min at room temperature, washed with ddH2O and PBS, and then probed with a VDAC polyclonal antibody (Product # PA1-954A) diluted by 3% BSA-PBS at a dilution of 1:200 overnight at 4°C in a humidified chamber. Tissues were washed extensively PBST and detection was performed using an HRP-conjugated secondary antibody followed by colorimetric detection using a DAB kit. Tissues were counterstained with hematoxylin and dehydrated with ethanol and xylene to prep for mounting.
Supportive validation
- Submitted by
- Invitrogen Antibodies (provider)
- Main image
- Experimental details
- NULL
- Submitted by
- Invitrogen Antibodies (provider)
- Main image
- Experimental details
- NULL
- Submitted by
- Invitrogen Antibodies (provider)
- Main image

- Experimental details
- NULL
- Submitted by
- Invitrogen Antibodies (provider)
- Main image
- Experimental details
- NULL
- Submitted by
- Invitrogen Antibodies (provider)
- Main image
- Experimental details
- NULL

- Submitted by
- Invitrogen Antibodies (provider)
- Main image
- Experimental details
- NULL
- Submitted by
- Invitrogen Antibodies (provider)
- Main image

- Experimental details
- NULL
- Submitted by
- Invitrogen Antibodies (provider)
- Main image
- Experimental details
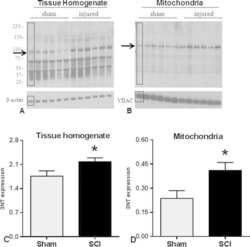
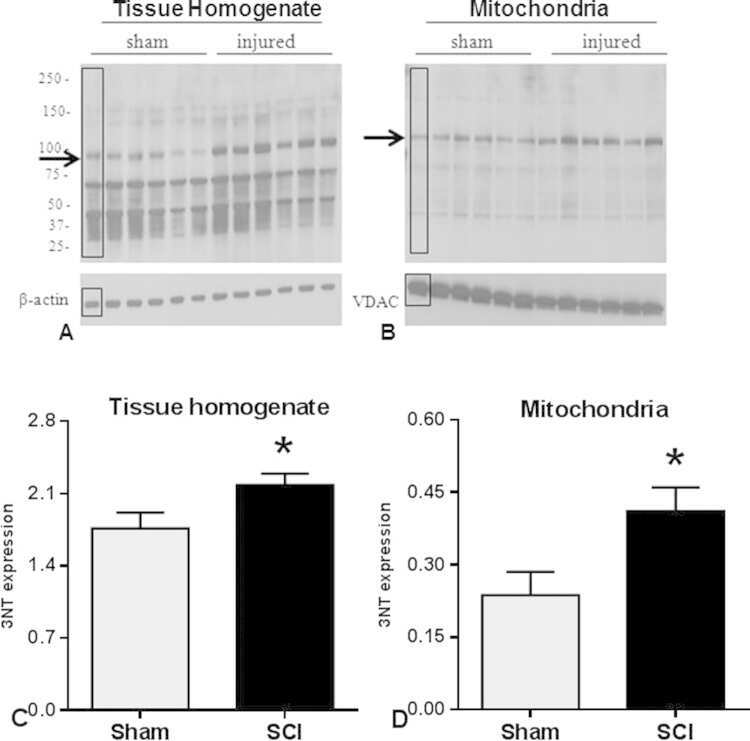
- Fig. 3 Western blot images demonstrate 3-NT bands in tissue homogenate (A) and mitochondrial (B) fractions. Quantitative density values of 3-NT protein bands relative to internal controls from tissue homogenate (C) and mitochondrial fractions (D) showed that 24 h after SCI, 3-NT formation was significantly increased in both fractions compared to Shams. The boxes in A and B represent regions of interest used for comparative analyses. beta-actin or VDAC were used as loading controls for tissue homogenate and mitochondria, respectively. Bars represent group means+-SEM, n =6/group. * p
- Submitted by
- Invitrogen Antibodies (provider)
- Main image
- Experimental details
- NULL
- Submitted by
- Invitrogen Antibodies (provider)
- Main image
- Experimental details
- NULL
- Submitted by
- Invitrogen Antibodies (provider)
- Main image
- Experimental details
- NULL
- Submitted by
- Invitrogen Antibodies (provider)
- Main image
- Experimental details
- NULL
- Submitted by
- Invitrogen Antibodies (provider)
- Main image

- Experimental details
- NULL
- Submitted by
- Invitrogen Antibodies (provider)
- Main image
- Experimental details
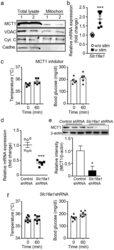
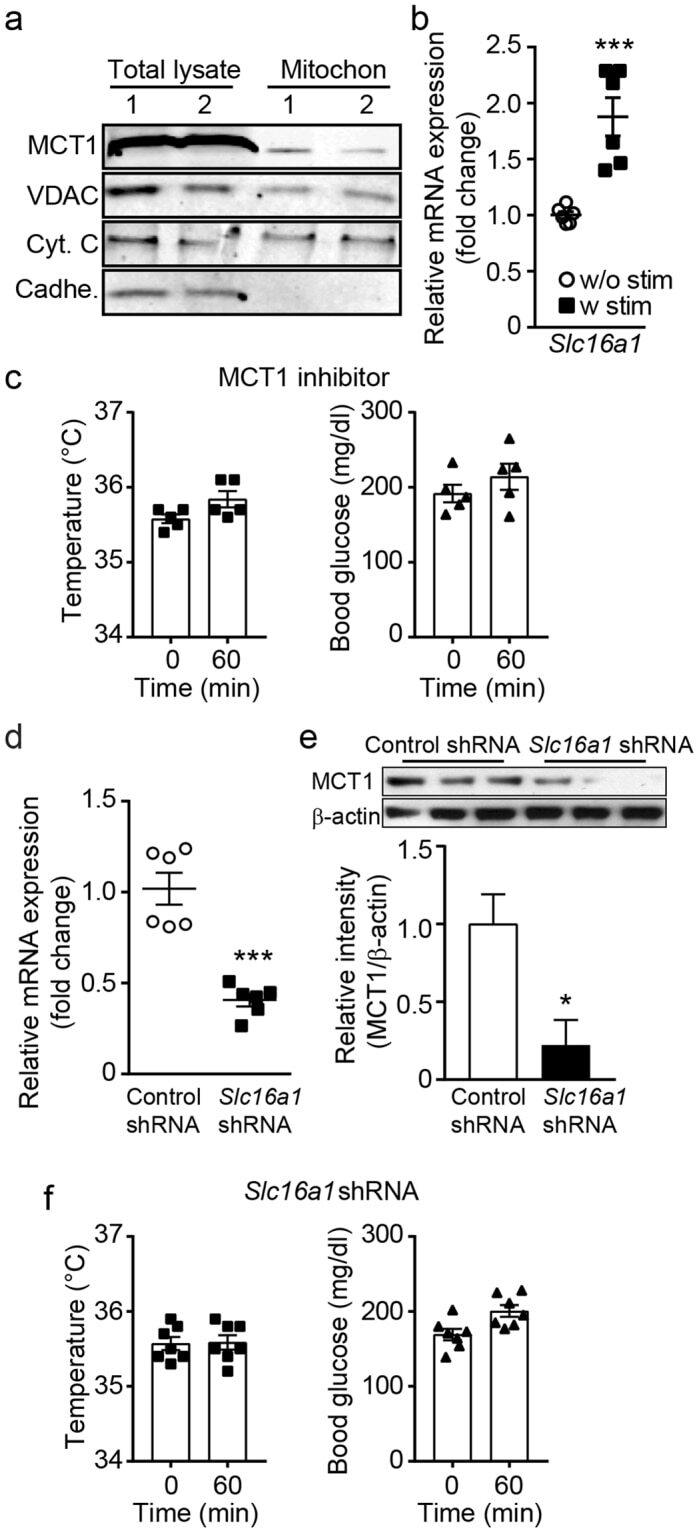
- Figure 6 Blockade of MCT1 inhibits the effects of optogenetic stimulation of sympathetic efferent fibers of BAT. ( a ) Cropped images of western blotting showing expression of MCT1 in the mitochondrial fractions (n = 2 mice). Full-length blots are presented in Supplementary Figure 2. VDAC: voltage-dependent anion channel, Cyt. C: cytochrome C, Cadhe: Cadherin ( b ) Pooled data from 6 mice showing changes in Slc16a1 ( Mct1 ) mRNA expression with (filled square) and without (open circle) stimulation of sympathetic innervation of BAT (***p < 0.001, unpaired t -test). Data are shown as mean +- SEM. ( c ) Pooled data showing effects of blockade of the MCT1 on optogenetically induced increase in body temperature and glucose uptake (n = 5 mice). Data are shown as mean +- SEM. ( d ) Plot showing relative Slc16a1 (Mct1) mRNA expression in mice injected with control or Slc16a1 shRNA into BAT (n = 6 mice, ***p < 0.001, unpaired t -test). Data are shown as mean +- SEM. ( e ) Western blotting to show knockdown of the Mct1 gene in BAT injected with Mct1 shRNA. Cropped images of western blotting showing knockdown of MCT1 protein (upper panel). Plot showing relative expression of MCT1 protein (bottom panel, *p < 0.05, unpaired t -test). Data are shown as mean +- SEM. ( f ) Pooled data showing that mice injected with Slc16a1 (Mct1) shRNA into the BAT pad showed no response to optogenetic stimulation. Data are shown as mean +- SEM.
- Submitted by
- Invitrogen Antibodies (provider)
- Main image
- Experimental details
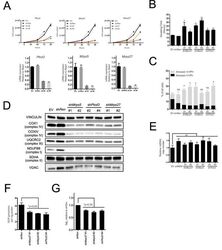
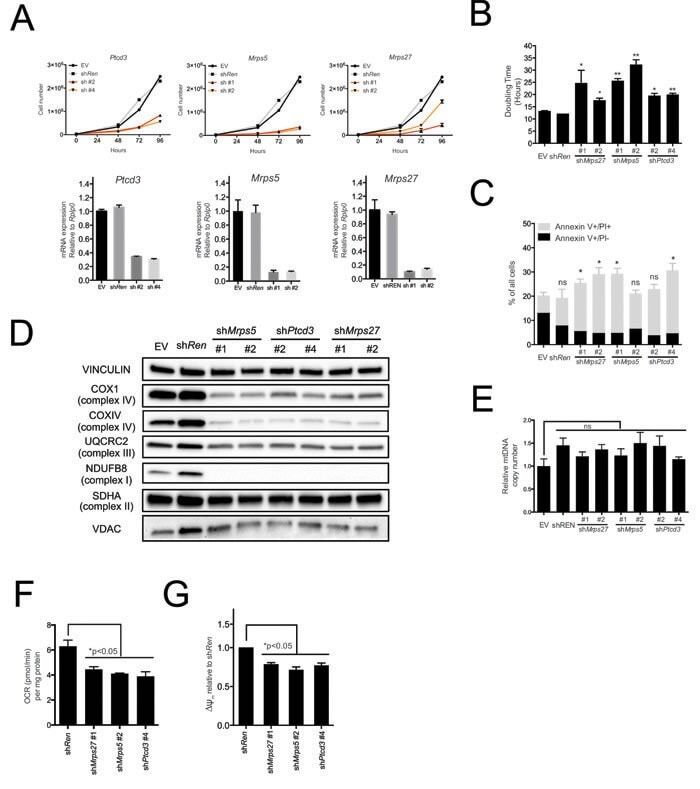
- Figure 2 The mitochondrial translation machinery regulates global mitochondrial activity and Emu -myc cell growth A. Emu- myc lymphoma cells were transduced with shRNAs against Ptcd3 , Mrps5 , Mrps27 , Renilla luciferase (Ren) or a control empty vector (EV). The number of viable cells at each time point (top) was determined by trypan blue staining. For each single shRNA the efficiency of knockdown was evaluated by real-time qPCR three days post-transduction (bottom). Transcript abundance is expressed as mean +- s.d. of triplicate measurements, expressed relative to the EV control and normalized to Rplp0 . B. Doubling time was calculated from the growth curves in A., using the formula described in experimental procedures. C. Cell death was evaluated by Annexin V and propidium iodide (PI) staining at the 48hrs time-point. The graph shows the percentage of Annexin V+/PI- (black) and Annexin V+/PI+ cells (grey) corresponding to early and late apoptotic cells, respectively. D. Western blot analysis of components of the Electron Transport Chain (ETC) Complexes I-IV following 48hrs of knock-down. As loading controls, we used antibodies against cytoplasmic Vinculin and the mitochondrial Voltage-dependent anion channel (VDAC). E. Real-time qPCR quantification of mtDNA, normalized to nuclear DNA. Results are shown as mean +- s.d. from triplicate measurements. F. Oxygen consumption rate (OCR) was determined as described in experimental procedures at 48hrs. Data were normalized to total
- Submitted by
- Invitrogen Antibodies (provider)
- Main image

- Experimental details
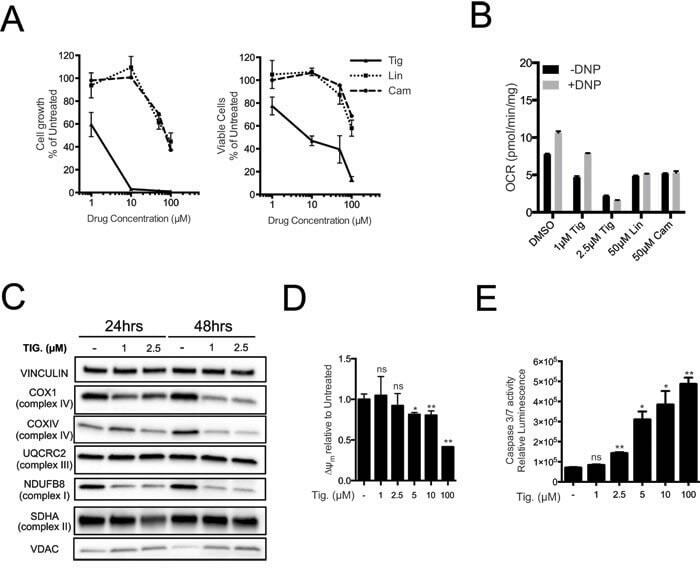
- Figure 3 Tigecycline impairs the growth of Emu -myc lymphoma cells and inhibits translation of mitochondrial proteins A. Dose-response curve of Emu- myc lymphoma cells treated with the indicated doses of Tigecycline (Tig), Linezolid (Lin) or Cloramphenicol (Cam) for 48hrs. Data are shown as cell numbers (left panel) or viability (right panel), as percentage of untreated cells (mock-treated with DMSO). Cell number and viability was determined by trypan blue staining. B. Oxygen consumption rate (OCR) measured as defined in Figure 2F on Emu- myc lymphoma cells treated with the indicated antibiotics or carrier (DMSO). To measure spare respiratory capacity, cells were treated with the ETC uncoupler 2,4-Dinitrophenol (DNP). C. Western blot analysis of components of the ETC complexes I-IV. Cells were treated with the indicated concentration of Tigecycline for 24 or 48hrs. The loading controls are Vinculin and VDAC, as in Figure 2D . D. Mitochondrial membrane potential was determined by staining with the cationic cyanine dye DilC1(5). E. Cleaved caspase 3/7 activity was determined with the caspase 3/7 glo assay luminescent kit. Measurements in D and E were taken after 6 hrs of treatment. Means, s.d. and statistical significance are as defined in Figure 2 . See also Supplementary Figures S3 and S4 .
- Submitted by
- Invitrogen Antibodies (provider)
- Main image

- Experimental details
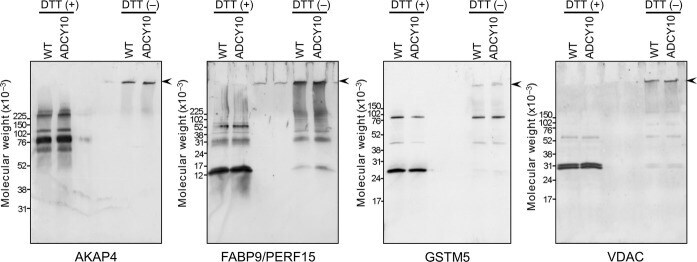
- Figure 5 Demonstration of AKAP4, FABP9, GSTM5 and VDAC2 thiol status during epididymal maturation and comparison of disulfide cross-linking of these proteins in wild-type and Adcy10- cauda epididymal spermatozoa. Immunoblot analysis of AKAP4, FABP9, GSTM5 and VDAC2 from reduced (DTT+) and non-reduced (DTT-) wild-type and Adcy10- cauda epididymal spermatozoa. All four proteins were trapped on the bottom of the sample well in non-reduced sperm proteins (arrow-heads). FABP9 was detected at greater levels in the non-reduced Adcy10- sperm protein extracts than in proteins from non-reduced wild-type spermatozoa indicating that Adcy10- cauda epididymal sperm proteins contained fewer disulfide bonds than wild-type sperm cells. Antibodies against AKAP4, FABP9, GSTM5 and VDAC proteins detected bands of the predicted sizes of M r 82 000, 15 000, 26 000 and 31 000 respectively.
- Submitted by
- Invitrogen Antibodies (provider)
- Main image
- Experimental details
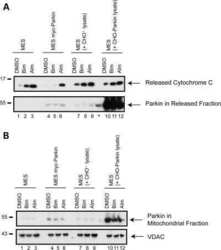
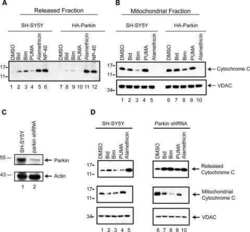
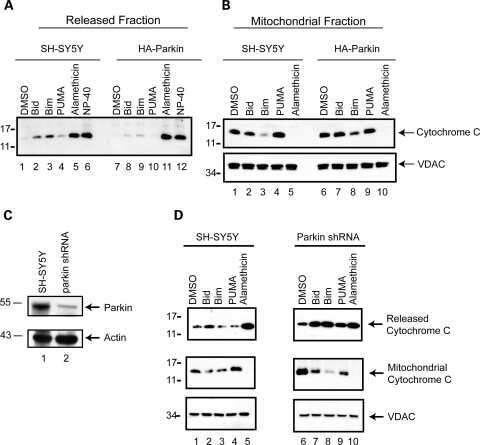
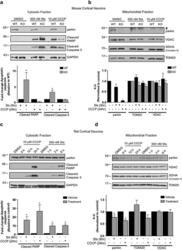
- Figure 1 Primary brain-derived cells demonstrate a muted mitophagic response, but show a parkin-dependent sensitivity to apoptosis. Mouse or rat primary cortical neurons isolated at E18 were treated with 300 nM staurosporine or 10 mu M carbonylcyanide-3-chlorophenylhydrazone (CCCP) for stated times. ( a ) Cytosolic fractions from WT or parkin KO mouse cortical neurons were treated with DMSO, staurosporine (Sts) for 6 h or CCCP for 24 h and probed for parkin and apoptotic markers, and ( b ) the mitochondrial fractions were analyzed for mitochondrial protein levels. Hash (#) indicates a non-specific band. For quantification, band intensities of proteins in the cytosolic fractions were normalized to WT, and the mitochondrial proteins were normalized to the control (DMSO). ( c ) WT rat cortical neurons were treated with DMSO, CCCP or staurosporine for times listed and probed for parkin, apoptotic markers and ( d ) mitochondrial proteins. For quantification, band intensities of proteins from cytosolic and mitochondrial fractions were normalized to vehicle (DMSO). All bars represent mean+-S.E.M., n =3. Asterisks indicate significant differences compared with WT or control ( P

- Submitted by
- Invitrogen Antibodies (provider)
- Main image

- Experimental details
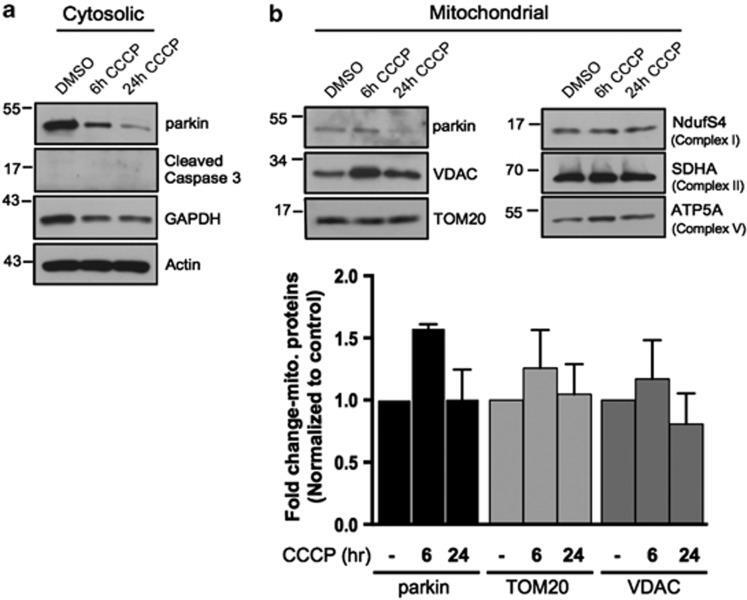
- Figure 2 Subcellular fractionation does not reveal a robust mitophagic response to CCCP in primary cultured murine astrocytes. ( a ) WT mouse astrocytes isolated from P1-P4 mice were treated with either DMSO or 20 mu M CCCP for 6 or 24 h and lysates from cytosolic and mitochondrial fractions were probed for parkin and apoptotic markers, and mitochondrial protein levels. ( b ) For quantification, band intensities of proteins from mitochondrial fractions were normalized to vehicle (DMSO). All bars represent mean+-S.D., n =3
- Submitted by
- Invitrogen Antibodies (provider)
- Main image
- Experimental details
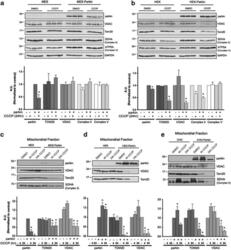
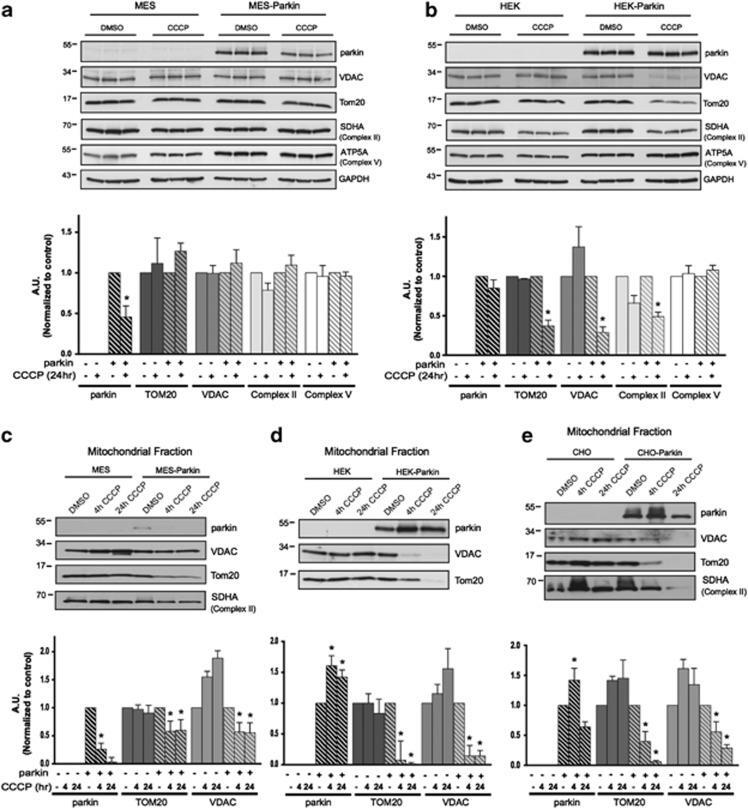
- Figure 3 The scale of parkin-mediated mitophagy is affected by cell type. Dopaminergic MES cells ( a ), and HEK cells ( b ), each with or without stable expression of parkin, were treated with either DMSO or 20 mu M CCCP for 24 h in triplicate. Whole-cell lysates were probed for outer (VDAC and TOM20) and inner (Complex II and V) mitochondrial proteins to assess mitophagy. For quantification, band intensities of proteins were normalized to vehicle (DMSO). ( c ) MES, ( d ) HEK and ( e ) CHO cells, with or without stable expression of parkin, were treated with either DMSO or 20 mu M CCCP for 4 or 24 h, and isolated mitochondrial fractions were probed for parkin translocation and for outer and inner mitochondrial proteins to assess mitophagy. For quantification, band intensities of proteins from mitochondrial fractions were normalized to vehicle (DMSO). All bars represent mean+-S.D., n =3. Asterisks indicate significant differences compared with control ( P
- Submitted by
- Invitrogen Antibodies (provider)
- Main image

- Experimental details
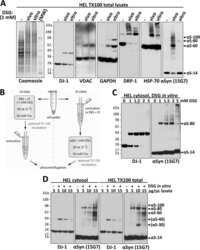
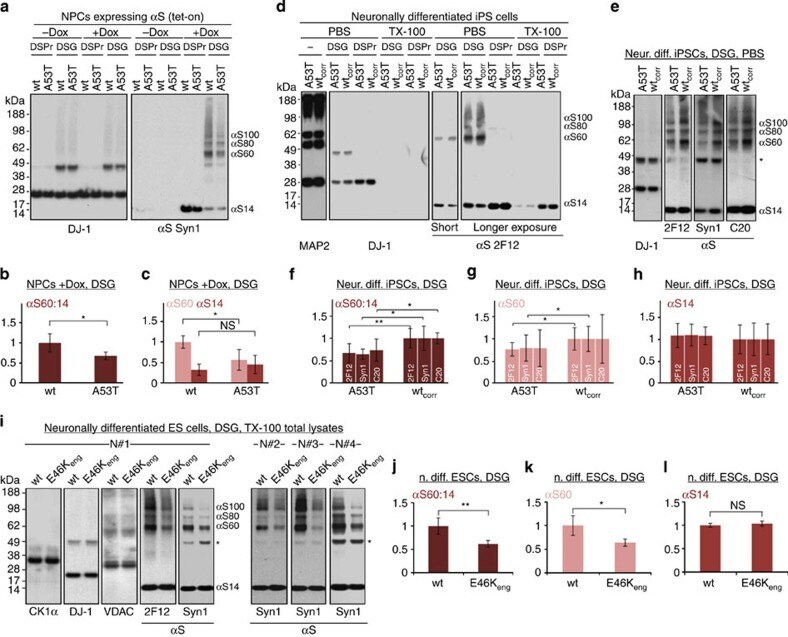
- Figure 5 A53T versus WT alphaS in hESC- and hiPSC-derived neurons. ( a ) Crosslinking analysis of non-induced (-Dox) and induced (+Dox) hESC-derived NPCs expressing WT or A53T alphaS: PBS-soluble fraction. DSP/betaME-treated (DSPr) and DSG-treated samples were blotted for DJ-1 and alphaS (Syn1). ( b ) Quantification of the cytosolic alphaS60:14 ratios ( N =3 different cultures, each analysed in parallel in duplicates, total n =6); ratios relative to WT alphaS. ( c ) Quantification of cytosolic alphaS60 and alphaS14 for both genotypes (normalized to WT alphaS60); NS, not significant. ( d ) Crosslinking analysis of neurons differentiated from human A53T iPSCs versus their genetically corrected isogenic WT line (WT corr ). PBS and TX-100 fractions of untreated (-), DSP/betaME-treated and DSG-treated cells were probed for DJ-1 and alphaS (2F12). ( e ) DSG-crosslinked samples: cytosols blotted for alphaS (2F12, C20, Syn1) and DJ-1; * non-specific band detected only by Syn1 (ref. 9 ). ( f ) Densitometry of the cytosolic alphaS60:14 ratios (relative to WT) as detected by 2F12, C20 and Syn1 ( N =4 cultures grown independently and analysed on different days in biological duplicates or triplicates; total n =10). ( g ) Densitometry of cytosolic alphaS60 (relative to WT) for both genotypes. ( h ) Densitometry of cytosolic alphaS14 (versus WT) for both genotypes. ( i ) Crosslinking analysis of neurons differentiated from WT hESCs or from a genetically engineered isogenic E46K line (E46K e
- Submitted by
- Invitrogen Antibodies (provider)
- Main image
- Experimental details
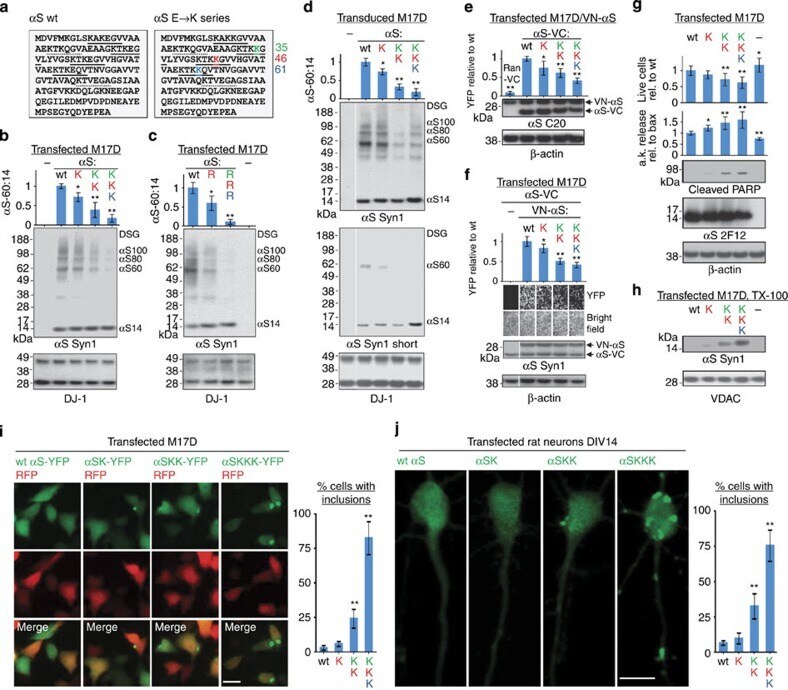
- Figure 6 Multimers/toxicity/inclusions with 1-3 E46K-like mutations. ( a ) Schematic of human alphaS sequence showing engineered mutations (color-coded). Highly conserved KTKEGV motifs underlined, less conserved motifs dotted. ( b ) DSG-treated M17D cells expressing the indicated alphaS variants lysed in PBS/1% TX-100; graph (alphaS60:14 ratios by western blot densitometry) and western blots (Syn1, anti-DJ-1) represent N =3 experiments on different days. For this and the following graphs, WT set to 1 unless stated otherwise. ( c ) Analogous to ( b ) but 1 or 3 E-R substitutions. ( d ) Analogous to ( b ) using lentiviral pools; long and short western blot exposures, blots cut once as indicated. ( e ) Venus-YFP complementation assay by automated fluorescence reading. M17D/VN-alphaS cells transfected with alphaS-VC WT or mutant or Ran-VC (negative control). YFP fluorescence relative to WT; N =6 independent experiments on 3 different days using different DNA preparations. Representative western blots for alphaS (pAb C20) plus loading control beta-actin. ( f ) Venus-YFP complementation assay by fluorescence microscopy; alphaS-VC (always WT) and 3 indicated VN-alphaS mutants were co-expressed (or not: -) in M17D cells; representative bright-field or fluorescent images and corresponding western blots (Syn1; beta-actin as a loading control; blots cut as indicated). N =8 independent transfections on 3 different days. ( g ) Cytotoxicity assays: trypan blue exclusion for live cell count
- Submitted by
- Invitrogen Antibodies (provider)
- Main image

- Experimental details
- Fig. 3 Western blot images demonstrate 3-NT bands in tissue homogenate (A) and mitochondrial (B) fractions. Quantitative density values of 3-NT protein bands relative to internal controls from tissue homogenate (C) and mitochondrial fractions (D) showed that 24 h after SCI, 3-NT formation was significantly increased in both fractions compared to Shams. The boxes in A and B represent regions of interest used for comparative analyses. beta-actin or VDAC were used as loading controls for tissue homogenate and mitochondria, respectively. Bars represent group means+-SEM, n =6/group. * p

- Submitted by
- Invitrogen Antibodies (provider)
- Main image
- Experimental details
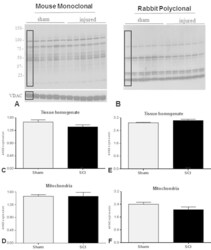
- Fig. 5 Representative western blots demonstrate 4-HNE adducts formation using mouse monoclonal (A) and rabbit polyclonal (B) antibodies for mitochondrial fractions, using VDAC as a loading control. The bar graphs show that there were no changes in 4-HNE levels 24 h after SCI compared to Sham using either antibody in tissue homogenate (C and E) or mitochondrial (D and H) fractions. It should be noted that the PVDF membrane for mitochondria was stripped prior to re-probe with VDAC and then again for rabbit polyclonal antibody; hence a common VDAC band was used for normalization of both 4-HNE antibodies. The boxes in A and B represent regions of interest used for density calculations. Bars represent group means+-SEM, n =6/group. Fig. 5.

- Submitted by
- Invitrogen Antibodies (provider)
- Main image
- Experimental details
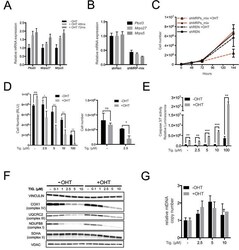
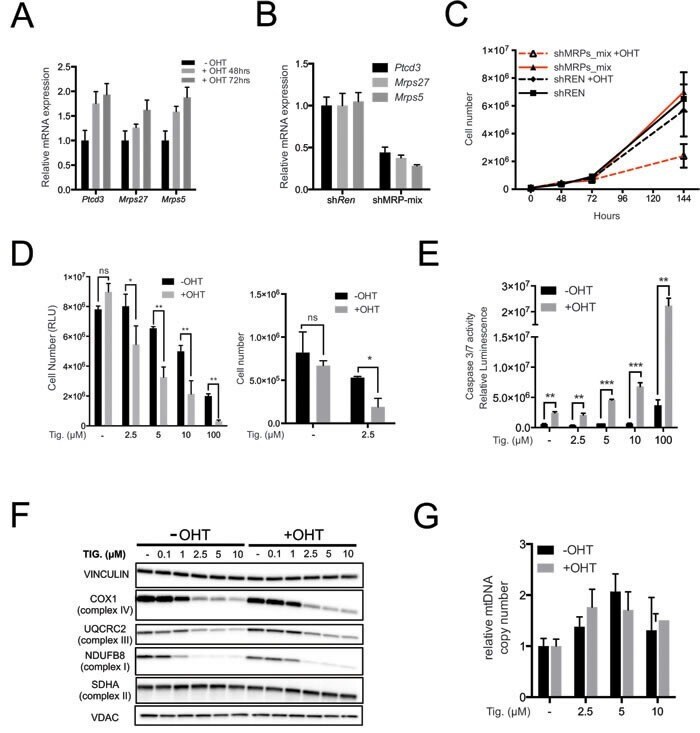
- Figure 5 Myc over-expression sensitizes mouse mammary epithelial cells (MMECs) to inhibition of mitochondrial translation A. Ptcd3 , Mrps27 and Mrps5 mRNA levels were quantified by RT-PCR in R26-MER T2 MMECs treated with 20nM 4-hydroxytamoxifen (OHT) for the indicated time relative to untreated samples. Data were normalized to Rplp0 expression. B. Simultaneous knockdown of Ptcd3 , Mrps27 and Mrps5 in MMECs. The mRNA expression levels for the three MRPs were quantified by RT-PCR following retroviral transduction. Data were normalized to Rplp0 expression. C. MMECs were simultaneously transduced with shRNAs against Ptcd3 , Mrps5 and Mrps27 (2 shRNAs/gene; shMRP-mix) or Renilla luciferase (sh Ren ). Cells were grown in the absence or presence of 20nM OHT. The number of viable cells at each time point was determined by trypan blue staining. D. Relative numbers of R26-MERT 2 MMECs, as measured with cell titer glo (left panel) or trypan blue exclusion assay (right panel). Before the addition of Tigecycline, cells were pre-treated with 20nM 4-hydroxytamoxifen (+OHT) for 72hrs or left untreated (-OHT). Tigecyline was then added at the indicated doses, with or without 20nM OHT, for an additional 72 hours. E. Caspase 3/7 activity was measured as in Figure 3E after 72 hours of treatment with Tigecycline as indicated. The bars represent the absolute luminescence signals in untreated versus OHT-treated samples. F. Total proteins extracted from MMECs cells were analyzed by immunoblot to det
- Submitted by
- Invitrogen Antibodies (provider)
- Main image
- Experimental details
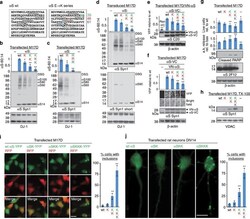
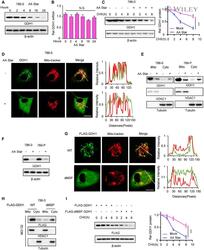
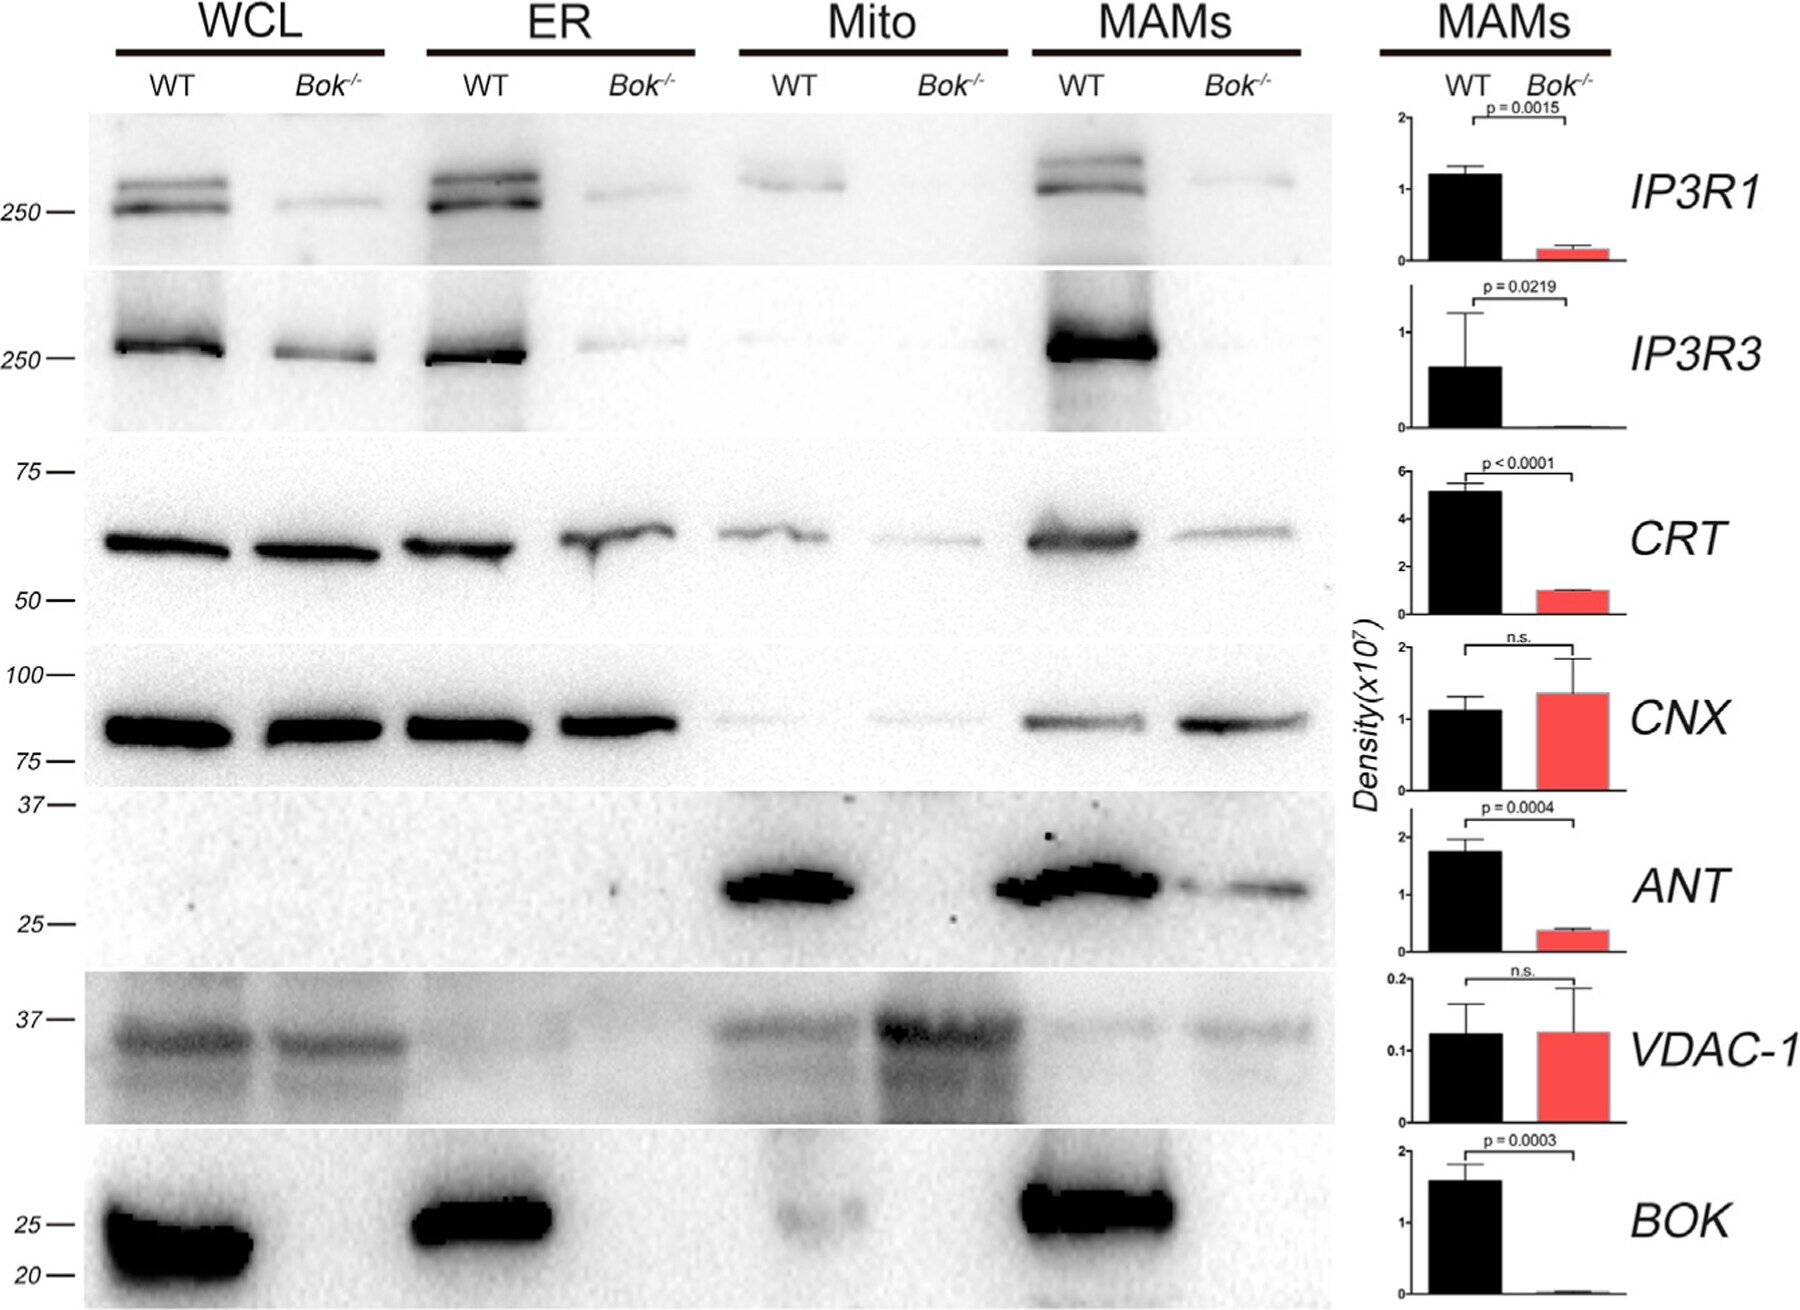
- 2 Figure The starvation of aa induces GDH1 translocation and reduces protein stability A 786-0 cells were subjected to aa starvation for the indicated times. The protein level of GDH1 was determined by WB using the indicated antibody. B The mRNA level of GDH1 in the cells in (A) was determined by qPCR using specific primers against GDH1 mRNA. C 786-0 cells were treated with or without aa starvation for 6 h and then treated with CHX (1 muM) for the indicated times. The protein level of GDH1 was determined by Western blotting (left), and the relative GDH1 protein levels were calculated (right). CHX: cycloheximide. Unpaired t -test was used. D Immunofluorescence (IF) assay was performed to determine the subcellular location of GDH1 with or without aa starvation. GDH1 localization was indicated by GDH1 antibody and MitoTracker (left). Signal intensities and distances were quantified (right). Scale bars: 20 mum. E Cytoplasm-mitochondrial fractionation assay was performed to determine the subcellular location of GDH1 with or without aa starvation. The fractionation efficiency and GDH1 location were determined by WB using antibodies against VDAC1 (mitochondrial membrane marker) and GDH1. Tubulin was used as loading control. F The total GDH1 protein in 786-0 and 769-P cells with or without aa starvation for 12 h was measured by WB. G Immunofluorescence (IF) assay was performed to determine the subcellular location of WT or mitochondrial signal peptide deleted (dMSP) GDH1. GDH1 locali

- Submitted by
- Invitrogen Antibodies (provider)
- Main image
- Experimental details
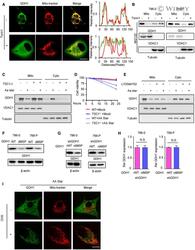
- EV2 Figure The aa starvation induces GDH1 translocation though mTOR1 signaling A Immunofluorescence (IF) assay was performed to determine the subcellular location of GDH1 with or without Torin 1 treatment (1 muM) for 24 h. GDH1 localization was indicated by GDH1 antibody and MitoTracker (left). Signal intensities and distances were quantified (right). Scale bars: 20 mum. B Cytoplasm-mitochondrial fractionation assay was performed to determine the subcellular location of GDH1 with or without Torin 1 treatment (1 muM) for 24 h. The fractionation efficiency and GDH1 location were determined by WB using antibodies against VDAC1 (mitochondrial membrane marker) and GDH1. Tubulin was used as loading control. C-E Under culture conditions with or without aa starvation, the mitochondria were extracted from TSC1 -/- cells (C for WB analysis and D for the cell viability assay) or cells were treated with the S6K inhibitor LY2584702 (1 muM) for 12 h (E). WB was performed to test the fractionation efficiency and GDH1 location using the indicated antibodies. F The total protein of WT or dMSP GDH1 in 786-0 or 769-P cells with or without aa starvation for 12 h was measured by WB. G, H WB and qRT-PCR results showed that 786-0 or 769-P cells stably expressing shGDH1 were reconstituted with rGDH1-WT or rGDH1-dMSP. The data are represented as the mean +- SEM of three independent experiments (N.S. : not significant). I IF was performed to determine the subcellular location of GDH1 with or without C

- Submitted by
- Invitrogen Antibodies (provider)
- Main image
- Experimental details
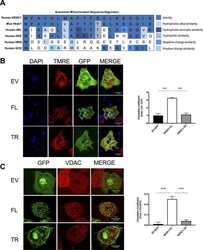
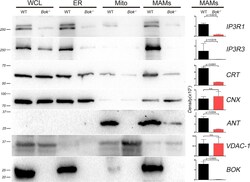
- Figure 4. MAM proteins are reduced in the absence of BOK by biochemical fractionation Representative western blot analysis (n = at least 3) for mitochondrial, bulk ER, and MAM proteins in WT and Bok - / - MEFs. Equal total protein was loaded for each fraction (20 mug for IP3R1, 20 mug for IP3R3, 10 mug for CRT, 10 mug for CNX, 40 mug for ANT, 40 mug for VDAC1, and 30 mug for BOK). Molecular weight markers are shown in kDa on the left. Density of the bands in the MAMs was quantified with a Bio-Rad ChemiDoc and plotted on the right. Data are represented as mean +- SD. Significance was calculated using an ANOVA test (ns, non-significant). CNX, calnexin; CRT, calreticulin; Mito, mitochondria; WCL, whole-cell lysate. See also Figure S4 .
- Submitted by
- Invitrogen Antibodies (provider)
- Main image
- Experimental details
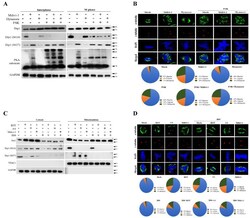
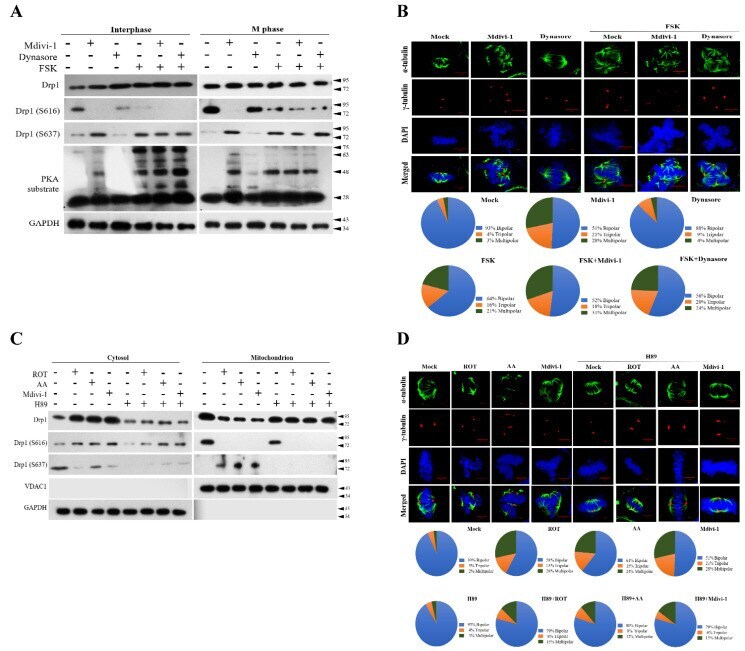
- Figure 5 Blockade of mitochondrial ETC and morphological features by ROT, AA, Mdivi-1, and Dynasore along with the presence of FSK or H89 results in phosphorylation of Drp1-Ser637 and Drp1-Ser616 in PKA performance at mitosis. ( A ) FSK-enhanced Dynasore stimulated Drp1-dependent mitochondrial fission. ( B ) FSK-enhanced Dynasore induced multiple spindles formation. ( C ) H-89 suppressed the mito-Drp1-S637 phosphorylation induced by ROT, AA, and Mdivi-1. ( D ) H-89 inhibited multiple spindles formation induced by ROT, AA, and Mdivi-1. Cells were pretreated with the PKA inhibitor H89 (50 muM) or PKA activator FSK (25 muM) for 2 h, followed by the treatment with ROT, AA Mdivi-1, and Dynasore for 24 h; whole-cell lysates were then prepared and subjected to Western blot. Quantitation pie charts indicate the percentage of bipolar, tripolar, and multipolar mitotic cells. VDAC1 and GAPDH were used as mitochondria and cytosol markers, respectively. GAPDH was checked for subcellular purity.
- Submitted by
- Invitrogen Antibodies (provider)
- Main image
- Experimental details
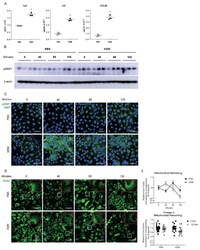
- Figure 1 HDM induces mitochondrial fission in human bronchial epithelial cells. ( A ) ELISAs on supernatants from cultured HBECs, n = 3 per group; ( B ) Western blot analysis of pDRP1 in whole cell lysates, n = 3 per group; ( C ) Representative images of immunofluorescence of pDRP1 in fixed HBECs; ( D ) Representative images from immunofluorescence of VDAC in fixed HBECs with insets at 3x magnification in red; ( E ) Quantification of mitochondrial networking based on VDAC mitochondrial immunofluorescence, form factor calculation with n = 19 images per group at 60x magnification; ( A , B , E ) * p < 0.05 vs. PBS group, ( C ) * p < 0.05 vs. corresponding 0 Min group, # p < 0.05 vs. PBS 120 Min group. Error bars represent mean +- SEM. ( C , D ) Scale bars are 50 um.
- Submitted by
- Invitrogen Antibodies (provider)
- Main image
- Experimental details
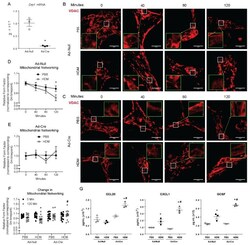
- Figure 2 Drp1 deletion impairs mitochondrial fission and enhances the mouse epithelial pro-inflammatory response to HDM. ( A ) RT-qPCR of Drp1 following Cre-induced deletion in cultured MTECs, n = 3 per group; ( B ) Representative images of immunofluorescence of VDAC in fixed MTECs treated with Ad- with insets at 3x magnification in green; ( C ) Representative images of immunofluorescence of VDAC in fixed MTECs treated with Ad-Cre with insets at 3x magnification in green; ( D ) Quantification of mitochondrial networking based on VDAC immunofluorescence, form factor calculation with n = 19-21 images per group; ( E ) Quantification of mitochondrial networking based on VDAC immunofluorescence, form factor calculation with Cre n = 14-18 images per group at 60x magnification; ( F ) Overall change in mitochondrial networking, each data point represents 1 image; ( G ) ELISAs on supernatants from MTECs, n = 3 per group; ( A ) * p < 0.05 vs. Ad- group; ( B , C ) Scale bars are 50 um. ( D , E ) * p < 0.05 PBS vs. HDM; ( F ) * p < 0.05 vs. corresponding 0 Min group, # p < 0.05 vs. Ad- HDM 120 Min group; ( G ) * p < 0.05 vs. corresponding PBS group, # p < 0.05 vs. Ad- HDM group. Error bars represent mean +- SEM.
- Submitted by
- Invitrogen Antibodies (provider)
- Main image
- Experimental details
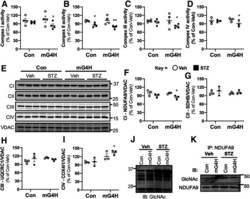
- Figure 5 Induction of cardiac GLUT4 in diabetes decreases respiratory chain complex activities in parallel with O- GlcNAc modifications of mitochondrial proteins. Specific respiratory complex activities in mitochondria isolated from Con and mG4H mice treated as in Fig. 1 E and beyond. NADH dehydrogenase CI activity ( A ) ( n = 4), succinate dehydrogenase CII activity ( B ) ( n = 4), coenzyme Q-cytochrome c reductase CIII activity ( C ) ( n = 4), and cytochrome c oxidase CIV activity ( D ) ( n = 3). E : Representative subunit protein levels from CI to CIV in isolated mitochondria corrected to VDAC. (CI, NDUFA9; CII, SDHB; CIII, UQCRC1; CIV, COX5I1.) F - I : Quantification of data presented in E . J : Mitochondrial protein O- GlcNAcylation in isolated mitochondria. K : O- GlcNAcylation of NDUFA9 as assessed by immunoprecipitation (IP) followed by O- GlcNAc immunoblot (IB). Quantitative data are means +- SEM. * P < 0.05 or ** P < 0.01 vs. Con-Veh.

- Submitted by
- Invitrogen Antibodies (provider)
- Main image
- Experimental details
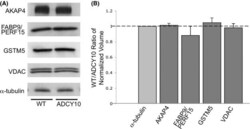
- Figure 4 Protein abundance of AKAP4, FABP9, GSTM5 and VDAC2 in wild-type and Adcy10- cauda epididymal spermatozoa. (A) Immunoblot analysis of the four identified sperm proteins and alpha-tubulin in wild-type (left) and Adcy10- (right) cauda epididymal spermatozoa. (B) The pixel volumes of the protein bands were normalized against that of alpha-tubulin. AKAP4, FABP9, GSTM5 and VDAC2 were not found to be in lower amounts in Adcy10 - spermatozoa.
