 Explore
 Validate
 Learn
Learn Western blot
Antibody data
- Antibody Data
- Antigen structure
- References [1]
- Comments [0]
- Validations
- Western blot [3]
- Immunocytochemistry [2]
- Immunohistochemistry [1]
- Chromatin Immunoprecipitation [2]
- Other assay [4]
Submit
Validation data
Reference
Comment
Report error
- Product number
- PA5-34430 - Provider product page

- Provider
- Invitrogen Antibodies
- Product name
- EED Polyclonal Antibody
- Antibody type
- Polyclonal
- Antigen
- Synthetic peptide
- Description
- A suggested positive control is human heart tissue lysate. PA5-34430 can be used with blocking peptide PEP-1472.
- Reactivity
- Human, Mouse, Rat
- Host
- Rabbit
- Isotype
- IgG
- Vial size
- 100 μg
- Concentration
- 1 mg/mL
- Storage
- Maintain refrigerated at 2-8°C for up to 3 months. For long term storage store at -20°C
Submitted references Methylation of microRNA-338-5p by EED promotes METTL3-mediated translation of oncogene CDCP1 in gastric cancer.
Zhang F, Yan Y, Cao X, Zhang J, Li Y, Guo C
Aging 2021 Apr 21;13(8):12224-12238
Aging 2021 Apr 21;13(8):12224-12238
No comments: Submit comment
Supportive validation
- Submitted by
- Invitrogen Antibodies (provider)
- Main image
- Experimental details
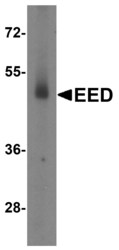
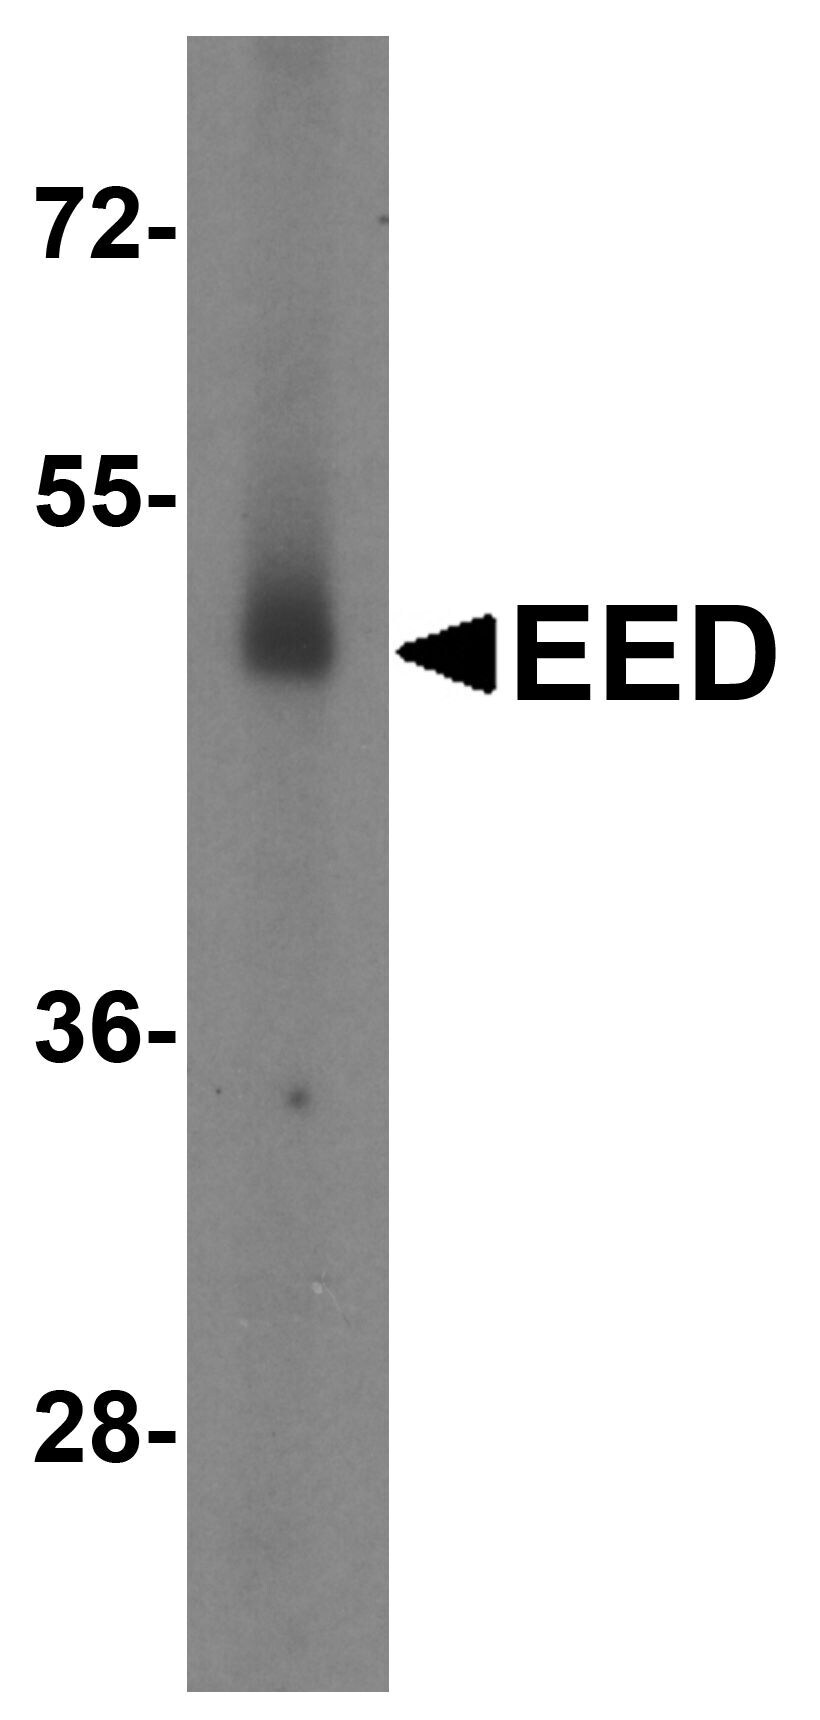
- Western Blot analysis of EED expression in human testis tissue lysate with EED Polyclonal Antibody (Product # PA5-34430) at 2 µg/mL.
- Submitted by
- Invitrogen Antibodies (provider)
- Main image
- Experimental details
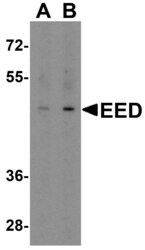
- Western Blot analysis of EED in human heart tissue lysate with EED Polyclonal Antibody (Product # PA5-34430) at (A) 1 and (B) 2 µg/mL.

- Submitted by
- Invitrogen Antibodies (provider)
- Main image
- Experimental details
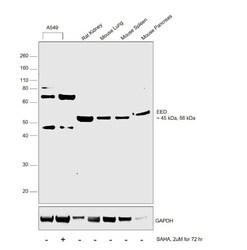
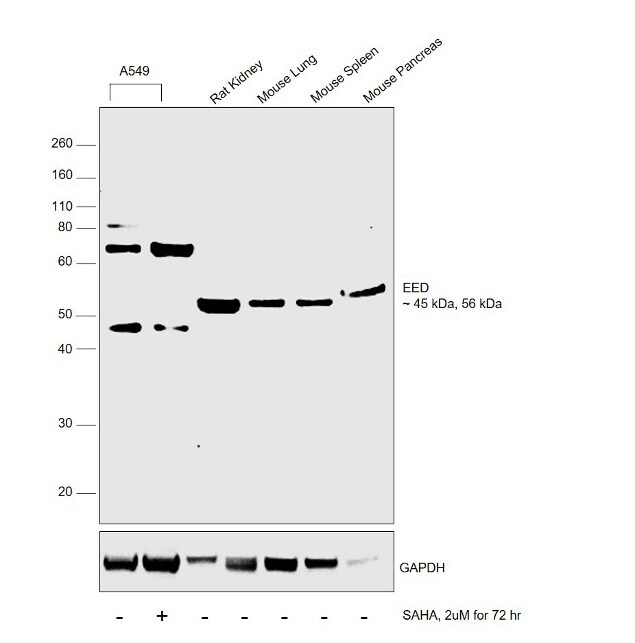
- Western blot was performed using Anti-EED Polyclonal Antibody (Product # PA5-34430) and a 45kDa band corresponding to human EED isoform and 56kDa band corresponding to mouse EED isoform was observed across cell lines and tissues tested. In addition to this there was an increase in the expression of EED proteins upon SAHA treatment in A549 cells. Whole cell extracts (30 µg lysate) of A549 (Lane 1), A549 treated with SAHA (2uM for 72hr) (Lane 2), tissue extracts (30 µg lysate) of Rat Kidney (Lane 3), Mouse Lung (Lane 4), Mouse Spleen (Lane 5) and Mouse Pancreas (Lane 6) were electrophoresed using NuPAGE™ 4-12% Bis-Tris Protein Gel (Product # NP0322BOX). Resolved proteins were then transferred onto a nitrocellulose membrane (Product # IB23001) by iBlot® 2 Dry Blotting System (Product # IB21001). The blot was probed with the primary antibody (1:1000 dilution) and detected by chemiluminescence Goat Anti-Rabbit IgG Secondary Antibody, HRP conjugate (Product # A27036, 1:4000 dilution) using the iBright FL 1000 (Product # A32752). Chemiluminescent detection was performed using Novex® ECL Chemiluminescent Substrate Reagent Kit (Product # WP20005)..
Supportive validation
- Submitted by
- Invitrogen Antibodies (provider)
- Main image
- Experimental details
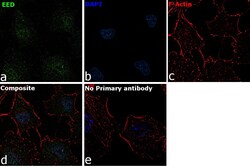
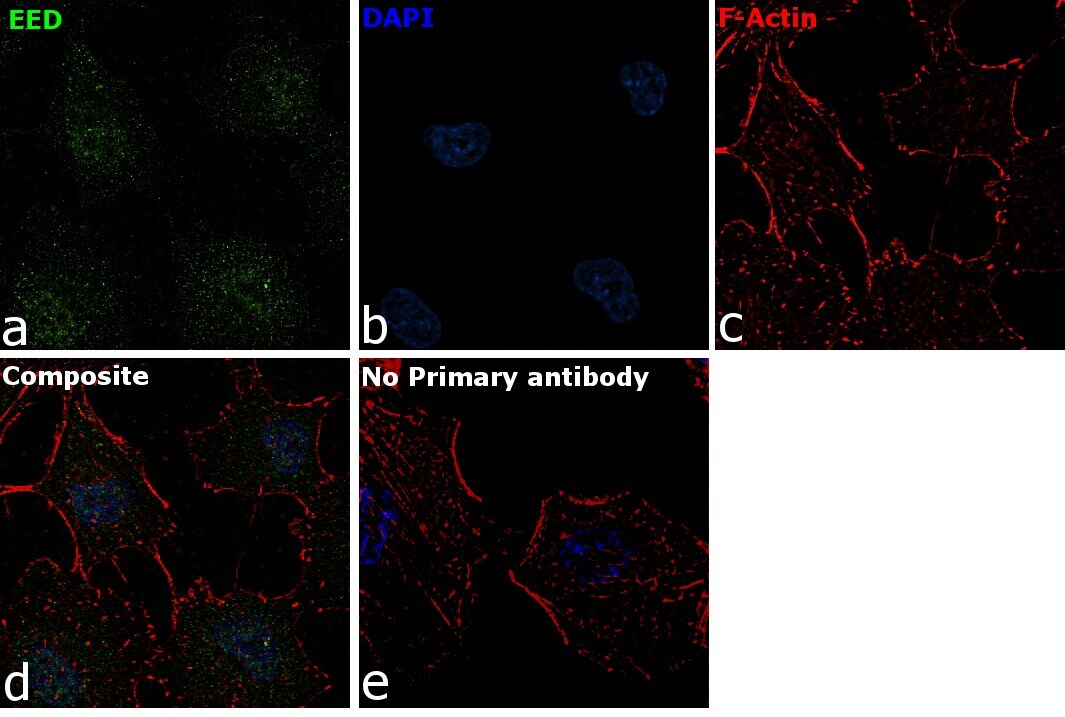
- Immunofluorescence analysis of EED was performed using 70% confluent log phase A549 cells. The cells were fixed with 4% paraformaldehyde for 10 minutes, permeabilized with 0.1% Triton™ X-100 for 15 minutes, and blocked with 2% BSA for 1 hour at room temperature. The cells were labeled with EED Rabbit Polyclonal Antibody (Product # PA5-34430) at 20 microgram/mL in 0.1% BSA, incubated at 4 degree Celsius overnight and then labeled with Goat anti-Rabbit IgG (H+L) Superclonal™ Secondary Antibody, Alexa Fluor® 488 conjugate (Product # A27034) at a dilution of 1:2000 for 45 minutes at room temperature (Panel a: green). Nuclei (Panel b: blue) were stained with ProLong™ Diamond Antifade Mountant with DAPI (Product # P36962). F-actin (Panel c: red) was stained with Rhodamine Phalloidin (Product # R415). Panel d represents the merged image showing Nuclear localization. Panel e represents control cells with no primary antibody to assess background. The images were captured at 60X magnification..
- Submitted by
- Invitrogen Antibodies (provider)
- Main image

- Experimental details
- Immunofluorescence analysis of EED was performed using 70% confluent log phase A549 cells. The cells were fixed with 4% paraformaldehyde for 10 minutes, permeabilized with 0.1% Triton™ X-100 for 15 minutes, and blocked with 2% BSA for 1 hour at room temperature. The cells were labeled with EED Rabbit Polyclonal Antibody (Product # PA5-34430) at 20 microgram/mL in 0.1% BSA, incubated at 4 degree Celsius overnight and then labeled with Goat anti-Rabbit IgG (Heavy Chain) Superclonal™ Secondary Antibody, Alexa Fluor® 488 conjugate (Product # A27034) at a dilution of 1:2000 for 45 minutes at room temperature (Panel a: green). Nuclei (Panel b: blue) were stained with ProLong™ Diamond Antifade Mountant with DAPI (Product # P36962). F-actin (Panel c: red) was stained with Rhodamine Phalloidin (Product # R415). Panel d represents the merged image showing Nuclear localization. Panel e represents control cells with no primary antibody to assess background. The images were captured at 60X magnification..

Supportive validation
- Submitted by
- Invitrogen Antibodies (provider)
- Main image
- Experimental details
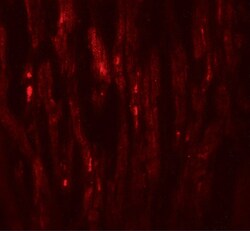
- Immunofluorescence of EED in human heart tissue with EED Polyclonal Antibody (Product # PA5-34430) at 20 µg/mL.

Supportive validation
- Submitted by
- Invitrogen Antibodies (provider)
- Main image

- Experimental details
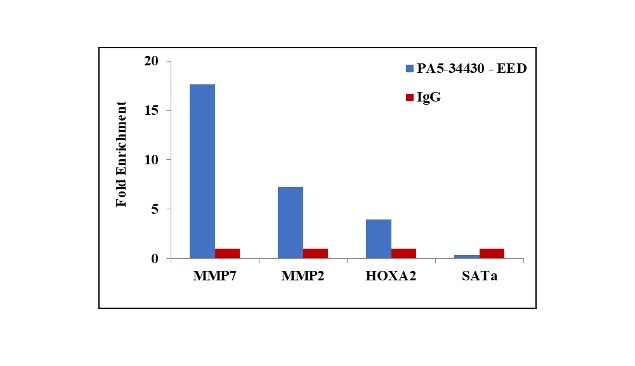
- Chromatin Immunoprecipitation (ChIP) assay of endogenous EED protein using Anti-EED Antibody: ChIP was performed using Anti-EED Rabbit Polyclonal Antibody (Product # PA5-34430, 5 µg) on sheared chromatin from A549 cells using the MAGnify ChIP System kit (Product # 49-2024). Normal Rabbit IgG was used as a negative IP control. The purified DNA was analyzed by qPCR using primers binding to MMP7 promoter, MMP2 and HOXA2 transcriptional start sites, and SAT alpha satellite repeats. Data is presented as fold enrichment of the antibody signal versus the negative control IgG using the comparative CT method.

- Submitted by
- Invitrogen Antibodies (provider)
- Main image

- Experimental details
- Chromatin Immunoprecipitation (ChIP) assay of endogenous EED protein using Anti-EED Antibody: ChIP was performed using Anti-EED Rabbit Polyclonal Antibody (Product # PA5-34430, 5 µg) on sheared chromatin from A549 cells using the MAGnify ChIP System kit (Product # 49-2024). Normal Rabbit IgG was used as a negative IP control. The purified DNA was analyzed by qPCR using primers binding to MMP7 promoter, MMP2 and HOXA2 transcriptional start sites, and SAT alpha satellite repeats. Data is presented as fold enrichment of the antibody signal versus the negative control IgG using the comparative CT method.
Supportive validation
- Submitted by
- Invitrogen Antibodies (provider)
- Main image
- Experimental details
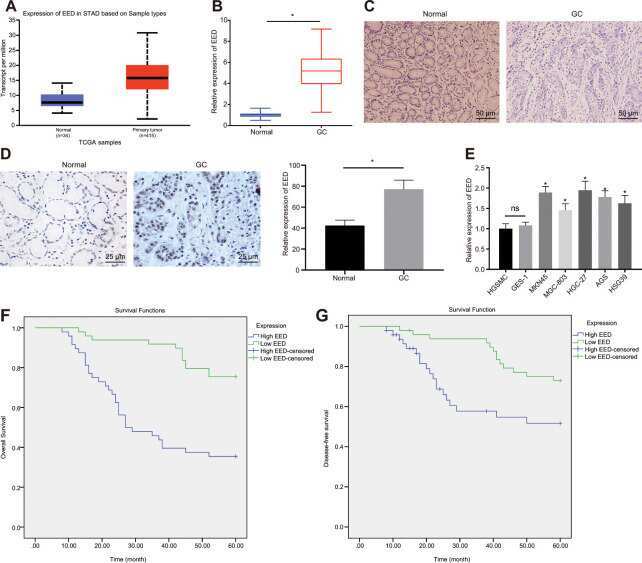
- Figure 1 EED is highly expressed in GC tissues and cells. ( A ) Absolute EED expression in GC obtained by UALCAN database ( http://ualcan.path.uab.edu/index.html ). The blue box on the left represents the expression of normal samples, and the red box on the right represents the expression of GC samples. ( B ) RT-qPCR determination of EED expression in GC tissues and adjacent normal tissues (n = 97). ( C ) Representative images of GC tissues and adjacent normal tissues by HE staining. ( D ) Immunohistochemistry to assess the EED expression in GC tissues and adjacent normal tissues. ( E ) RT-qPCR to examine EED expression in GC cell lines and normal gastric cell lines, with beta-actin as internal control. ( F , G ) Kaplan-Meier method with log-rank test to assess overall survival ( F ) and disease-free survival ( G ) of patients with relatively higher or lower EED expression (n = 97). Measurement data are expressed as mean +- standard deviation. * p < 0.05 compared with normal gastric cell line. GC tissues were compared with adjacent normal tissues by paired t test, n = 97. Data comparison among multiple groups was performed using one-way ANOVA with Tukey''s post hoc test. Kaplan-Meier method was carried out to investigate the relationship between high and low expression of EDD in GC tissues and overall survival and disease-free survival (log-rank test). Cell experiments were repeated 3 times independently.
- Submitted by
- Invitrogen Antibodies (provider)
- Main image

- Experimental details
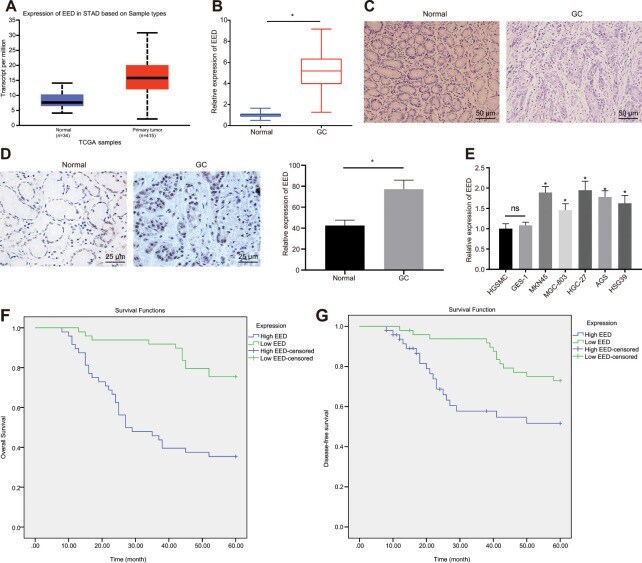
- Figure 1 EED is highly expressed in GC tissues and cells. ( A ) Absolute EED expression in GC obtained by UALCAN database ( http://ualcan.path.uab.edu/index.html ). The blue box on the left represents the expression of normal samples, and the red box on the right represents the expression of GC samples. ( B ) RT-qPCR determination of EED expression in GC tissues and adjacent normal tissues (n = 97). ( C ) Representative images of GC tissues and adjacent normal tissues by HE staining. ( D ) Immunohistochemistry to assess the EED expression in GC tissues and adjacent normal tissues. ( E ) RT-qPCR to examine EED expression in GC cell lines and normal gastric cell lines, with beta-actin as internal control. ( F , G ) Kaplan-Meier method with log-rank test to assess overall survival ( F ) and disease-free survival ( G ) of patients with relatively higher or lower EED expression (n = 97). Measurement data are expressed as mean +- standard deviation. * p < 0.05 compared with normal gastric cell line. GC tissues were compared with adjacent normal tissues by paired t test, n = 97. Data comparison among multiple groups was performed using one-way ANOVA with Tukey''s post hoc test. Kaplan-Meier method was carried out to investigate the relationship between high and low expression of EDD in GC tissues and overall survival and disease-free survival (log-rank test). Cell experiments were repeated 3 times independently.
- Submitted by
- Invitrogen Antibodies (provider)
- Main image

- Experimental details
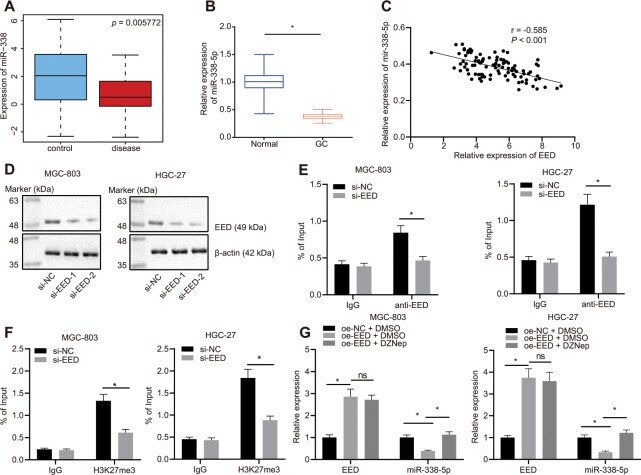
- Figure 2 EED inhibits miR-338-5p expression by promoting methylation. ( A ) Absolute miR-338-5p expression in profile GSE23739 obtained from GEO database ( https://www.ncbi.nlm.nih.gov/gds ) analyzed by R language. The blue box on the left represents the expression of normal samples, and the red box on the right represents the expression of GC samples ( p = 5.772E-03). ( B ) RT-qPCR determination of miR-338-5p expression in GC tissues and adjacent normal tissues (n = 97). ( C ) miR-338-5p expression in GC tissues was negatively correlated with EED expression in GC tissues (n = 97). ( D ) Evaluation of EED knockdown efficiency in MGC-803, and HGC-27 cells. ( E ) ChIP assay to assess enrichment of EED in the miR-338-5p promoter. ( F ) Enrichment of H3K27me3 in the miR-338-5p promoter. ( G ) RT-qPCR to examine EED and miR-338-5p expression after overexpressing EED and DZNep treatment, with beta-actin and U6 as internal control, respectively. Measurement data are expressed as mean +- standard deviation. * p < 0.05. GC tissues were compared with adjacent normal tissues by paired t test, and other comparison between two groups was analyzed using an unpaired t test. Data comparison among multiple groups was performed using one-way ANOVA with Tukey''s post hoc test. Pearson''s correlation analysis was carried out for the correlation between miR-338-5p and EED expression in GC tissues. Cell experiments were repeated 3 times independently.
- Submitted by
- Invitrogen Antibodies (provider)
- Main image
- Experimental details
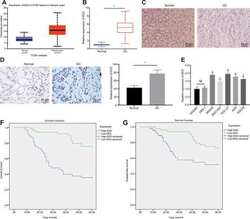
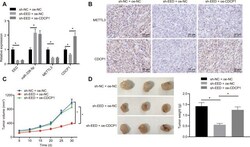
- Figure 6 EED accelerates the progression of GC in vivo through the miR-338-5p/METTL3/CDCP1 axis. ( A ) RT-qPCR to examine the expression of EED/miR-338-5p/METTL3/CDCP1 in tumors of nude mice, with beta-actin and U6 as internal control, respectively. ( B ) Immunohistochemistry to detect METTL3 and CDCP1 expression in mouse tumors. ( C ) Tumor volume and tumor photos in response to EED knockdown and CDCP1 overexpression. ( D ) Quantitative analysis for tumor weight in response to EED knockdown and CDCP1 overexpression. Measurement data are expressed as mean +- standard deviation. * p < 0.05. Data comparison among multiple groups was performed using one-way ANOVA with Tukey''s post hoc test. Data comparison between groups at different time points was performed using two-way ANOVA or repeated-measures ANOVA with Bonferroni post hoc test. n = 6.
