Explore
 Validate
 Learn
Learn Western blot
 ELISA
ELISA Immunocytochemistry
Antibody data
- Antibody Data
- Antigen structure
- References [2]
- Comments [0]
- Validations
- Immunocytochemistry [2]
- Immunohistochemistry [1]
- Flow cytometry [2]
- Other assay [3]
Submit
Validation data
Reference
Comment
Report error
- Product number
- MA5-15679 - Provider product page

- Provider
- Invitrogen Antibodies
- Product name
- HK2 Monoclonal Antibody (3D3)
- Antibody type
- Monoclonal
- Antigen
- Purifed from natural sources
- Description
- MA5-15679 targets HK2 in indirect ELISA, FACS, IHC and WB applications and shows reactivity with Human samples. The MA5-15679 immunogen is purified recombinant fragment of human HK2 expressed in E. Coli. MA5-15679 detects HK2 which has a predicted molecular weight of approximately 102kDa.
- Reactivity
- Human
- Host
- Mouse
- Isotype
- IgG
- Antibody clone number
- 3D3
- Vial size
- 100 μL
- Concentration
- Conc. Not Determined
- Storage
- Store at 4°C short term. For long term storage, store at -20°C, avoiding freeze/thaw cycles.
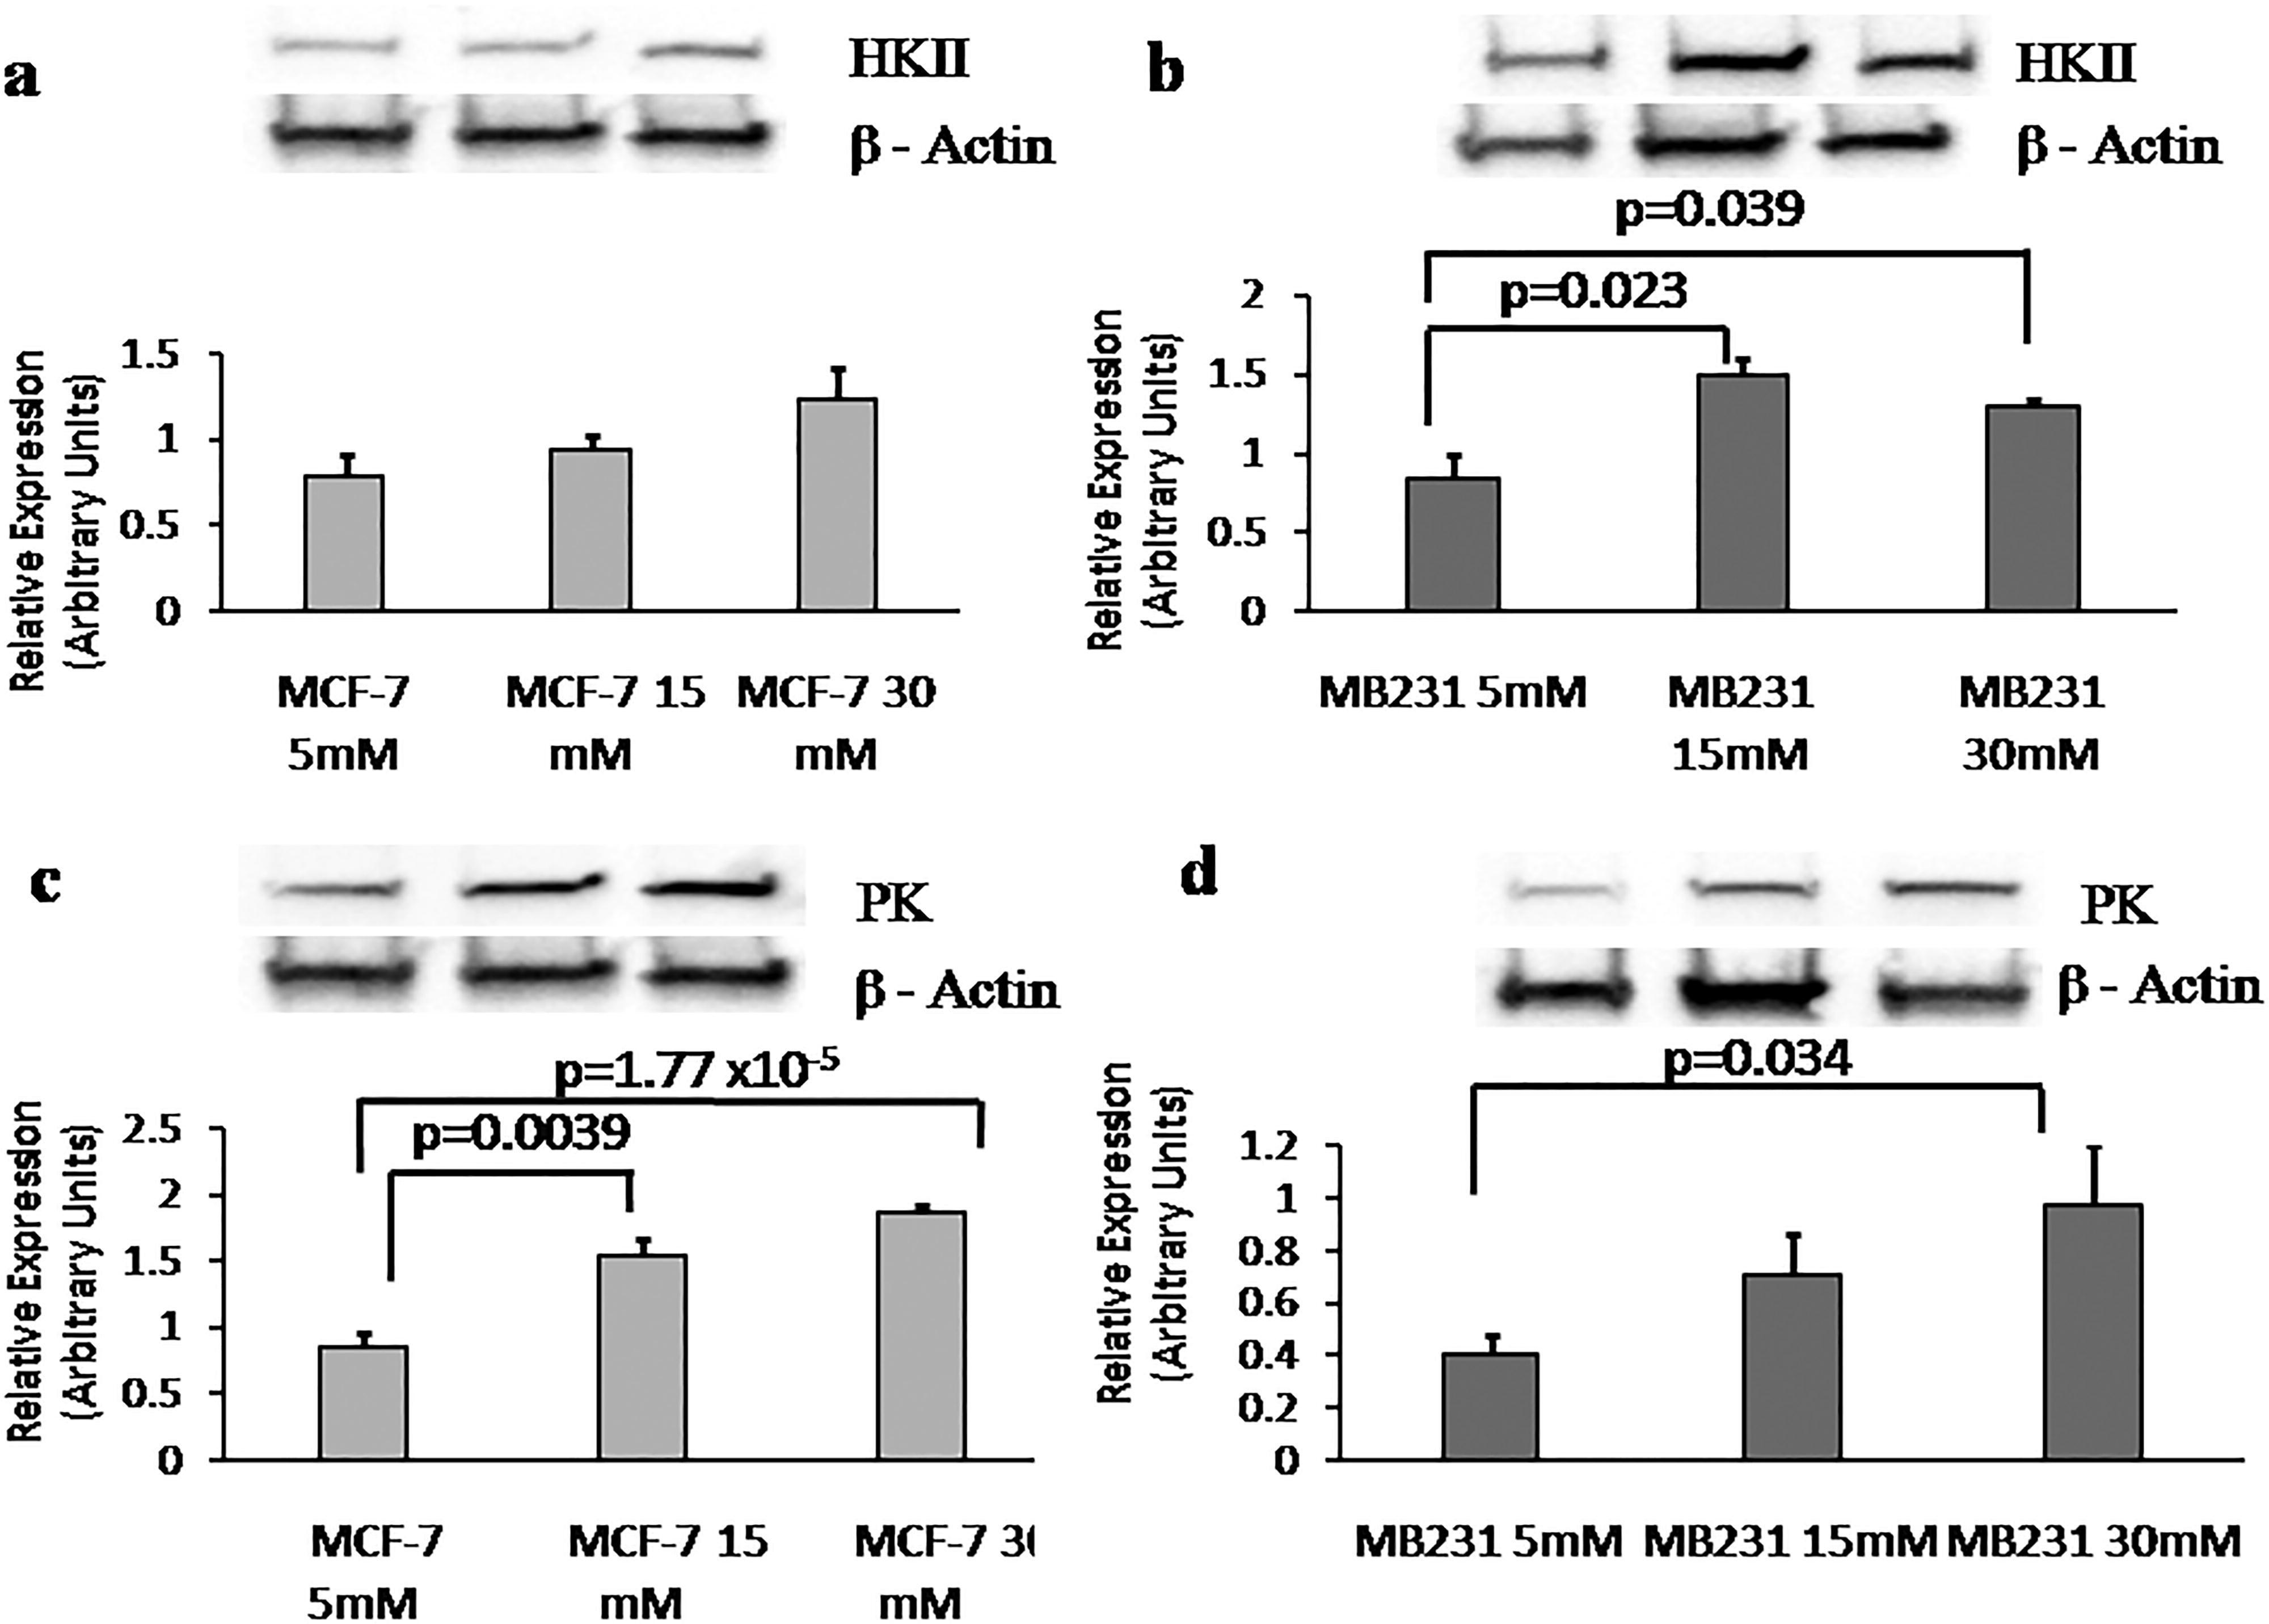
Submitted references Higher Glucose Enhances Breast Cancer Cell Aggressiveness.
Targeting metabolic plasticity in glioma stem cells in vitro and in vivo through specific inhibition of c-Src by TAT-Cx43(266-283).
Santos JM, Hussain F
Nutrition and cancer 2020;72(5):734-746
Nutrition and cancer 2020;72(5):734-746
Targeting metabolic plasticity in glioma stem cells in vitro and in vivo through specific inhibition of c-Src by TAT-Cx43(266-283).
Pelaz SG, Jaraíz-Rodríguez M, Álvarez-Vázquez A, Talaverón R, García-Vicente L, Flores-Hernández R, Gómez de Cedrón M, Tabernero M, Ramírez de Molina A, Lillo C, Medina JM, Tabernero A
EBioMedicine 2020 Dec;62:103134
EBioMedicine 2020 Dec;62:103134
No comments: Submit comment
Supportive validation
- Submitted by
- Invitrogen Antibodies (provider)
- Main image
- Experimental details
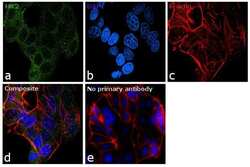
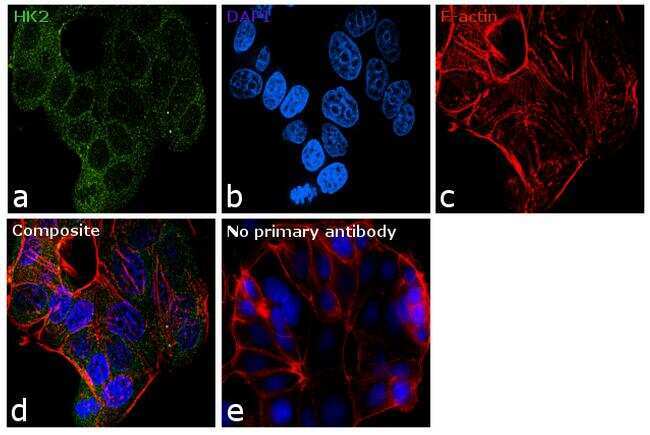
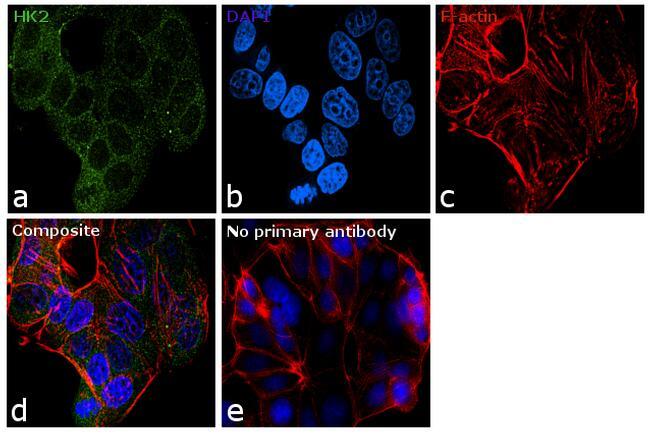
- Immunofluorescence analysis of HK2 was performed using 70% confluent log phase MCF-7 cells. The cells were fixed with 4% paraformaldehyde for 10 minutes, permeabilized with 0.1% Triton™ X-100 for 15 minutes, and blocked with 1% BSA for 1 hour at room temperature. The cells were labeled with HK2 Monoclonal Antibody (3D3) (Product # MA5-15679) at 1:100 dilution in 0.1% BSA, incubated at 4 degree Celsius overnight and then labeled with Goat anti-Mouse IgG (H+L) Superclonal™ Secondary Antibody, Alexa Fluor® 488 conjugate (Product # A27034) at a dilution of 1:2000 for 45 minutes at room temperature (Panel a: green). Nuclei (Panel b: blue) were stained with SlowFade® Gold Antifade Mountant with DAPI (Product # S36938). F-actin (Panel c: red) was stained with Rhodamine Phalloidin (Product # R415, 1:300). Panel d represents the merged image showing cytoplasmic localization. Panel e represents control cells with no primary antibody to assess background. The images were captured at 60X magnification.
- Submitted by
- Invitrogen Antibodies (provider)
- Main image

- Experimental details
- Immunofluorescence analysis of HK2 was performed using 70% confluent log phase MCF-7 cells. The cells were fixed with 4% paraformaldehyde for 10 minutes, permeabilized with 0.1% Triton™ X-100 for 15 minutes, and blocked with 1% BSA for 1 hour at room temperature. The cells were labeled with HK2 Monoclonal Antibody (3D3) (Product # MA5-15679) at 1:100 dilution in 0.1% BSA, incubated at 4 degree Celsius overnight and then labeled with Goat anti-Mouse IgG (Heavy Chain) Superclonal™ Secondary Antibody, Alexa Fluor® 488 conjugate (Product # A27034) at a dilution of 1:2000 for 45 minutes at room temperature (Panel a: green). Nuclei (Panel b: blue) were stained with SlowFade® Gold Antifade Mountant with DAPI (Product # S36938). F-actin (Panel c: red) was stained with Rhodamine Phalloidin (Product # R415, 1:300). Panel d represents the merged image showing cytoplasmic localization. Panel e represents control cells with no primary antibody to assess background. The images were captured at 60X magnification.
Supportive validation
- Submitted by
- Invitrogen Antibodies (provider)
- Main image
- Experimental details
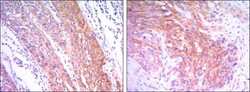
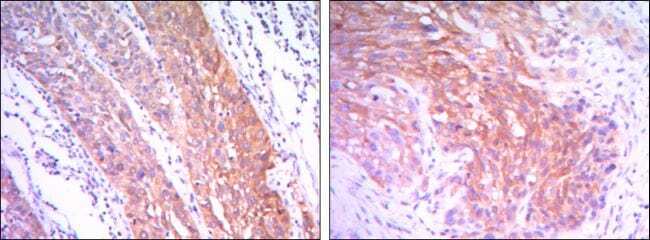
- Immunohistochemical analysis of paraffin-embedded esophagus cancer tissues (left) and human lung cancer (right) using HK2 monoclonal antibody (Product # MA5-15679) followed with DAB staining.
Supportive validation
- Submitted by
- Invitrogen Antibodies (provider)
- Main image

- Experimental details
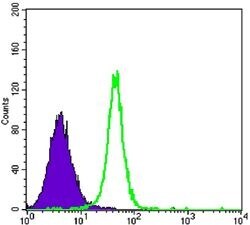
- Flow cytometric analysis of K562 cells using HK2 monoclonal antibody (Product # MA5-15679) (green) and negative control (purple).
- Submitted by
- Invitrogen Antibodies (provider)
- Main image

- Experimental details
- Flow cytometric analysis of K562 cells using HK2 monoclonal antibody (Product # MA5-15679) (green) and negative control (purple).

Supportive validation
- Submitted by
- Invitrogen Antibodies (provider)
- Main image
- Experimental details
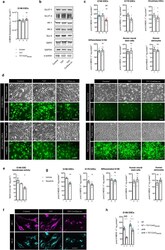
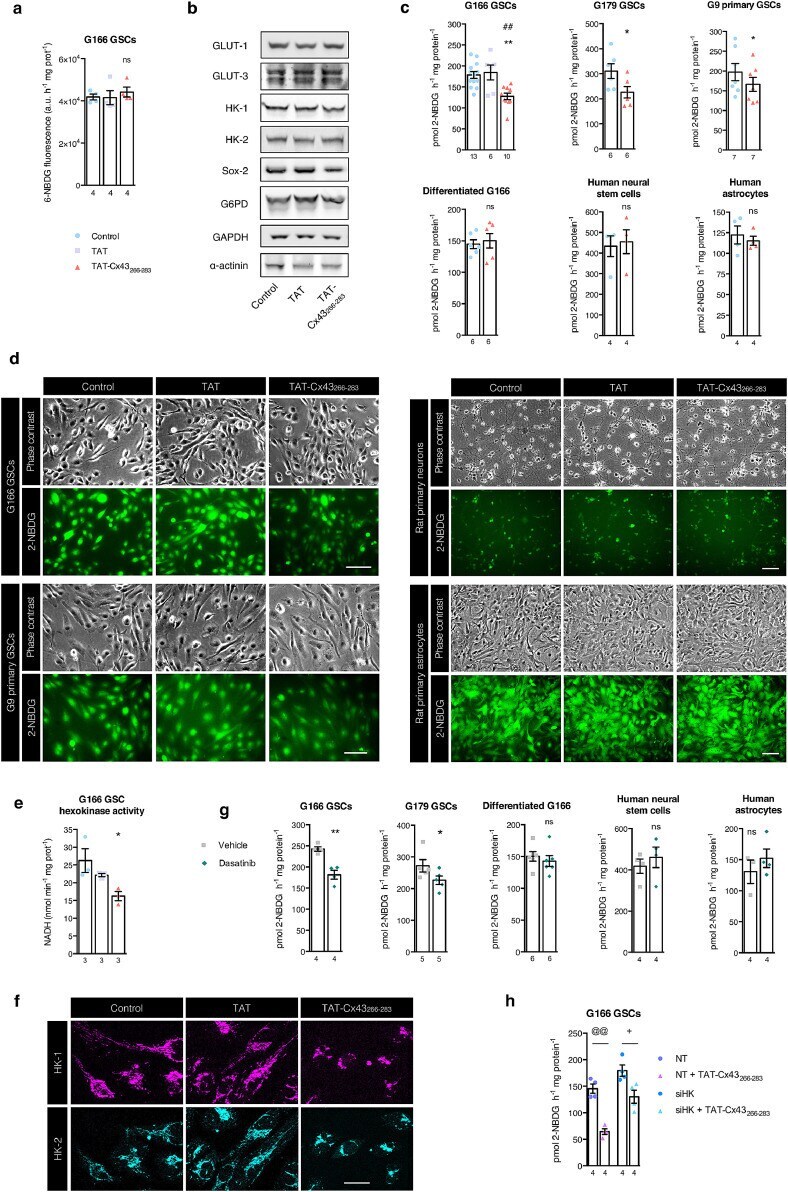
- Fig. 1 TAT-Cx43 266-283 decreases glucose uptake through HK activity selectively in GSCs. Cells were treated with 50 muM TAT or TAT-Cx43 266-283 for 24 h prior to the assays where indicated. ( a ) Glucose transport was estimated with the non-phosphorylatable fluorescent glucose analogue 6-NBDG. G166 GSCs were incubated with 146 muM 6-NBDG for 1 h and lysed, and 6-NBDG fluorescence was measured in a microplate fluorometer. ( b ) Representative western blots of the indicated proteins. GAPDH and alpha-actinin blots are shown as loading controls. ( c ) Quantification of 2-NBDG uptake in G166 GSCs, G179 GSCs, G9 primary GSCs, differentiated G166 glioblastoma cells, human neural stem cells, and human astrocytes after TAT or TAT-Cx43 266-283 treatment. Cells were incubated with 146 muM of the fluorescent glucose analogue 2-NBDG for 1 h. ( d ) Representative micrographs showing that, while 2-NBDG uptake was not affected in neurons and astrocytes, G166 and G9 GSCs exhibited reduced 2-NBDG uptake promoted by TAT-Cx43 266-283 . Scale bar: 100 mum. ( e ) Hexokinase activity in GSCs determined as described in the Methods. ( f ) G166 GSCs immunostained for HK-1 (magenta) and HK-2 (cyan). Representative micrographs showing that HK-1 and HK-2 display mostly a mitochondrial distribution and that, in GSCs treated with TAT-Cx43 266-283 , HK-1 and HK-2 staining is condensed near the cell nuclei. Scale bar: 25 mum. ( g ) Quantification of 2-NBDG uptake in G166 GSCs, G179 GSCs, G9 primary GSCs, di
- Submitted by
- Invitrogen Antibodies (provider)
- Main image

- Experimental details
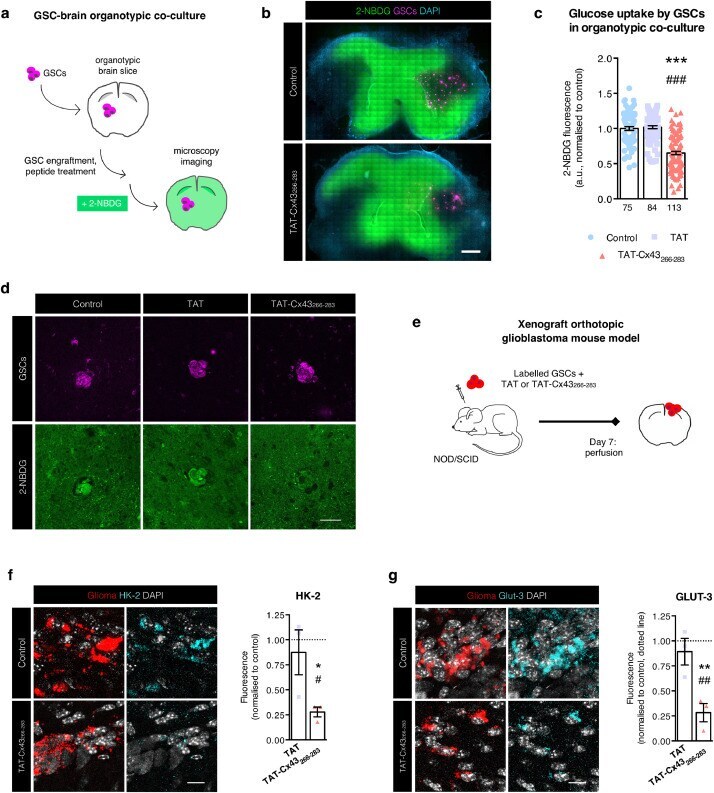
- Fig. 4 TAT-Cx43 266-283 impairs glucose metabolism ex vivo and in vivo. ( a ) Schematic drawing of the 2-NBDG uptake experiments in GSC-organotypic brain slice co-cultures. A total of 2500 fluorescently labelled GSCs were placed onto each organotypic brain slice and allowed to integrate overnight. The GSC-brain slice co-cultures were incubated with 50 muM TAT or TAT-CX43 266-283 for 48 h. Then, the co-cultures were incubated with 146 muM 2-NBDG for 1 h and analysed by confocal microscopy. ( b ) Representative mosaic photomicrographs of GSC-brain slice co-cultures incubated with 146 muM 2-NBDG. Note the similar levels of 2-NBDG uptake (green) by the brain parenchyma in control and TAT-Cx43 266-283 -treated co-cultures. Scale bar: 1 mm. ( c ) 2-NBDG fluorescence (mean grey value) was quantified in the ROIs corresponding to GSC fluorescence in confocal microscopy images. ( d ) Representative confocal microscopy images showing the reduction in 2-NBDG uptake (green) specifically in GSCs (magenta) in the GSC-brain slice co-cultures treated with TAT-Cx43 266-283 . Scale bar: 50 mum. ( e ) Schematic drawing of the in vivo experimental design. Briefly, 5000 human GSCs fluorescently labelled with PKH26 or constitutively expressing mCherry were intracranially injected alone (control) or together with 100 muM TAT or TAT-Cx43 266-283 into the brains of NOD/SCID mice. After 7 days, the animals were perfused, and their brains were processed for immunofluorescence and analysed by confocal mi
- Submitted by
- Invitrogen Antibodies (provider)
- Main image
- Experimental details
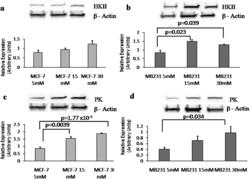
- Figure 2. Immunoblots of expression of HKII and quantification of expression in lowly metastatic breast cancer cells MCF-7 (a) and highly metastatic breast cancer cells MB231 (b) with different D-(+)-glucose concentrations after 72 h: 5 mM (physiological) and higher 15 and 30 mM. Immunoblots of expression of PK and quantification of expression in MCF-7 (c) and MB231 (d). HKII MCF-7 and MB231 N = 4, PK MCF-7 N = 5 and MB231 N = 4. One-way ANOVA, +-SEM.