 Explore
 Validate
 Learn
Learn Western blot
 ELISA
ELISA Immunocytochemistry
Antibody data
- Antibody Data
- Antigen structure
- References [1]
- Comments [0]
- Validations
- Immunocytochemistry [1]
- Other assay [3]
Submit
Validation data
Reference
Comment
Report error
- Product number
- PA5-97705 - Provider product page

- Provider
- Invitrogen Antibodies
- Product name
- EMP3 Polyclonal Antibody
- Antibody type
- Polyclonal
- Antigen
- Recombinant full-length protein
- Reactivity
- Human, Mouse
- Host
- Rabbit
- Isotype
- IgG
- Vial size
- 100 μg
- Concentration
- 1 mg/mL
- Storage
- -20°C or -80°C if preferred
Submitted references EMP3 mediates glioblastoma-associated macrophage infiltration to drive T cell exclusion.
Chen Q, Jin J, Huang X, Wu F, Huang H, Zhan R
Journal of experimental & clinical cancer research : CR 2021 May 8;40(1):160
Journal of experimental & clinical cancer research : CR 2021 May 8;40(1):160
No comments: Submit comment
Supportive validation
- Submitted by
- Invitrogen Antibodies (provider)
- Main image
- Experimental details
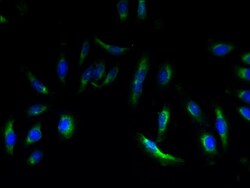
- Immunofluorescent analysis of EMP3 in Hela cells using a EMP3 polyclonal antibody (Product # PA5-97705) at a dilution of 1:100. Alexa Fluor 488-congugated Goat Anti-Rabbit IgG(H+L) secondary antibody was used.

Supportive validation
- Submitted by
- Invitrogen Antibodies (provider)
- Main image
- Experimental details
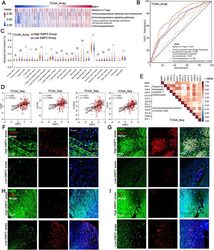
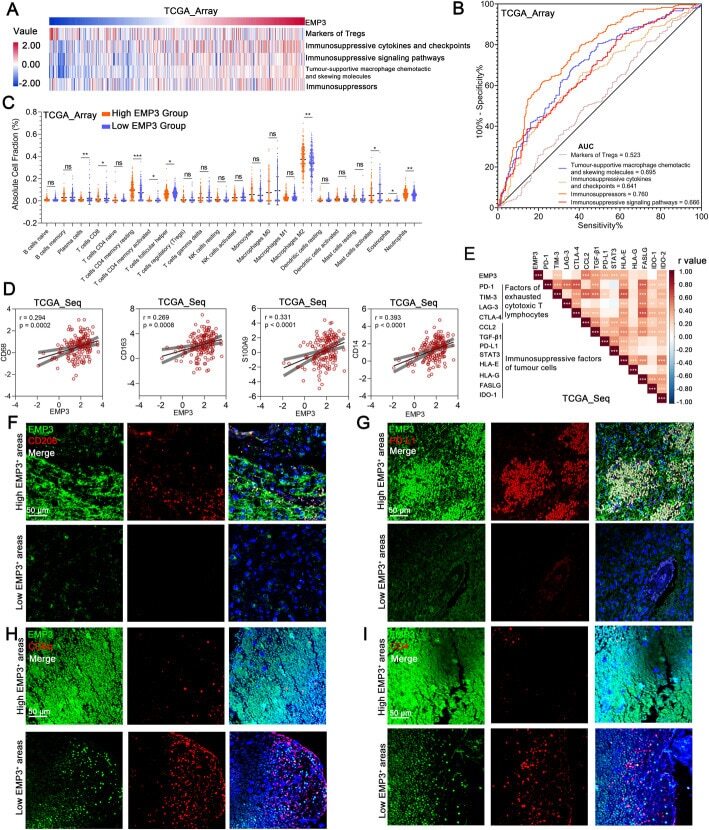
- Fig. 1 EMP3 is associated with immunosuppression in GBM. a Pearson correlation analysis of the expression of EMP3 with GBM-associated immunosuppressive metagenes in the TCGA_array GBM dataset ( n = 475). b ROC curves indicated that high EMP3 was involved in immunosuppression in the TCGA_array GBM dataset ( n = 475). c Immune cell fractions were estimated using CIBERSORT, and the differences between the cell fractions of the high and low EMP3 groups in the TCGA_array GBM dataset were evaluated using Student''s t-test ( n = 475). d Pearson correlation plots of the expression of EMP3 with M2 TAM signature markers (CD68, CD163, S100A9, and CD14) in the TCGA_array GBM dataset ( n = 475). e Correlation coefficient graph revealing the correlations of EMP3 with common immunosuppressive factors in the TCGA_seq GBM dataset ( n = 153). f Representative images of immunofluorescence (IF) staining for EMP3 and CD206 in different areas of serial sections from human GBM samples ( n = 27). Scale bar = 50 mum. g Representative images of IF staining for EMP3 and PD-L1 in different areas of serial sections of human GBM samples ( n = 27). Scale bar = 50 mum. h Representative images of IF staining for EMP3 and CD8alpha in different areas of serial sections from human GBM samples ( n = 27). Scale bar = 50 mum. I. Representative images of IF staining for EMP3 and CD4 in different areas of serial sections of human GBM samples ( n = 27). Scale bar = 50 mum. The mean +- S.D. is shown. Ns: nonsignifican
- Submitted by
- Invitrogen Antibodies (provider)
- Main image
- Experimental details
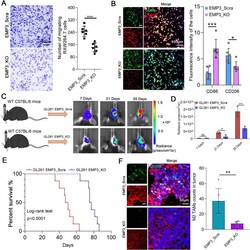
- Fig. 2 EMP3 could induce macrophage polarization. a Migration assays performed with RAW264.7 cells exposed to supernatants from EMP3_KO GL261 cells or EMP3_Scra GL261 cells. Scale bar = 100 mum. The histogram summarizes the number of migrating cells. Student''s t-test was performed. KO: Knockout; Scra: Scramble. b Representative images of IF staining for CD86 and CD206 in mouse BV-2 cells exposed to supernatants from EMP3_KO GL261 cells or EMP3_Scra GL261 cells. The histogram summarizes the fluorescence intensity of the cells. Student''s t-test was performed. Scale bar = 100 mum. KO: Knockout; Scra: Scramble. c Left: Schematic diagram of the orthotopic GBM model. Right: Bioluminescence images of BALB/c mice in the EMP3_KO and EMP3_Scra GL261 groups on days 14, 21 and 35. KO: Knockout; Scra: Scramble. d Quantification of the bioluminescence imaging signal intensities in C57BL/6 mice. Student''s t-test was performed. e Kaplan-Meier survival curves of mice bearing intracranial EMP3_KO or EMP3_Scra GL261 tumours. KO: Knockout; Scra: Scramble. The log-rank test was performed. f Representative images of IF staining for EMP3 and CD206 in mouse brain sections from the EMP3_KO and EMP3_Scra GL261 groups. The histogram summarizes the fluorescence intensity of the isolated brain tumour tissues ( n = 3). KO: Knockout; Scra: Scramble. Student''s t-test was performed. Scale bar = 50 mum. The mean +- S.D. is shown. Ns: nonsignificant, * p < 0.05, ** p < 0.01, and *** p < 0.001

- Submitted by
- Invitrogen Antibodies (provider)
- Main image
- Experimental details
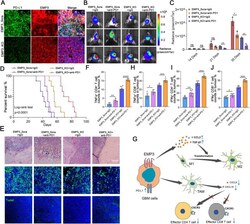
- Fig. 6 Knockout of EMP3 and immune checkpoint blockade have synergistic antitumorigenic effects. a Representative images of IF staining for EMP3 and PD-L1 in mouse brain tissues from the EMP3_KO and EMP3_Scra GL261 groups. Scale bar = 50 mum. KO: Knockout; Scra: Scramble. b Bioluminescence images of EMP3_KO and EMP3_Scra C57BL/6 mice treated with isotype IgG or PD1 blockade. KO: Knockout; Scra: Scramble. c Quantification of the bioluminescence imaging signal intensities in C57BL/6 mice. Student''s t-test was performed. d Kaplan-Meier survival curves of mice bearing intracranial EMP3_KO or EMP3_Scra GL261 tumours treated with an anti-PD1 antibody or isotype IgG. KO: Knockout; Scra: Scramble. The log-rank test was performed. e Tumour sections from the EMP3_KO and EMP3_Scra GL261 groups treated with the anti-PD1 antibody or isotype IgG were used for a TUNEL assay, IF staining and H&E analysis. Upper: Fluorescence images of TUNEL staining in tumours. Middle: Representative images of IF staining for Ki67 in tumours. Lower: H&E staining of tumour sections. Scale bar = 100 mum. f - h Percentages of TNFalpha + CD4 + and TNFalpha + CD8 + T cells in tumours from the EMP3_KO and EMP3_Scra GL261 groups treated with the anti-PD1 antibody or isotype IgG. Student''s t-test was performed. KO: Knockout; Scra: Scramble. i - j Percentages of IFN-gamma + CD4 + and IFN-gamma + CD8 + T cells in tumours from the EMP3_KO and EMP3_Scra GL261 groups treated with the anti-PD1 antibody or isotype IgG. S
